
ABSTRACT
Background: Hemodynamic responses to exercise are used as markers of diagnosis for cardiac diseases, systolic blood pressure (SBP) especially. However, the reference values for SBP in children at peak exertion level are outdated. This study aimed to establish current reference values for SBP, rate pressure product (RPP), and circulatory power (CircP).
Methods: Data from children who previously underwent cardiopulmonary exercise testing were categorized as healthy (N = 184; age 12.6 ± 2.9 years), and CoA patients (N = 25; age 13.0 ± 3.2 years). With the Lambda-Mu-Sigma (LMS) method, percentile curves were made for SBP, CircP, and RPP in function of peak work rate (Wpeak). Data of CoA patients were used to validate the reference values.
Results: Wpeak was the best predictor of peak SBP during exercise. The prediction equations for SBP, CircP and RPP were: (0.2853 x Wpeak) + 111.46; (10.56 x Wpeak) + 2550.2 and (61.879 x Wpeak) + 19.887, respectively. CoA patients showed significantly increased values for peak SBP (Z-score 1.063 ± 1.347).
Conclusion: This study provides reference values for SBP, RPP, and CircP at peak exercise. These values can be used for objective evaluation of participants 6–18 years of age in a Dutch population.
1. Introduction
Cardiopulmonary exercise testing (CPET) is an important clinical tool to assess the functions of the pulmonary, circulatory, and musculoskeletal systems [Citation1,Citation2]. In pediatric cardiology, CPET has become a standard procedure for monitoring and diagnosing patients with cardiorespiratory diseases [Citation3,Citation4]. The current relevant literature mostly focuses on the diagnostic and prognostic value of maximum oxygen uptake during CPET [Citation5,Citation6]. However, systolic blood pressure (SBP) and other hemodynamic measurements give significant insight into the cardiovascular function during exercise, as well [Citation7,Citation8].
SBP has been a point of interest in diagnostic pediatrics in the last decade. Elevated SBP during exercise is reported to be a predictor of hypertension in otherwise normotensive children and adolescents [Citation9,Citation10]. Exercise-induced elevated SBP is being used to determine the status of postoperative patients with different congenital heart diseases (CHD) [Citation3].
In fact, recurrence of coarctation of the aorta (CoA) can be detected through exaggerated SBP during CPET [Citation11,Citation12]. CoA is a congenital disease that leads to the narrowing of the aorta that is usually corrected early on in life. Continuous monitoring of these patients is essential because narrowing of the aorta may come back. Elevated SBP values due to CPET is an increasingly popular way to detect any obstructions forming that do not cause any difference in resting BP.
Derivatives of SBP can be used as predictors for other CHDs, as well. Peak circulatory power (CircP), the product of mean BP at peak exercise and maximum oxygen uptake, can predict adverse events among adult patients with CHD [Citation13]. Mandan et al. suggested that CircP may also be of use in a pediatric population [Citation14]. Patients with very low CircP would be classified as poor-functioning and at-risk for ventricular dysfunction, systematic complications, or heart failure.
Rate pressure product (RPP) is another metric derived from the multiplication of peak SBP values and peak heart rate (HR). This product has been reported to describe myocardial blood flow and myocardial oxygen in exercising humans [Citation15,Citation16]. This parameter is frequently employed to detect any problems in the myocardium in children with CHD as well [Citation8].
There is currently no standard CPET protocol for children. However, in the pursuit of reliable SBP values for children, cycle ergometry is more favorable than treadmill ergometry. The former reads a more reliable ECG and BP measurement than the latter due to the upper body being less stable on a treadmill. Despite the clinical significance of SBP values for children and its relatively inexpensive way to record them, there is a lack of prevalent normative data. In 2015, a systematic review of all studies that offered reference values of pediatric CPET between 1980 and 2014 was done [Citation17]. Not one of these studies included reference values for SBP. One of the most adequate reference values for SBP for children and adults during cycle ergometer testing dates to Heck et al. in 1984 who collected their data between 1968 and 1982 [Citation18]. Since then technological advances have redefined CPET with automatic devices [Citation19]. Also, applying reference values decades old could lead to a misdiagnosis since these said values do not consider the changes in health, body composition, and lifestyle in children over the years. Recently, Szmigielska et al. [Citation20] have reported blood pressure (BP) responses to exercise in a large cohort of young pediatric athletes from Poland. However, because these children and adolescents had a very high training status, it is unclear whether these values are applicable for the general pediatric population.
Therefore, the primary objective of the study was to establish pediatric reference values for peak SBP, peak CircP, and peak RPP during a cycle exercise test. Our secondary objective was to validate the results found by comparing them to the abnormal CPET measurements of postoperative CoA patients.
2. Methods
2.1. Design
This investigation was designed to be a single-center, cross-sectional analysis.
2.2. Information sources and search strategy
Participant information was collected from the electronic medical records of University Medical Center’s Wilhelmina Children’s Hospital (WKZ) in Utrecht, the Netherlands. Children and young adults between the ages of 6 and 18 who underwent ergometer cycle testing between 2008 and 2016 were used. These participants came in either to be healthy volunteers for other research projects or were thought to have some abnormality but the diagnosis was negative
2.3. Participant selection
The CPET results and medical records were screened to compile a suitable study population. The population was then confirmed by an experienced exercise physiologist (TT). All participants signed an informed consent form before CPET and were not given any financial compensation for their efforts. The Medical Ethics Committee of the University Medical Center Utrecht approved the use of the de-identified patient care data.
2.4. Inclusion criteria
Participants were categorized in two different groups: healthy volunteers and postoperative CoA patients. Children and adolescents were included in the healthy volunteer population if they were between the ages of 6 and 18 years old (the entire age range for exercise testing in a pediatric hospital), there were no complications or arrhythmias during their CPET, and they had no evidence of BP abnormalities or CHD symptoms. Participants in the CoA group had to fulfill the first two criteria of the healthy volunteer population as well as have had a surgical correction of the CoA of the aorta. Participant characteristics can be seen in .
Table 1. Sample characteristics – population size, gender, age, stature, body mass, and body mass index (BMI).
2.5. Protocol procedure
2.5.1. Anthropometric measures
Body mass (kg) and stature (cm) were determined using an electronic scale (Seca 203; Seca, Hamburg, Germany) and a stadiometer (Ulmer Stadiometer; Prof. E. Heinze, Ulm, Germany), respectively. Body mass index was calculated as the body mass divided by stature squared. The equation of Haycock et al. [Citation21], validated in infants, children, and adults, was used to obtain the patient’s body surface area (BSA).
2.6. Cardiopulmonary exercise test
All participants performed a CPET on an electronically braked cycle ergometer (Lode Corival; Lode BV, Groningen, the Netherlands). Seat height was adjusted to the child’s leg length. During the CPET, participants started with three minutes of unloaded cycling, after which the work rate (WR) was increased by 10, 15, or 20 W∙min−1, depending on the participant’s stature (<125 cm, between 125 and 150 cm, and >150 cm, respectively) [Citation22], in a ramp-like manner (2, 3, or 4 W∙12 s−1). Patients had to maintain a pedaling frequency between 60 and 80 revolutions∙min−1. Peak exercise was defined as the point at which there was a sustained drop in pedaling frequency from 60 revolutions∙min−1, despite strong verbal encouragement. A test was considered to be at or near the maximal level if at least one of the following criteria was met: an HR at peak exercise (HRpeak) >180 beats∙min−1 or an respiratory exchange ratio (RER) at peak exercise (RERpeak) >1.0 [Citation23].
During the test, HR was determined via a 12-lead electrocardiogram (Cardioperfect; Accuramed BVBA, Lummen, Belgium) and peripheral oxygen saturation (SpO2) at the index finger was measured by pulse oximetry (Masimo Rad-8; Masimo Inc., Irvine, CA, USA). Moreover, children breathed through a facemask (Hans Rudolph, Kansas City, MO, USA) during the CPET, with the purpose to perform breath-by-breath respiratory gas analysis and volume measurements using a respiratory gas analysis system (ZAN 600; Accuramed BVBA, Lummen, Belgium). Gas analyzers were calibrated using gases of known concentration, while the flowmeter was calibrated using a 3-L syringe (Hans Rudolph, Kansas City, MO, USA). Minute ventilation (VE), oxygen uptake (VO2), carbon dioxide production (VCO2), and RER were calculated from conventional equations. Output from the flowmeter and gas analyzers were averaged over 10-s intervals and stored for further use. Peak exercise parameters were defined as the highest values achieved within the last 30 s prior to maximal exertion.
2.7. Blood pressure
All participants’ BP was recorded in the right arm every 2 min and at peak exercise. For this study only BP at peak exercise was used for analysis. The Suntech Tango+ ® system (SunTech Medical Instruments, Morrisville, North Carolina, USA) was used and is an operator free, reliable, and valid system to measure BP during exercise [Citation24]. A variety of differently sized BP cuffs were available to ensure a proper fit.
RPP was calculated as the product of peak SBP (in mm Hg) and peak HR (bpm). CircP was calculated as the product of mean BP (=(SBP+(2 x diastolic BP)/3) (in mm Hg) and VO2peak (in ml/kg/min) [Citation13].
2.8. Data analysis
With the use of the LMS Chartmaker Pro program™ software, smooth percentile curves were generated portraying the normal distribution of peak SBP, peak CircP, and peak RPP as it changed with Wpeak using the Lambda-Mu-Sigma (LMS) method [Citation25]. The normalization is obtained from a power transformation that includes stretching and shrinking the tails of the distribution. The three curves representing optimal power to obtain normality (L), mean (M), and coefficient of variation (S) [Citation25]. The curves were fitted as cubic splines by nonlinear regression using penalized likelihood [Citation25]. Curves representing the percentiles of P3, P10, P25, P50, P75, P90, and P97 were used to show the normal range of the reference values.
Construct validity (known groups method) was of the reference values was tested using the CoA patient data. Z-scores were calculated for each parameter to further analyze whether there was a difference between the normative parameters and the CoA patient data.
3. Results
After removal of duplicate records and initial screening, 184 records of healthy children and adolescents, and 25 records of CoA patients were included. The characteristics are presented in .
3.1. Data analysis
Predictive equations of peak SBP, CircP, and RPP in function of Wpeak based on the LMS method are shown in . In , , and reference percentiles are overlapped with the scatterplot data of the postoperative CoA patients. clearly shows four participants that lay on or above the P97 curve. As high as 80% of the CoA patients have SBP values over the P50 curve. Calculated mean Z-scores for the CoA population for SBP, CircP, and RPP are 1.063, −0.176, and 0.486, respectively.
Figure 1. Percentiles of peak systolic blood pressure (SBP) in function of Wpeak achieved in healthy participants plotted on the same graph as the similar data of post-operative CoA patients.
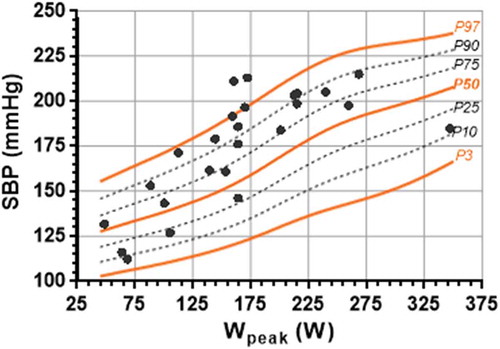
Figure 2. Percentiles of peak circulatory power (CircP) in function of Wpeak achieved in healthy participants plotted on the same graph as the similar data of post-operative CoA patients.
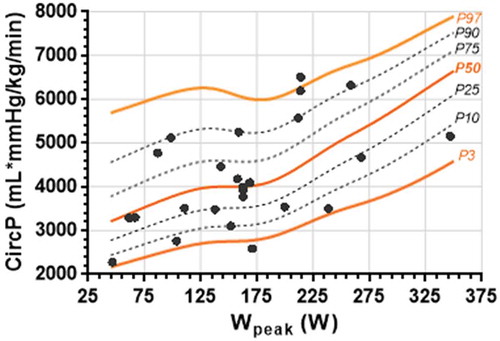
Figure 3. Percentiles of peak rate pressure product (RPP) in function of Wpeak achieved in healthy participants plotted on the same graph as the similar data of post-operative CoA patients.
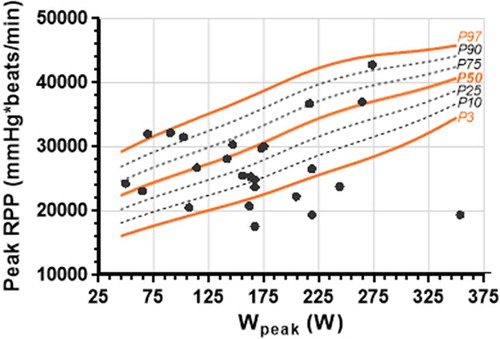
Table 2. Predictive equations of peak SBP, CircP, and RPP in function of Wpeak (W) based on the LMS method.
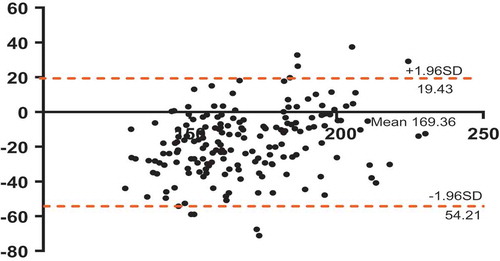
A large 95% confidence interval was observed between our recorded SBP and the expected SBP values per the prediction equation of Heck et al. [Citation18]. The mean difference was 17.39 with an SD of 18.78. The Bland–Altman plot also illustrated high variation between the values ().
Figure 4. A Bland-Altman plot illustrating the agreement between the healthy systolic blood pressure (SBP) data that this study recorded and the SBP data that was outputted by the Heck et al. predictive equation (SBP = 0.333*(Wpeak) +120.0). The dotted lines annotate the upper and lower 95% confidence interval values.
4. Discussion
The primary aim of this study was to establish pediatric reference values for SBP, circulatory power, and RPP at peak exercise. Under the strain of a WR, the intramuscular pressure in the skeletal muscle increases. As a result, the resistance in the vascular bed is increased, and the heart of a healthy child will pump harder to overcome this resistance to pump blood to the exercising musculature. Thus, SBP increases with increased WR. If a heart is failing and does not have the ability to sufficiently increase the cardiac output, the SBP would not likely change like that of a healthy child. Thus, the pediatric CPET is a useful way to diagnose and evaluate cardiac diseases in children.
In fact, it is now common practice to use CPET measurements to identify cardiac diseases like arrhythmia, ventricular tachycardia, and congenital long QT syndrome [Citation26]. CPET can also be used to monitor exercise-induced hypertension in children which is an important indicator of hypertension in the future [Citation9,Citation10]. However, current literature lacks hemodynamic reference values to compare the unhealthy responses to. Our reference values could be easily used clinically to determine the status of children’s cardiac problems since the exercise protocol in this study is suitable for clinical testing of children of different stature, age, and physical ability.
We chose to compare our reference values to that of CoA patients since it has been established in the literature that this population can experience exercise-induced hypertension postoperatively [Citation27–Citation29]. Clear visualization of the abnormal distribution of CoA patients in indicates that our reference values correctly identify the problem. Additionally, peak SBP values of postoperative CoA patients showed the highest deviation from normal when compared to that of peak CircP and peak RPP. This further indicates that our reference values correctly distinguish the exaggerated SBP response to CPET that characterizes (some) postoperative CoA patients [Citation27–Citation29].
Postoperative CoA patients have been proven to have a relatively low peak HR and peak oxygen uptake at their maximum WR [Citation30]. In turn, their CircP and RPP values are expected to be low at maximum WR. Over 50% of the CoA patients lie below the mean CircP curve for each of their individual peak WRs in . Also, clearly illustrates six CoA patients that have RPP values below the P3 curve. Both parameters can be easily seen as atypical when compared to our reference values.
We also compared our data to that of the Heck et al. [Citation18] which was appropriate because the latter also followed a cycle method with an incremental increase of WR. Although their inclusion criteria were comparable to ours, their sample was much larger (2972) and included adults and athletes as well. Only a minority of the participants were under the age of 18. Heck et al. [Citation18] also selected their sample from complied medical records at their institution in Germany which was similar to our sample selection process. The biggest differences might be that they obtained the SBP values using manual measurements, while we used an automatic operator-free BP device. This may explain the differences between our results and those from Heck et al. We found on average a peak SBP value of 17 mm Hg lower compared to those predicted by Heck based on WR. Our results suggest that the prediction equation established by Heck et al. [Citation18] might not be a good representation of the peak SBP values in children and adolescents nowadays. Another difference is in the used exercise testing protocols. The protocol of Heck et al. [Citation18] increased the work load at rate of 40 W/3 min. This incremental increase is very large for children and would lead to tests with shorter durations than needed to accurately measure peak SBP. Moreover, the Heck et al. [Citation18] protocol did not use a pediatric BP cuff (same cuff size for all participants) like our protocol. These discrepancies explain part of the observed differences.
With this promising normative clinical data, we developed prediction equations to easily access reference exercise response variables. The equations can be programmed into CPET equipment to let clinicians quickly and accurately interpret CPET results. However, these reference values were reached by the means of a cycle protocol. These values may be specific to incremental maximal cycle exercise and have less diagnostic utility with CPET measurements stemming from other protocol types (e.g. treadmill, rowing). SBP, CircP, and RPP measurements induced by a CPET on a treadmill cannot be compared to the currently developed equations. Treadmill testing entails a different method of calculating Wpeak than cycle testing; therefore, the Wpeak-based reference values could give an invalid value [Citation31]. Furthermore, these reference values do not consider the more pronounced hypertensive response to exercise common in obese participants [Citation32].
However, SBP is influenced by an individual’s age, body mass, and gender. Since Wpeak is also influenced by those factors, relating SBP to Wpeak makes the reference values independent of these factors. Furthermore, the developed reference values can also be used in tests that were not maximally performed, since they are related to Wpeak, and not to peak exercise or VO2peak per se. That is also one of the strengths of this approach; also submaximally performed tests values are interpretable.
4.1. Strengths and limitations
A strength of this study is the use of an operator-free device. This rules out interobserver variability of BP recording. Furthermore, the used BP device is widely used in CPET equipment in many centers. The Suntech Tango provides reliable automatic BP assessment during exercise with an acceptable error [Citation24]. According to the manufacturer information, the used device meets or exceeds ANSI/AAMI/ISO 81,060–2:2009 standard for non invasive accuracy (±5 mm Hg mean error with 8 mm Hg standard deviation).
The main limitation to this study is the relatively low sample size; however, we had a broad age range. Together with the used statistical method, valuable reference values were developed that should validly describe healthy children’s hemodynamic responses to CPET. Another limitation was the fact that all measurements were collected from one single center, and all children and adolescents were from the Netherlands. This could have led to an ethnicity-specific reference range that does not accurately represent and describe all children and adolescents from different geographic regions.
4.2. Implications for clinical practice
These reference values provide a quantitative description of a healthy response to exercise and add to other pediatric exercise testing reference values [Citation17,Citation33]. Clinicians cannot determine an unhealthy response if they do not know what a healthy response is. Postoperative CoA and other patients suspected for abnormal BP responses should be monitored regularly to detect any abnormal BP regulation during exercise.
4.3. Recommendation for future research
These reference values should be updated regularly. Later, these values may not represent the normal SBP, CircP, and RPP responses of children and adolescents. Technological advances in the future could more accurately measure hemodynamic responses to CPET. This could lead to a healthy child’s measurements varying from our established reference values and, in turn, a misinterpretation of that child’s health. Moreover, the definition of normal health is dynamic. What is considered the average peak SBP value for children now might change with time due to change in for instance lifestyle. The established reference values of this study have a, currently unknown, expiration date and should be updated in the future.
We recommend collecting reference data from other ethnicities of children as well, as we know that reference standards differ between ethnicities [Citation7]. Applying these Dutch references to other countries could lead to misdiagnosis of an otherwise healthy child. Therefore should future studies collect pediatric CPET data among larger global multicenter initiatives in the same manner as has been done in the recent FRIEND database [Citation34].
5. Conclusion
This study provides reference values for BP response during cycling exercise in children and adolescents. References values for SBP, RPP, and CircP are provided for objective evaluation of participants with or without cardiac abnormalities. Global multicenter initiatives are required to develop multiethnic references values for both treadmill ergometry and cycle ergometry in children and adolescents.
6. Expert commentary
Although reference values for hemodynamic parameters during exercise are important for interpretation, these reference values are scarce. A strict use of reference values for the applicable participants (age, gender, amount of work performed) is required.
7. Five-year view
During the coming 5 years, a larger data set will become available describing the hemodynamic response to exercise in children, adolescents and adults. This data set will consist of reference values from different ethnicity, ergometry modes, and world regions. Also, more disease-specific reference values will become available. Within 5 years, reference values for hemodynamic parameters in children will be incorporated in standard software packages from metabolic cart manufacturers.
Key issues
There is currently a paucity of references values for the response of hemodynamic parameters during exercise such as blood pressure. No single set of ideal reference values are available.
Reference values in healthy populations provide the comparative basis for answering important questions concerning the normality of exercise responses in patients and can significantly impact the clinical decision-making process.
Reference values may expire over time and should be regularly updated.
Standardization of the methodology to generate reference values and method of reporting reference values is necessary to increase the generalizability of the reference values.
Reference values might differ between exercise modality (treadmill vs cycle ergometry).
Declaration of interest
The authors have no relevant affiliations or financial involvement with any organization or entity with a financial interest in or financial conflict with the subject matter or materials discussed in the manuscript. This includes employment, consultancies, honoraria, stock ownership or options, expert testimony, grants or patents received or pending, or royalties.
Additional information
Funding
References
- Paap D, Takken T. Reference values for cardiopulmonary exercise testing in healthy adults: a systematic review. Expert Rev Cardiovasc Ther. 2014 Dec;12(12):1439–1453. PubMed PMID: 25418758.
- Ross R, Blair SN, Arena R, et al. Importance of assessing cardiorespiratory fitness in clinical practice: a case for fitness as a clinical vital sign: a scientific statement from the American Heart Association. Circulation. 2016 Dec 13;134(24):e653–e99. PubMed PMID: 27881567.
- Paridon SM, Alpert BS, Boas SR, et al. Clinical stress testing in the pediatric age group: a statement from the American Heart Association Council on Cardiovascular Disease in the Young, Committee on Atherosclerosis, Hypertension, and Obesity in Youth. Circulation. 2006;113:1905–1920.
- Stephens P, Paridon SM. Exercise testing in pediatrics. Pediatr Clin North Am. 2004;51(6): 1569–1587, viii. PubMed PMID: 1703.
- Takken T, Blank AC, Hulzebos EH, et al. Cardiopulmonary exercise testing in congenital heart disease: (contra)indications and interpretation. Neth Heart J. 2009 Oct;17(10):385–392. PubMed PMID: 19949648. Pubmed Central PMCID: 2773030. Epub 2009/12/02. eng.
- Takken T, Blank AC, Hulzebos HJ. Respiratory gas exchange during exercise in children with congenital heart disease: methodology and clinical concepts. Curr Respir Med Rev. 2011;7(2):87–96.
- Alpert BS, Dover EV, Booker DL, et al. Blood pressure response to dynamic exercise in healthy children–black vs white. J Pediatr. 1981 Oct;99(4):556–560. PubMed PMID: 7277095.
- Riopel DA, Taylor AB, Hohn AR. Blood pressure, heart rate, pressure-rate product and electrocardiographic changes in healthy children during treadmill exercise. Am J Cardiol. 1979 Oct;44(4):697–704. PubMed PMID: 484499.
- Chen X, Wang Y. Tracking of blood pressure from childhood to adulthood: a systematic review and meta-regression analysis. Circulation. 2008 Jun 24;117(25):3171–3180. PubMed PMID: 18559702. Pubmed Central PMCID: 3568631.
- Demori RM, Doukky R, Conrad D, et al. Exaggerated blood pressure response to dynamic exercise predicts future diagnosis of hypertension in children and adolescents. JACC. 2014;63(12):A1367.
- Madueme PC, Khoury PR, Urbina EM, et al. Predictors of exaggerated exercise-induced systolic blood pressures in young patients after coarctation repair. Cardiol Young. 2013 Jun;23(3):416–422. PubMed PMID: 22967921.
- Das BB, Raj S, Shoemaker L. Exercise testing is useful to screen for residual coarctation in children. Pediatr Cardiol. 2009 Aug;30(6):763–767. PubMed PMID: 19449057.
- Giardini A, Specchia S, Berton E, et al. Strong and independent prognostic value of peak circulatory power in adults with congenital heart disease. Am Heart J. 2007 Sep;154(3):441–447. PubMed PMID: 17719287.
- Madan N, Beachler L, Konstantinopoulos P, et al. Peak circulatory power as an indicator of clinical status in children after Fontan procedure. Pediatr Cardiol. 2010 Nov;31(8):1203–1208. PubMed PMID: 20957479.
- Gobel FL, Norstrom LA, Nelson RR, et al. The rate-pressure product as an index of myocardial oxygen consumption during exercise in patients with angina pectoris. Circulation. 1978 Mar;57(3):549–556. PubMed PMID: 624164.
- Nelson RR, Gobel FL, Jorgensen CR, et al. Hemodynamic predictors of myocardial oxygen consumption during static and dynamic exercise. Circulation. 1974 Dec;50(6):1179–1189. PubMed PMID: 4430113.
- Blais S, Berbari J, Counil FP, et al. A systematic review of reference values in pediatric cardiopulmonary exercise testing. Pediatr Cardiol. 2015 Dec;36(8):1553–1564. PubMed PMID: 26036349.
- Heck H, Rost R, Hollman W. Normwerte des Blutdrucks bei der Fahrradergometrie. Deutsche Zeitschrift Für Sportmedizin. 1984;35(7):243–249.
- Alpert BS, Flood NL, Balfour IC, et al. Automated blood pressure measurement during ergometer exercise in children. Cathet Cardiovasc Diagn. 1982;8(5): 525–533. PubMed PMID: 7139706.
- Szmigielska K, Szmigielska-Kaplon A, Jegier A. Blood pressure response to exercise in young athletes aged 10 to 18 years. Appl Physiol Nutr Metab. 2016 Jan;41(1):41–48. PubMed PMID: 26683975.
- Haycock GB, Schwartz GJ, Wisotsky DH. Geometric method for measuring body surface area: a height- weight formula validated in infants, children, and adults. J Pediatr. 1978;93(1):62–66.
- Godfrey S. Exercise testing in children. London: W.B. Saunders Company Ltd; 1974. p. 1–168.
- Armstrong N, Welsman JR. Aerobic fitness. In: Armstrong NV, editor. Paediatric exercise science and medicine. Oxford: Oxford University Press; 2008. p. 97–108.
- Cameron JD, Stevenson I, Reed E, et al. Accuracy of automated auscultatory blood pressure measurement during supine exercise and treadmill stress electrocardiogram-testing. Blood Press Monit. 2004 Oct;9(5):269–275. PubMed PMID: 15472500.
- Cole TJ. The LMS method for constructing normalized growth standards. Eur J Clin Nutr. 1990 Jan;44(1):45–60. PubMed PMID: 2354692.
- Paridon SM, Alpert BS, Boas SR, et al. American Heart Association Council on Cardiovascular Disease in the young, clinical stress testing in the pediatric age group: a statement from the American Heart Association Council on Cardiovascular Disease in the Young, Committee on Atherosclerosis, Hypertension, and Obesity in Youth. Circulation. 2006 Apr 18;113(15):1905–1920. Epub 2006 Mar 27. PMID:16567564.
- Toro-Salazar OH, Steinberger J, Thomas W, et al. Long-term follow-up of patients after coarctation of the aorta repair. Am J Cardiol. 2002 Mar 1;89(5):541–547. PMID:11867038.
- O’Sullivan JJ, Derrick G, Darnell R. Prevalence of hypertension in children after early repair of coarctation of the aorta: a cohort study using casual and 24 hour blood pressure measurement. Heart. 2002 Aug;88(2):163–166. PMID:12117846.
- Guntheroth WG. Coarctation of the aorta. Long-term follow-up and prediction of outcome after surgical correction. Circulation. 1990 Apr;81(4):1441. PMID:2317924.
- Trojnarska O, Gwizdala A, Lanocha M, et al. Exercise testing in adults after repair of aortic coarctation evaluation of cardiopulmonary exercise capacity and b-type natriuretic protein levels. Tex Heart Inst J. 2007;34(4): 412–419. PMCID: PMC2170502.
- Massin MM. The role of exercise testing in pediatric cardiology. Arch Cardiovasc Dis. 2014 May;107(5):319–327. PubMed PMID: 24841496.
- Burger JP, Serne EH, Nolte F, et al. Blood pressure response to moderate physical activity is increased in obesity. Neth J Med. 2009 Sep;67(8):342–346. PubMed PMID: 19767664.
- Bongers BC, Hulzebos HJ, Van Brussel M, et al. Pediatric norms for cardiopulmonary exercise testing. 2nd ed. Hertogenbosch: Uitgeverij BOXPress; 2014.
- Kaminsky LA, Imboden MT, Arena R, et al. Standards for cardiorespiratory fitness measured with cardiopulmonary exercise testing using cycle ergometry: data from the Fitness Registry and the Importance of Exercise National Database (FRIEND) Registry. Mayo Clinic Proc. 2017 Feb;92(2):228. PubMed PMID: 27938891.