
ABSTRACT
Introduction: Reference values for cardiopulmonary exercise testing (CPET) parameters provide the comparative basis for answering important questions concerning the normalcy of exercise responses in patients, and significantly impacts the clinical decision-making process.
Areas covered: The aim of this study was to provide an updated systematic review of the literature on reference values for CPET parameters in healthy subjects across the life span.
A systematic search in MEDLINE, Embase, and PEDro databases were performed for articles describing reference values for CPET published between March 2014 and February 2019.
Expert opinion: Compared to the review published in 2014, more data have been published in the last five years compared to the 35 years before. However, there is still a lot of progress to be made. Quality can be further improved by performing a power analysis, a good quality assurance of equipment and methodologies, and by validating the developed reference equation in an independent (sub)sample. Methodological quality of future studies can be further improved by measuring and reporting the level of physical activity, by reporting values for different racial groups within a cohort as well as by the exclusion of smokers in the sample studied. Normal reference ranges should be well defined in consensus statements.
1. Introduction
Cardiopulmonary exercise testing (CPET) is an important diagnostic tool for assessing aerobic fitness of individuals [Citation1]. Although many different exercise testing protocols are employed to estimate aerobic fitness [Citation2], the gold standard for objectively assessing aerobic fitness remains cardiopulmonary exercise testing (CPET) during which respiratory gas exchange, ventilatory, and heart rhythm measurements are continuously performed throughout an incremental exercise intensity until voluntary exhaustion [Citation3]. As such, CPET provides an evaluation of the integrative exercise response of the cardiovascular, respiratory, and metabolic systems to an incremental work rate [Citation4]. This relatively non-invasive, dynamic physiologic test permits the evaluation of resting, submaximal, and peak exercise responses, as well as recovery responses, providing the clinician relevant information for clinical decision-making [Citation4]. Examples concerning the usefulness of CPET for clinical decisions are the evaluation of exercise intolerance [Citation4], eligibility for organ transplantation, and preoperative risk stratification [Citation5].
Adequate reference values provide the comparative basis for answering important questions concerning the normality of exercise responses, and can significantly impact the clinical decision-making process [Citation6,Citation7]. As recommended by the American Thoracic Society/American College of Chest Physicians (ATS/ACCP) guideline, each exercise laboratory must select an appropriate set of reference values that best reflects the characteristics of the population tested, and the equipment, protocol, and methodology utilized to collect the reference values [Citation4]. Many reference values for different CPET parameters obtained in different populations are available in the literature. We have previously published a systematic review of reference values for CPET parameters published up to 2014 [Citation8]. The current article is an update of our previous publication, including recent papers, as well as an extension towards the pediatric population. Reference values for pediatric CPET published up to 2014 were previously reviewed by Blais et al. [Citation9]. The aim of this study was to provide an updated systematic review of the literature on reference values for CPET parameters in healthy subjects across the life span.
2. Methods
This systematic review of the literature followed the guidelines of the Preferred Reporting Items for Systematic Reviews and Meta-Analyses (PRISMA) statement [Citation10].
2.1. Data sources and search strategy
A search strategy was created and critically reviewed and approved by experienced exercise physiologists with the support of a medical librarian. After approval, published articles in the electronic databases MEDLINE, Embase, and PEDro were searched up to February 2019 (articles published from March 2014). We used the systematic search strategy as described in Appendix A. The search strategy did not have any limitations on ethnicity and language. Relevant reference lists were hand-searched as a method to supplement electronic searching.
2.2. Selection of studies
Results of the searches in different electronic databases were combined, where after duplicates were removed by two reviewers (CM and DP). The same two reviewers screened all unique records for potential relevance using the title, abstract or descriptors, or both. Hereafter, remaining articles were screened by the two reviewers on compliance with the eligibility criteria based on the full-text of the articles. Reasons for possible article exclusion based on its full-text were recorded.
2.3. Eligibility criteria
Studies with the objective to evaluate reference values for maximal CPET were included. Furthermore, inclusion criteria were: studies that included healthy subjects (no age restriction), studies using cycle or treadmill ergometry for CPET, cross-sectional studies or cohort studies, and studies that reported CPET parameters. Exclusion criteria were: studies published before March 2014, studies of which the full-text was not available, intervention studies, studies in which no maximal exercise protocol was used, and studies that exclusively included elite athletes.
2.4. Data extraction
All authors extracted data using a standard data extraction form. Data extraction was performed in pairs of reviewers (TT and MB, CM and DP, EH and WB), and discrepancies in extracted data were discussed with an independent reviewer (BB) till consensus was reached. If data were missing or further information was required, serious attempts were made to contact the corresponding authors to request for further information.
2.5. Methodological quality
Methodological quality of the selected studies was assessed using a quality list as provided in the ATS/ACCP guideline (see Appendix B) [Citation4]. This list is a combination of study requirements to obtain an optimal set of reference values as described in the ATS/ACCP guideline and the code number scheme of shortcomings and limitations. Each criterion was scored as ‘yes’, ‘no’, or ‘don’t know’, with one point for each ‘yes’. A study was considered to be of high quality when it scored ≥10 points (≥75% of the maximum score of 14), of moderate quality when it scored 7 to 9 points, and of low quality when it scored ≤6 points. Quality assessment of all studies was performed in pairs of reviewers as well, and discrepancies in the scoring of criterions were discussed till consensus was reached. There was no blinding on authors or journal.
3. Results
3.1. Selected studies
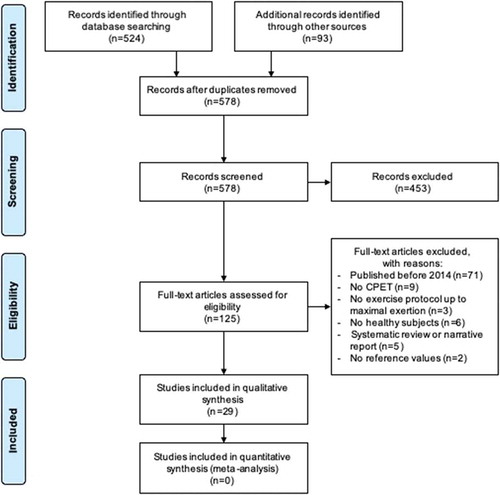
We identified 578 potential studies published between March 2014 and February 2019. After initial screening, 125 studies were regarded potentially eligible. After reading the full-text, 29 studies were considered eligible for inclusion. A flowchart displaying exact details of the selection process, including the reasons for exclusion, is presented in .
Figure 1. The PRISMA flow diagram displaying the selection of studies and reasons for exclusion.
3.2. Study characteristics
depicts the overall study characteristics. The 29 included studies assessed 87.256 subjects in total, of which were 54.214 males and 33.042 females. Age of included subjects ranged between 6 and 90 years. CPET was performed using a cycle ergometer in 14 studies (48.3%) and using a treadmill in 14 studies (48.3%), whereas one study (3.4%) used both modalities. There was a wide variety in the used CPET protocols, in which all studies used a continuous stepwise or ramp incremental protocol. Included studies included data from three different continents, of which most represented countries were European (n = 16), North-American (n = 9), and South-American (n = 5). Sample size ranged from 38 to 18.189 subjects. Sixteen studies (55.2%) were performed in adults, eight studies (27.6%) in children, and five studies (17.2%) in a combined sample. Some of the publications included CPET data from the same core database (e.g. FRIEND database, LowLands Fitness Registry).
Table 1. Overall study characteristics.
3.3. Methodological quality assessment
Quality of the included studies varied, and none of the studies fulfilled all 14 quality criteria. A ‘quality score’ ≥10 was seen in 4 studies, 15 studies received a score of 7 to 9, and 11 studies received a score of ≤6. Frequently observed weaknesses were a lack of power analysis, quality assurance of equipment and methodologies, and reference equation validation. provides a detailed overview of the methodological score of the included studies on the ATS/ACCP quality list [Citation4].
Table 2. Methodological quality of the included studies list based on the ATS/ACCP guidelineappendi.
3.4. Meta-analysis
Each of the included studies has various numbers of shortcomings and limitations, which are noted in . Meta-analysis of the data was not meaningful, as a large heterogeneity of methods and subjects (including sampling bias, uneven quality of primary data, and inadequate statistical treatment of the data) was observed.
3.5. Results of individual studies
shows reference values for cardiovascular, ventilatory, and ventilatory efficiency parameters. Studies differed in the way of reporting reference values. Studies that did report reference values using regression equations are included in . Several studies reported their reference values in tables. We refer to these specific tables of the respective study for further details.
Table 3. Reference values of the included studies for cardiovascular parameters, ventilatory parameters, and ventilatory efficiency parameters.
3.6. Cardiovascular parameters
3.6.1. Oxygen uptake at peak exercise
Twenty-six studies reported oxygen uptake at peak exercise (VO2peak) in L/min, mL/min, or in mL/kg/min [Citation11–Citation28], but not all studies provided reference values. Several different parameters were used to predict VO2peak. Body height, body mass, age, and sex were often included in prediction equations. VO2peak (absolute values) increased with body height and body mass, was lower in females, decreased with age during adulthood, but increased with age during childhood.
3.6.2. Ventilatory anaerobic threshold
Only one study in children reported ventilatory anaerobic threshold (VAT) values [Citation29], no study reported VAT values in adult subjects. Reference values for VAT (mL/min) increased with body height and body mass in children and were provided for male and female subjects separately.
3.6.3. Heart rate at peak exercise
One study in children [Citation29] and one study performed in adults [Citation30] provided prediction equations for heart rate at peak exercise (HRpeak). The pediatric study reported four different equations, two for males, and two for females. Body height, body mass, and age were predictors of HRpeak [Citation29]. Six prediction equations for HRpeak in adults were reported using both cross-sectional and longitudinal data. Males had a higher HRpeak during young adulthood compared to females; however, males showed a somewhat faster decline in HRpeak values with age compared to females [Citation30].
3.6.4. Oxygen pulse
One study [Citation29] performed in children provided four different equations for peak oxygen pulse (O2-pulse), two for males, and two for females. No study reported O2-pulse reference values in adults.
3.6.5. Blood pressure
One study [Citation31] performed in children provided two prediction equations for systolic blood pressure at peak exercise. Systolic blood pressure increased with attained work rate at peak exercise (WRpeak), and the increment in systolic blood pressure was independent of age and sex. There was no study that provided reference values in adults for systolic blood pressure at peak exercise.
3.6.6. Work rate at peak exercise
Two studies [Citation29,Citation32] reported equations for the attained WRpeak during CPET. These studies reported 18 different equations for the prediction of WRpeak. In adults, WRpeak increased with body height, body mass, and was significantly higher in male subjects. In children, WRpeak increased with the development of body height and body mass ().
3.7. Ventilatory parameters
3.7.1. Minute ventilation at peak exercise
Ten studies [Citation29,Citation33–Citation41] reported data for minute ventilation at peak exercise (VEpeak). Almost all studies reported VEpeak data using tabulated data. Two sex-specific prediction equations were provided for children [Citation29]. One prediction equation was provided for adults [Citation37], in which VEpeak values were lower in females and declined with age throughout adulthood.
3.7.2. Tidal volume at peak exercise
Four studies [Citation29,Citation35,Citation39,Citation41] reported reference values for tidal volume at peak exercise (TVpeak). Two studies were performed in children [Citation29,Citation35] and two in adults [Citation39,Citation41]. One study [Citation29], performed in children, provided a prediction equation for TV, the other studies provided tabulated data.
3.7.3. Breathing frequency at peak exercise
Two studies [Citation35,Citation41] reported breathing frequency at peak exercise (BFpeak). One study [Citation35] was performed in children and one in older adults (70–77 years of age) [Citation35]. Results were only provided in tabulated data.
3.7.4. Ventilatory efficiency parameters
3.7.4.1. Oxygen uptake efficiency plateau and oxygen uptake efficiency slope
One study [Citation34] in children reported a reference equation for oxygen uptake efficiency plateau (OUEP). No results in adults were found. Five studies reported oxygen uptake efficiency slope (OUES) values, two in adults [Citation42,Citation43], two in a pediatric population [Citation29,Citation34], and one study reporting up to young adulthood (21 years of age) [Citation44]. Results were reported for males and females separately. Other commonly used predictors were age, body height, body mass, or body surface area. OUES values were determined using data from 10% to 100% of the exercise test and normalized for body surface area or body mass.
3.7.5. Minute ventilation to carbon dioxide production
Minute ventilation (VE) to carbon dioxide production (VCO2) coupling was reported in eight studies, of which four studies were performed in children [Citation29,Citation35,Citation38,Citation45] and four studies in adults [Citation39–Citation41,Citation46]. VE to VCO2 coupling was expressed in many different ways: VE/VCO2-slope, VE/VCO2 ratio at the VAT, the lowest VE/VCO2 ratio during the test, or VE/VCO2 ratio at peak exercise (see ).
4. Discussion
The aim of our study was to review recently published studies in the last five years on reference values for CPET parameters in healthy children and adults. In this update of the literature, 29 studies with reference values for CPET parameters were included, in which data of 87.256 subjects (54.214 males and 33.042 females) were reported. This number is more than three times the number of subjects included in our original systematic review of the literature (25.826 subjects) [Citation8]. This increase in number shows that the sample size of the studies is increasing over time. For an adequate interpretation of CPET, the normal range of a variety of CPET parameters (e.g. VO2peak, VAT, HRpeak, VE/VCO2-slope) is essential. In many studies, however, only the mean or median value for the population is provided. We recommend that studies should also report the lower and upper limit of normal. As shown in the study of Blanchard et al. [Citation29], the use of the 80% of predicted as lower limit of normal should be abandoned. Instead, a Z-score should be used with a lower and upper limit of normal of −1.96 SD and +1.96 SD, respectively. Moreover, authors should try to statistically model their data instead of merely providing tabulated data. In addition, authors are encouraged to publish multiple different CPET parameters in one publication, such as, for example, in Bongers et al. [Citation47]. This will help clinicians to select the optimal set of reference values for their tests. The use of reference values from different sources to interpretation one CPET will provide additional noise in its interpretation.
4.1. Comparison with previous review
Compared to our original review, more data from South America are available. In the original protocol, one study in 120 adult subjects from Brazil was available. In the last five years, four new studies from Brazil and one from Argentina were added to the literature, including the study by Neto et al. [Citation48] among 18.189 healthy subjects between 13 and 69 years of age. These studies significantly added to the available reference values for CPET in this geographic region.
Cycle ergometry was still more commonly employed as CPET method compared to treadmill ergometry. The large variety in CPET protocols, equipment, study methodology, and parameters reported indicates the need for standardization of CPET as a clinical outcome tool. Without a robust standardization of the CPET methodology, data pooling and multi-center studies are very hard to perform.
5. Conclusion
In the last five years, 29 studies with CPET reference values of 87.256 subjects were published. We found no single set of ideal reference values, as characteristics of each population are too diverse to pool data in a single equation for each CPET parameter. Harmonization of CPET data is still urgently needed to facilitate pooling of data from different sources.
6. Expert opinion
Strength of this updated review is the inclusion of many studies from around the world with large databases. However, harmonization for CPET data is still urgently needed. Without harmonization, pooling of CPET data from different sources is hardly possible. This is well illustrated by the various parameters used for the coupling of VE and VCO2. Many different metrics such as the ratio of the two at the VAT, at peak, or the slope are used to describe this relationship. These different metrics give all different values and thus cannot be used interchangeably.
Another limitation identified in the current review is that only a limited amount of CPET parameters are reported in the literature. An international database like the FRIEND database [Citation49] with raw breath-by-breath data will help to report reference values for a large number of CPET parameters in a standardized manner. Using novel big data analytic methods, this database enables the continuous generation of up-to-date reference values.
The reporting of CPET reference values is still in its infancy. For instance, we recommend that in the future researchers are not only reporting the mean or median value of a population or tabulated data but obtained data should be modeled and reference ranges including upper and lower limits of normal should be provided.
Compared to the review published in 2014, more data have been published in the last five years compared to the 35 years before. However, there is still a lot of progress to be made. Quality can be further improved by performing a power analysis, a good quality assurance of equipment and methodologies, and by validating the developed reference equation in an independent (sub)sample. Methodological quality of future studies can be further improved by measuring and reporting the level of physical activity, by reporting values for different racial groups within a cohort as well as by the exclusion of smokers in the sample studied. Normal reference ranges should be well defined in consensus statements. For example, should we use the 5th to 95th percentile or the 2.5th to 97.5th percentile as normative range? Moreover, advanced data modeling techniques should be used. Tabulated data and simple linear regression techniques should be abandoned, since they have quite large prediction errors. For example, Z-scores will provide a more qualitative analysis of the performance of a CPET parameter instead of a binary normal/abnormal.
We expect that in the near future more CPET data harmonization initiatives are undertaken to establish robust reference values for CPET. Researchers, end-users, and industry should collaborate to establish a continuous development and update of adequate reference values using an open source database technology. This database should also include longitudinal data. Using big data techniques such as curve matching, a prediction for the future development of CPET outcomes in a subject can be made. Furthermore, we expect that open source platforms for the interpretation and reporting of CPET data are developed for the harmonization of interpretation and reporting of CPET results.
Article highlights
There is no single set of ideal reference values; population characteristics of each population are too diverse to pool data in a single equation.
Each exercise laboratory must select an appropriate set of reference values that best reflect the characteristics of the (patient) population tested, and equipment and methodology utilized.
Adequate reference values provide the comparative basis for answering important questions concerning the normalcy of exercise responses in patients, and can significantly impact the clinical decision-making process.
Researchers, end-users, and industry should collaborate to establish a continuous development and update of reference values for CPET parameters using an open source database technology. There is a growing number of geographic regions in which reference values are established: Europe, Japan, South America, and Scandinavia were most frequently studied regions. Data from other regions such as other Asian countries, Middle East, and Africa are needed.
Reference values for CPET parameters may change over time and should be regularly updated and/or validated.
Standardization of the methodology to generate reference values, reporting of CPET parameters, reporting on specific software and hardware settings of the equipment, and data harmonization are necessary to facilitate interpretation and to optimize the clinical applications of CPET.
Declaration of interest
The authors have no relevant affiliations or financial involvement with any organization or entity with a financial interest in or financial conflict with the subject matter or materials discussed in the manuscript. This includes employment, consultancies, honoraria, stock ownership or options, expert testimony, grants or patents received or pending, or royalties.
Reviewer Disclosures
Peer reviewers on this manuscript have no relevant financial or other relationships to disclose.
Additional information
Funding
References
- American Physical Therapy Association. Guide to Physical Therapist Practice. Second Edition. Phys Ther. 2001 Jan;81(1):9–746.
- Noonan V, Dean E. Submaximal exercise testing: clinical application and interpretation. Phys Ther. 2000 Aug;80(8):782–807.
- Mezzani A, Agostoni P, Cohen-Solal A, et al. Standards for the use of cardiopulmonary exercise testing for the functional evaluation of cardiac patients: a report from the exercise physiology section of the European association for cardiovascular prevention and rehabilitation. Eur J Cardiovasc Prev Rehabil. 2009 Jun;16(3):249–267.
- American Thoraxic Society, American College of Chest Physicians. ATS/ACCP statement on cardiopulmonary exercise testing. Am J Respir Crit Care Med. 2003 Jan 15;167(2):211–277.
- Levett DZH, Jack S, Swart M, et al. Perioperative cardiopulmonary exercise testing (CPET): consensus clinical guidelines on indications, organization, conduct, and physiological interpretation. Br J Anaesth. 2018 Mar;120(3):484–500.
- Van Brussel M, Bongers BC, Hulzebos EHJ, et al. A systematic Approach to interpreting the cardiopulmonary exercise test in pediatrics. Pediatr Exerc Sci. 2019;28:1–10.
- Wasserman K, Hansen JE, Sue DY, et al. Principles of exercise testing and interpretation. J Cardiopulm Rehabil Prev. 1987;7(4):189.
- Paap D, Takken T. Reference values for cardiopulmonary exercise testing in healthy adults: a systematic review. Expert Rev Cardiovasc Ther. 2014 Dec;12(12):1439–1453.
- Blais S, Berbari J, Counil FP, et al. A systematic review of reference values in pediatric cardiopulmonary exercise testing. Pediatr Cardiol. 2015 Dec;36(8):1553–1564.
- Moher D, Liberati A, Tetzlaff J, et al. Preferred reporting items for systematic reviews and meta-analyses: the PRISMA statement. Int J Surg. 2010;8(5):336–341.
- Inbar O, Oren A, Scheinowitz M, et al. Normal cardiopulmonary responses during incremental exercise in 20- to 70-yr-old men. Med Sci Sports Exerc. 1994 May;26(5):538–546.
- Storer TW, Davis JA, Caiozzo VJ. Accurate prediction of VO2max in cycle ergometry. Med Sci Sports Exerc. 1990;22(5):704–712.
- Koch B, Schaper C, Ittermann T, et al. Reference values for cardiopulmonary exercise testing in healthy volunteers: the SHIP study. Eur Respir J. 2009 Feb;33(2):389–397.
- Ong KC, Loo CM, Ong YY, et al. Predictive values for cardiopulmonary exercise testing in sedentary Chinese adults. Respirology. 2002;7(3):225–231.
- Akinola AB, Land JM, Mathias CJ, et al. Contribution of nitric oxide to exercise-induced hypotension in human sympathetic denervation. Clin Auton Res. 1999 Oct;9(5):263–269.
- Jones NL, Makrides L, Hitchcock C, et al. Normal standards for an incremental progressive cycle ergometer test. Am Rev Respir Dis. 1985 May;131(5):700–708.
- Edvardsen E, Scient C, Hansen BH, et al. Reference values for cardiorespiratory response and fitness on the treadmill in a 20- to 85-year-old population. Chest. 2013 Jul;144(1):241–248.
- Magrani P, Pompeu FA. [Equations for predicting aerobic power (VO(2)) of young Brazilian adults]. Arq Bras Cardiol. 2010 Jun;94(6):763–770.
- Singh R, Singh HJ, Sirisinghe RG. Cardiopulmonary fitness in a sample of Malaysian population. Jpn J Physiol. 1989;39(4):475–485.
- Blackie SP, Fairbarn MS, McElvaney GN, et al. Prediction of maximal oxygen uptake and power during cycle ergometry in subjects older than 55 years of age. Am Rev Respir Dis. 1989;139(6):1424–1429.
- Fairbarn MS, Blackie SP, McElvaney NG, et al. Prediction of heart rate and oxygen uptake during incremental and maximal exercise in healthy adults. Chest J. 1994;105(5):1365–1369.
- Nelson MD, Petersen SR, Dlin RA. Effects of age and counseling on the cardiorespiratory response to graded exercise. Med Sci Sports Exerc. 2010 Feb;42(2):255–264.
- Habedank D, Reindl I, Vietzke G, et al. Ventilatory efficiency and exercise tolerance in 101 healthy volunteers. Eur J Appl Physiol Occup Physiol. 1998 Apr;77(5):421–426.
- Hollenberg M, Ngo LH, Turner D, et al. Treadmill exercise testing in an epidemiologic study of elderly subjects. J Gerontol A Biol Sci Med Sci. 1998 Jul;53(4):B259–67.
- Itoh H, Ajisaka R, Koike A, et al. Heart rate and blood pressure response to ramp exercise and exercise capacity in relation to age, gender, and mode of exercise in a healthy population. J Cardiol. 2013 Jan;61(1):71–78.
- John N, Thangakunam B, Devasahayam AJ, et al. Maximal oxygen uptake is lower for a healthy Indian population compared to white populations. J Cardiopulm Rehabil Prev. 2011 Sep-Oct;31(5):322–327.
- Tammelin T, Nayha S, Rintamaki H. Cardiorespiratory fitness of males and females of northern Finland birth cohort of 1966 at age 31. Int J Sports Med. 2004 Oct;25(7):547–552.
- Mylius CF, Krijnen WP, van der Schans CP, et al. Peak oxygen uptake reference values for cycle ergometry for the healthy dutch population: data from the lowlands fitness registry. ERJ Open Res. 2019 Apr;5(2):00056–2018.
- Blanchard J, Blais S, Chetaille P, et al. New reference values for cardiopulmonary exercise testing in children. Med Sci Sports Exerc. 2018 Jun;50(6):1125–1133.
- Ozemek C, Whaley MH, Finch WH, et al. Maximal heart rate declines linearly with age independent of cardiorespiratory fitness levels. Eur J Sport Sci. 2017 Jun;17(5):563–570.
- Kaafarani M, Schroer C, Takken T. Reference values for blood pressure response to cycle ergometry in the first two decades of life: comparison with patients with a repaired coarctation of the aorta. Expert Rev Cardiovasc Ther. 2017 Dec;15(12):945–951.
- Van de Poppe DJ, Hulzebos E, Takken T, et al. Reference values for maximum work rate in apparently healthy dutch/flemish adults: data from the lowlands fitness registry. Acta Cardiol. 2018;22:1–8.
- Almeida AE, Stefani Cde M, Nascimento JA, et al. An equation for the prediction of oxygen consumption in a Brazilian population. Arq Bras Cardiol. 2014 Oct;103(4):299–307.
- Bongers BC, Hulzebos EH, Helbing WA, et al. Response profiles of oxygen uptake efficiency during exercise in healthy children. Eur J Prev Cardiol. 2016 May;23(8):865–873.
- Dilber D, Malcić I, Čaleta T, et al. Reference values for cardiopulmonary exercise testing in children and adolescents in nortwest Croatia. Paediatria Croat. 2015;59:195–201.
- Duff DK, De Souza AM, Human DG, et al. A novel treadmill protocol for exercise testing in children: the British Columbia children’s hospital protocol. BMJ Open Sport Exerc Med. 2017;3(1):e000197.
- Kaminsky LA, Harber MP, Imboden MT, et al. Peak ventilation reference standards from exercise testing: from the FRIEND registry. Med Sci Sports Exerc. 2018 Dec;50(12):2603–2608.
- Lintu N, Viitasalo A, Tompuri T, et al. Cardiorespiratory fitness, respiratory function and hemodynamic responses to maximal cycle ergometer exercise test in girls and boys aged 9-11 years: the PANIC study. Eur J Appl Physiol. 2015 Feb;115(2):235–243.
- Loe H, Steinshamn S, Wisloff U. Cardio-respiratory reference data in 4631 healthy men and women 20-90 years: the HUNT 3 fitness study. PloS One. 2014;9(11):e113884.
- Pistea C, Lonsdorfer E, Doutreleau S, et al. Maximal aerobic capacity in ageing subjects: actual measurements versus predicted values. ERJ Open Res. 2016 Jan;2(1).
- Stensvold D, Bucher Sandbakk S, Viken H, et al. Cardiorespiratory reference data in older adults: the generation 100 study. Med Sci Sports Exerc. 2017 Nov;49(11):2206–2215.
- Barron AJ, Dhutia NM, Glaser S, et al. Physiology of oxygen uptake kinetics: insights from incremental cardiopulmonary exercise testing in the Study of health in Pomerania. IJC Metab Endocr. 2015;7:3–9.
- Buys R, Coeckelberghs E, Vanhees L, et al. The oxygen uptake efficiency slope in 1411 Caucasian healthy men and women aged 20-60 years: reference values. Eur J Prev Cardiol. 2015 Mar;22(3):356–363.
- Hossri CA, Souza IPA, de Oliveira JS, et al. Assessment of oxygen-uptake efficiency slope in healthy children and children with heart disease: generation of appropriate reference values for the OUES variable. Eur J Prev Cardiol. 2019 Jan;26(2):177–184.
- Abella IT, Tocci AC, Iglesias DE, et al. Cardiopulmonary exercise testing in healthy children. Rev Argent Cardiol. 2016;84(5):412–417.
- Genberg M, Andren B, Lind L, et al. Commonly used reference values underestimate oxygen uptake in healthy, 50-year-old Swedish women. Clin Physiol Funct Imaging. 2018 Jan;38(1):25–33.
- Bongers BC, Hulzebos HJ, van Brussel M, et al. Pediatric norms for cardiopulmonary exercise testing. 2nd. ‘s Hertogenbosch, the Netherlands: Uitgeverij BOXPress; 2014.
- Rossi Neto JM, Tebexreni AS, Alves ANF, et al. Cardiorespiratory fitness data from 18,189 participants who underwent treadmill cardiopulmonary exercise testing in a Brazilian population. PloS One. 2019;14(1):e0209897.
- Kaminsky LA, Imboden MT, Arena R, et al. Reference standards for cardiorespiratory fitness measured with cardiopulmonary exercise testing using cycle ergometry: data from the Fitness Registry and the Importance of Exercise National Database (FRIEND) registry. Mayo Clin Proc. 2017 Feb;92(2):228–233.
Appendix A
Search strategy
MEDLINE: (((((((((exercise test[MeSH Terms]) OR exercise test[Title/Abstract]) OR ergometry test[Title/Abstract]) OR ergometry tests[Title/Abstract]) OR Treadmill test[Title/Abstract]) OR Treadmill tests[Title/Abstract]) OR bicycle test[Title/Abstract]) OR bicycle tests[Title/Abstract])) AND ((((((((((reference values[MeSH Terms]) OR reference values[Title/Abstract]) OR normal range[Title/Abstract]) OR normal ranges[Title/Abstract]) OR norms[Title/Abstract]) OR normative value[Title/Abstract]) OR normal value[Title/Abstract]) OR normal values[Title/Abstract]) OR reference ranges[Title/Abstract]) OR reference range[Title/Abstract]).
Embase: (‘exercise test’:ab,ti OR ‘ergometry’:ab,ti OR ‘exercise tests’:ab,ti OR ‘cardiopulmonary exercise test’:ab,ti OR ‘cardiopulmonary exercise tests’:ab,ti OR ‘cardiopulmonary exercise testing’:ab,ti OR ‘cycle ergometry’:ab,ti OR ‘incremental exercise’:ab,ti) AND (‘values, reference’:ab,ti OR ‘normal range’:ab,ti OR ‘normal ranges’:ab,ti OR ‘reference values’:ab,ti OR ‘reference ranges’:ab,ti OR ‘reference range’:ab,ti OR ‘normal responses’:ab,ti).
PEDro: ‘cardiopulmonary exercise test’ AND ‘reference values’.
Appendix B
Modified methodological quality list according to the ATS/ACCP guidelines
Population characteristics:
Subjects are community based. (The subjects studied preferably be community bases rather than hospital based).
Level of physical activity is reported.
Exclusion of different racial groups.
Exclusion of smokers in the sample studied.
No lack of definition of de confidence limits for individual or specified characteristics. (Include age, sex, and anthropomorphic considerations).
Sample size:
The number of subjects tested is sufficiently equal or larger than the appropriately powered sample size, with a uniform distribution of subjects for sex and groups. (Specific attention is given to include women and older individuals, given the changing demographics and paucity of reliable population-based CPET data for these groups).
Randomization:
Randomization was applied.(The study design includes a randomization process to avoid the potential bias seen when more physically active subjects volunteer for the study).
Design:
A prospective study design
Quality assurance of equipment and methodologies:
Quality control was applied.(Quality was achieved using recommendations contained in the ATS/ACCP guidelines and the CPET protocols in accordance with recommendations specified in the ATS/ACCP guidelines).
Exercise testing protocol and procedures are described.
Results are obtained by either breath-by-breath analysis or mixing chamber treated in accordance with recommendation contained in the ATS/ACCP guidelines.
Treatment of data:
CPET result in interval averaged, preferably every 30–60 s (to avoid the noise of shorter interval), and the peak value reported represents the mean of the last-completed stage or of all the data collected during the final stage, but preferably for no less than 30 s.
Validation:
Reference equations are validated in population other than those used to generate the existing data.
Statistical treatment of data:
(14)The function that most accurately describes the distribution of the data are used. For example, curvilinear (power) functions may more accurately describe the distribution of the data. Furthermore, the precision of the individual and population predicted values are reported.