
 ?Mathematical formulae have been encoded as MathML and are displayed in this HTML version using MathJax in order to improve their display. Uncheck the box to turn MathJax off. This feature requires Javascript. Click on a formula to zoom.
ABSTRACT
Carbon steel is a candidate disposal canister material for high-level radioactive waste and spent fuel in the Swiss deep geological repository concept and so a long-term laboratory-based corrosion experiment was undertaken to measure the anaerobic corrosion behaviour and corrosion rate of carbon steel in compacted bentonite under simulated anoxic repository conditions. The corrosion rate was measured using barometric gas cells over a period of more than 5 years, until quasi-steady-state conditions were reached. The measured corrosion rates are in agreement with weight loss measurements and with previous tests under similar conditions. The carbon steel and surrounding bentonite removed from one cell after 3 years were analysed with a range of analytical techniques, weight loss measurements and mineralogical characterisation. The results provide an insight into the prevailing corrosion mechanisms under repository conditions.
This paper is part of a supplement on the 6th International Workshop on Long-Term Prediction of Corrosion Damage in Nuclear Waste Systems.
Introduction
Nagra is considering using carbon steel as a potential canister material for the disposal of high-level waste (HLW) and spent fuel (SF) in a deep geological repository at a depth of 650–900 m in Opalinus Clay host rock. The repository will be based on a series of excavated tunnels within which disposal canisters containing SF assemblies or vitrified waste will be set on pedestals made from compressed bentonite blocks. After emplacement of the canisters, the tunnel will be backfilled with granular bentonite and sealed. After closure of the repository, ingress of porewater from the host rock will increase the relative humidity until the bentonite is fully saturated. In parallel, oxygen trapped in the bentonite pores and the excavation disturbed zone will be consumed by corrosion, microbial activity or other processes until anoxic conditions prevail [Citation1]. Saturated anoxic conditions are expected to be present for the vast majority of the lifetime of the disposal canisters. For safety assessment purposes, it is important to have information about the anaerobic corrosion rate of carbon steel and the corresponding rate of hydrogen production in representative conditions [Citation2]. The anaerobic corrosion of iron releases hydrogen by the following overall reaction:(1)
(1) or, if the Schikorr reaction occurs, by the reaction:
(2)
(2) The experimental programme involved setting up corrosion gas cells containing the representative corrosion systems. The programme was based on techniques used in previous experiments to investigate the anaerobic corrosion of steel in other waste disposal systems [Citation3–5]. The corrosion behaviour of carbon steel and its effect on the physico-chemical properties of the surrounding compacted bentonite have also been studied previously in the context of the Swedish radioactive waste management research programme [Citation6–9], the ‘NF-PRO’ EU-funded research programme [Citation10], and the Japanese radioactive waste management research programmes [Citation11,Citation12].
Experimental methods
Materials
The gas cell experiments were carried out using BS 4360 grade 43A (EN 10248-1) carbon steel wires (composition, wt-%: Mn 0.7; Si 0.22; C 0.21; P 0.017; S 0.017; Fe bal.). The nominal diameter of the wires used for the experiments was 0.4 mm, with an exposed surface area of ∼0.1 m2 in each cell. The experiments used Mischung E MX-80 bentonite clay. The Opalinus Clay porewater simulant was enriched in 18O, in the form of H218O, and 2H (i.e. D), in the form of D2O, and was prepared according to .
Table 1. Recipe and composition for Opalinus Clay porewater simulant.
The sample wires were cut into uniform 5 mm lengths using an automated wire-cutting machine. To minimise the amount of surface oxide present at the start of the experiments, and to create a consistent surface condition, the metal samples were briefly pickled in 10 vol.% hydrochloric acid before the start of the experiments in an argon-purged glove box. Following pickling, the wires were ultrasonically cleaned in fresh deionised water and then in methanol. In two of the tests, the wire samples were pickled in laboratory air and then pre-corroded, with the aim of introducing a layer of aerobically formed corrosion product on the surface of the wires before the start of the anaerobic corrosion experiments. The pre-corrosion procedure adopted was to immerse the chopped wire in actively aerated, de-ionised water for ∼4 days. This resulted in the formation of a uniform brown corrosion product layer which, from subsequent weight loss measurements, was estimated to be ∼1 µm thick.
The steel wires were mixed with dry MX-80 bentonite (dry density 1500 kg m−3) under a cover gas of nitrogen/5% hydrogen and then compacted into cylindrical pieces of bentonite (each containing ∼15 800 wire pieces) that were mounted in stainless steel holders. No water was added during compaction, and the initial water content in the bentonite was ∼6%. The bentonite volume (m3): steel surface area (m2) ratio was 3.203 × 10⁻⁴. The holders incorporated porous sintered metal filters that allowed artificial groundwater to enter the bentonite and gas to escape.
Gas cell set up
Five test cells were set up: two with pickled carbon steel wires, two with pre-corroded carbon steel wires and one blank with only bentonite present. All of the gas cell components except for the manometer tube were transferred to a glove box purged with Ar/0.63% CO2 gas mixture (residual O2 <5 ppm). The holders containing the compacted bentonite were inserted into each gas cell and then immersed in ∼50 mL of artificial isotopically labelled Opalinus Clay porewater. The reservoirs were filled with ∼250 mL di-n-butyl phthalate (DBP), a low volatility manometer fluid, and the glass joints were sealed with a two-part epoxy resin. After curing, the valves were closed, the assembly was removed from the glove box, and the manometer tube was fixed in place. The gas cell experiments were then placed in a silicone oil bath at a controlled temperature of 60°C and monitored. Gas production measurements were made at appropriate intervals to accommodate the expected high initial corrosion rate and the subsequent rate reduction. Any gas produced by the corrosion process causes a pressure increase, which reduces the level of DBP in the reservoir and increases the level in the manometer tube. By measuring the height of the liquid in the manometer tube and the volume of the DBP displaced by evolving gas, it is possible to calculate the volume of hydrogen produced by anaerobic corrosion. Over long time periods the detection limit of the technique is estimated to be ∼0.01 µm/year. The results shown are based on gas generation data that were corrected for the external atmospheric pressure and normalised to standard temperature and pressure (STP, i.e. 0°C and 1 atmosphere pressure).
In addition, gas cells containing steel in compacted bentonite that were set up for the NF-PRO programme [Citation10] were monitored and preliminary results are reported here for comparison.
Cell dismantling and analysis
Dismantling procedure
The operation of one cell containing pre-corroded wires (NAG02) was stopped after an exposure period of ∼29 500 hours (∼3.4 years), and the cell was transferred to an argon-purged glove box for dismantling and sample preparation. Stain marks on the side of the bentonite holder indicated that the holder was immersed to half depth when the experiment was stopped (it was fully immersed at the start of the test). A slow decrease in the water level was observed after the start of the experiment, and this may have been due to the slow resaturation of the bentonite. Some of the water would also have been consumed by corrosion. The wire samples that were analysed were taken from the top part of the cell, which was not fully immersed at the end of the test. A specially designed extrusion tool was used to push the cylinder of bentonite a small way out of the sample holder and material for examination was removed using a scalpel. The resulting material was fairly loose and friable, and the wires separated easily from the bentonite matrix. In addition, a piece of bentonite containing a mass of wires was mounted in epoxy resin and polished, in order to provide a cross section through the bentonite–steel composite sample.
Analysis of materials from corrosion experiment
Analysis of test solution
A sample of solution from around the test cell was analysed to check how the composition of the solution had changed since the experiment was set up and to determine whether any species had been released from the bentonite or the corroding steel into the aqueous phase. The solution was analysed using a combination of inductively coupled plasma-optical emission spectrometry (ICP-OES), to measure the concentration of dissolved metals, and ion chromatography to measure the concentration of dissolved anions. Colorimetric techniques were used to analyse the sulphide and ferrous ion concentrations.
Analysis of wires and bentonite
Microscopic examination of surface of wires
A number of wires were examined using an Alicona 3D Optical microscope and by scanning electron microscopy (SEM), before and after ultrasonically removing an adherent bentonite layer. Cross sections were examined using SEM and energy dispersive X-ray analysis (EDXA), using a JEOL 6480 LV SEM equipped with an Oxford Instruments X-MAX80 SD X-ray detector and INCA X-ray analysis system.
Raman spectroscopy and Fourier Transform Infrared spectroscopy
Raman spectroscopy and Fourier Transform Infrared spectroscopy (FTIR) were used to analyse the corrosion product. The Raman measurements were obtained using a Horiba JY LabRam Aramis confocal Raman microscope, with an exciting laser wavelength of 532 nm. A 50× extra-long working distance objective lens was used to collect the 180° backscattered light. The samples of corroded wires were analysed in argon-filled capillaries that were prepared inside the glove box. FTIR measurements were conducted using an Agilent Digilab Excalibur spectrometer fitted with a SpectraTech Goldengate ATR (attenuated total internal reflection) sampling attachment with a diamond window. The blank diamond window was used as the background material for comparison with the sample spectra.
Secondary ion mass spectrometry
Secondary ion mass spectrometry (SIMS) analysis was performed using a Cameca DSIMS 4f Instrument. Approximately 10 mm lengths of the two wire samples, designated A and B, were examined. A resin block containing wire cross sections mounted in resin and dry-polished was also examined. The wires were (i) depth profiled directly by ion beam milling and (ii) examined in cross section using SIMS imaging.
Mössbauer spectroscopy
The sample for Mössbauer analysis was prepared in an argon-filled glove box. A small sample of wires in bentonite from the corrosion experiment was ground gently until the bentonite and wires had separated, and the wires were removed using a magnet. The bentonite was then lightly ground to produce a fine powder. Thirty-one milligrams of the bentonite sample, which represented an average sample of the bentonite matrix near the steel wires, were mixed together with enough graphite powder to fill the ∼0.1 cm3 volume of an absorber disc sample holder and the lid of the holder was sealed into place using rapid-setting epoxy adhesive. 57Fe Mössbauer spectroscopy was conducted using a transmission, constant acceleration spectrometer, with a 57Co source in a rhodium matrix. A calibration experiment and the spectra for the bentonite sample were run for one day at a velocity range of ±12 mm s−1, using a natural α-Fe foil. All isomer shifts are quoted relative to α-Fe.
Weight loss measurements
In order to confirm the corrosion rate measurements derived from monitoring gas evolution, two weight loss measurements were carried out on some of the wires removed from the test cell. A piece of the wire-loaded cylinder of bentonite was removed, and the wire specimens were ultrasonically cleaned in methanol in an argon-filled glove box then left to dry naturally in the glove box. Two sample sets of 200 wire specimens in each set were used for the weight loss measurements. The length of each of the 400 wire specimens was measured using an optical microscope in order to calculate the initial surface area and the starting weight of the wires. Weight loss measurements were carried out in the glove box according to standard practice [Citation13], using Clarke’s solution (inhibited hydrochloric acid) as the descaling agent, and the weight loss was converted to a corrosion rate expressed as µm/year.
Profilometry of wire surfaces
A Nanofocus confocal optical profiler was used to measure the surface topography of the samples removed from the corrosion experiment, after descaling to reveal the bare metal surface, using reflected white light. For comparison with the corroded samples, profilometry was also conducted on ‘as received’, degreased carbon steel wires with the following surface conditions: (i) degreased only, (ii) pickled in 10% HCl in an ultrasonic bath for 10 min, and (iii) pre-corroded in aerated demineralised water for 4 days (i.e. the initial state of the wires in two of the corrosion experiments) then treated with Clarke’s solution.
Mineralogical and microchemical investigation of bentonite–steel interface
The complete bentonite cylinder was extruded from the steel holder in an argon-purged glove box and representative samples of the reacted bentonite were removed. No unreacted compacted MX-80 bentonite was available for comparison and so a ‘background’ reference sample of visually ‘unaltered’ compacted MX-80 containing no steel wire fragments was taken from another bentonite–steel interaction experiment containing bentonite with steel coupons [Citation14]. Petrographical and XRD analysis, using randomly oriented and oriented powder samples, focussed on characterising the interaction of bentonite with iron corrosion products immediately adjacent to the corroding steel wires. The methodology and approach used were similar to those used previously to study samples from other iron–bentonite interaction experiments [Citation15,Citation16].
Results
Corrosion rate measurements
The corrosion rate data for the four gas cells containing wires and the blank cell (assuming Fe3O4 as the corrosion product) are given in . The corrosion rate was ∼30 µm/year initially and then decreased to an average value of <1 µm/year after nearly 25 000 hours, after which the rate was still decreasing, albeit very slowly, up to the test duration of ∼57 000 hours (∼6.5 years) when the corrosion rates were ∼0.5 µm/year. summarises the overall corrosion data from the four wire cells and gives the average corrosion rate over the whole duration and over the last three readings from the barometric cells, after the cells had reached a quasi-steady-state condition. From the weight loss measurements, the average corrosion rate over the whole exposure period, including the corrosion during the pre-corrosion stage, was ∼3.5 µm/year.
Figure 1. Results of anaerobic corrosion experiments on carbon steel (BS 4360 grade 43A) in compacted bentonite in 2H and 18O enriched artificial porewater at a pH of 7.2 and 60°C: corrosion rate assuming magnetite formation.
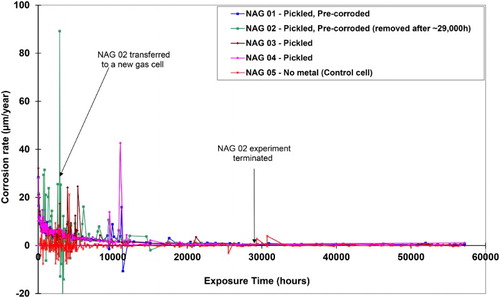
Table 2. Summary of corrosion rates from anaerobic corrosion experiments, assuming the formation of magnetite.
Owing to the erratic rate of gas production in cell NAG02, it was decided to place the sample into a new cell after 1948 hours’ exposure. However, the noisy behaviour continued, suggesting that the cause of this phenomenon was related to the properties of the wire/bentonite system rather than the cell design. This view is supported by the fact that all of the other cells subsequently exhibited the same noisy behaviour at some stage. The peaks in gas generation appear to correspond to the times when the cell fluid reservoirs were at their lowest point, and hence the total system pressure was at a minimum, and this may correspond to the time when there was a release of gas from the bentonite. The fluid reservoirs had to be refilled periodically after a period of gas generation, and it appears that the bentonite may release some gas when the pressure was at its lowest.
Solution analysis
The results of the analysis of a sample of solution taken from the test cell when the cell was terminated are given in . There was an increase in the concentration of calcium, potassium, sodium, chloride, and sulphate ions in solution, whereas the magnesium ion concentration remained constant. This indicates that various species were leached out of the bentonite during the corrosion experiment, particularly the exchangeable interlayer cationic species calcium and sodium, and other species that can be present in bentonite, such as sulphate [Citation17]. Two figures are given for the iron concentration in solution, corresponding to (i) soluble only and (ii) soluble plus insoluble iron.
Table 3. Results of analysis of solution surrounding the compacted bentonite holder after dismantling.
Analysis of steel wires from corrosion experiment
Scanning electron microscopy and energy dispersive X-ray analysis
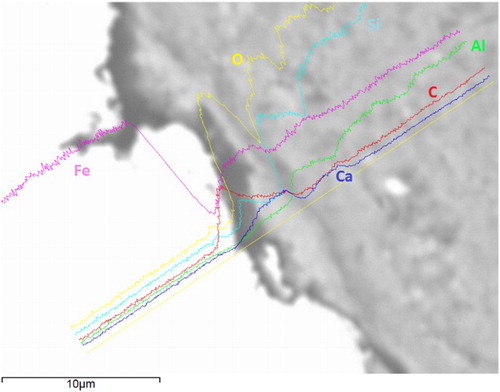
Scanning electron micrographs of the surfaces of wires ‘as received’ and removed from the corrosion experiments after ultrasonically removing the adherent bentonite and stripping the corrosion product from the surface in Clarke’s solution show that roughening of the majority of the metal surface had developed (). Samples of wires embedded in bentonite were mounted and polished and examined by SEM and EDXA (). There is some complex structure to the interface, as shown by the fluctuations in the relative elemental concentrations, with a predominantly iron–oxygen rich phase, which was ∼5 µm thick. The elemental profiles across the interface show that there was an increase in the iron concentration in the bentonite near the interface, but the iron concentration decreased gradually into the bentonite matrix over a distance of at least 10–15 µm. The presence of carbon at the cracks and interfaces is attributed to the epoxy resin in which the samples were potted and which would have penetrated into any voids (e.g. those formed due to shrinkage during drying).
Figure 2. SEM images of the surface of ‘as received’ wires (left) and of wires after removal from the corrosion experiment and stripping the oxide from the surface using Clarke’s solution (right).
Figure 3. High magnification SEM image and EDX elemental line scan across the wire–bentonite interface.
Raman spectroscopy and FTIR analysis
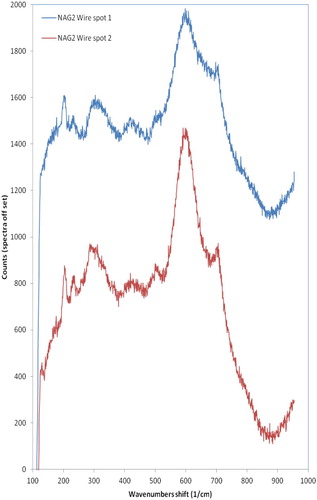
The Raman spectra for a corroded wire sample are shown in . The main peak in the spectra for the wire sample is centred at ∼600 cm−1, with an obvious shoulder at ∼700 cm−1, and this is attributed to a magnetite type corrosion product, although there is a shift in the position of this peak compared to standard magnetite, which may indicate that the actual corrosion product is sub-stoichiometric [Citation18]. The small shoulder at ∼700 cm−1 is in the region of one of the peaks attributed to haematite. The presence of some haematite is not unexpected because the wires were pre-corroded in aerated conditions. There are also several sharp bands at lower wavenumbers that may be attributable to an oxyhydroxide phase.
Figure 4. In situ Raman spectra from wire samples.
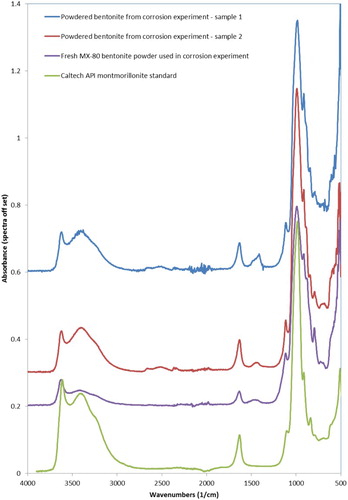
The FTIR spectra obtained from the powdered bentonite sample from the corrosion experiment and a reference spectrum of montmorillonite standard are shown in . There are additional peaks at ∼1410–1480 cm−1 in the sample spectra that are not present in the standard spectrum for montmorillonite but which may be attributable to the presence of carbonate [Citation19]. A further FTIR spectrum is shown for the fresh MX-80 bentonite powder used for the corrosion experiments in . This spectrum shows that the additional peaks at ∼1410–1480 cm−1 were also present in the fresh bentonite powder.
Figure 5. FTIR spectra from bentonite samples, fresh MX-80 bentonite powder and reference sample (Caltech API Clay mineral standards spectra).
Secondary ion mass spectrometry
Examination of the DSIMS (dynamic SIMS) depth profiles shown in and shows the following main features and differences:
For sample A ((a)), the upper ∼1–2 µm of the wire surface was dominated by relatively intense oxygen-related signals (16O, 18O, FeO), H, and Cl. Beyond this depth range, the oxide-related species decreased gradually while the Fe signal increased to a maximum level at ∼4–6 µm, indicating the interface with the metal substrate. The profiles for O-related species are typical of a rough sample surface, which produces diffuse profile shapes with no clear indication of the oxide–metal interface.
For sample B ((b)), the oxide-related species were again relatively high in the near-surface region. However, there is a possibly significant difference in the shape of the profiles for 16O, 18O, and FeO over the depth range ∼1–12 µm, compared to sample A. For Sample B, there was a rapid decrease in oxide-related signals at ∼1–2 µm, followed by a more gradual decrease to the interface with metal at ∼12–14 µm depth.
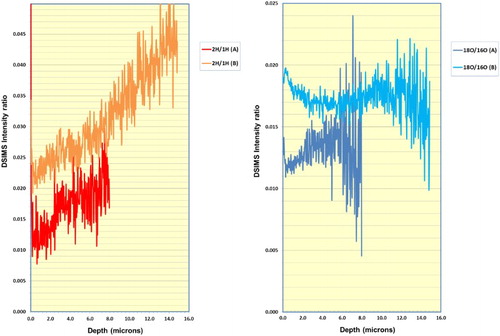
The comparison plot of 2H/1H DSIMS intensity ratio ((a)) shows a fairly continuous increase in this ratio, from the oxide surface through to the metal interface and towards the centre of the wire, for both wire samples.
Comparison of 18O/16O intensity ratios ((b)) shows a similar trend in both samples, namely slightly higher values at the oxide surface and the oxide–metal interface regions, with slightly lower values within the oxide layer.
Figure 6. SIMS profiles for (a) wire A and (b) wire B.
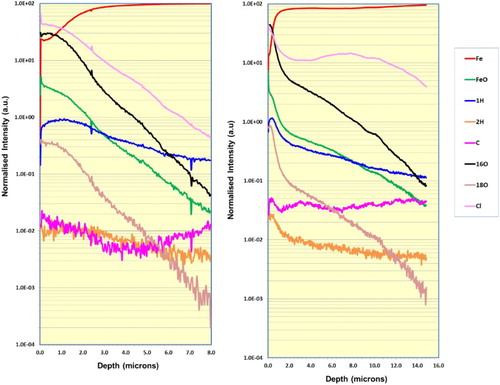
Figure 7. Comparison of SIMS ratio in wires A and B for (a) 2H/1H and (b) 18O/16O.
Comparison of the DSIMS analysis of the cross-sectioned samples showed the following:
1H, 16O, and 18O signals are clearly detected in all imaged areas, but 2H has too low an intensity under the high spatial resolution conditions used in this study.
The overview images clearly show the complete wire section for each sample with some evidence for sample B having a significantly rougher outer surface than sample A.
The average oxide layer thicknesses appear to be ∼6 µm for sample A and ∼12 µm for sample B, in reasonably close agreement to the observations from DSIMS depth profiling and the SEM examination.
The relative distributions of 16O and 18O appear to be visually similar across the oxide layer thickness in both samples.
Mössbauer spectroscopy
The spectrum obtained from the Mössbauer spectroscopy measurements is shown in . The spectrum was fitted using three doublets, and the parameters for these doublets are presented in . By comparison with the literature, the Mössbauer parameters for doublets 1 and 3 are indicative of the two octahedral iron Fe3+ sites. These sites could be Fe3+ substituted in the clay lattice in similar octahedral locations. The parameters may indicate γ-FeOOH(x) and γ-FeOOH(y), lepidocrocite, which is paramagnetic at 300 K [Citation20]. The parameters for β-FeOOH, akaganeite, are very similar to those of γ-FeOOH at room temperature [Citation20]. Komadel et al. [Citation21] used Mössbauer spectroscopy to identify iron phases in bentonite. They found that the hyperfine parameters of the Mössbauer spectra for the raw bentonite are consistent with structural Fe(III) in an aluminosilicate phase mixed with haematite, goethite, and maghemite. The bentonite samples they examined showed no presence of Fe(II) species.
Figure 8. Mössbauer spectrum of wire and surrounding bentonite at room temperature.
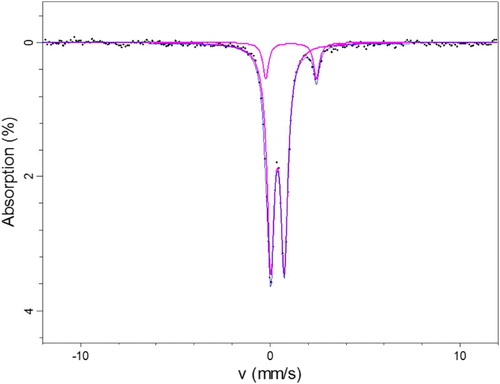
Table 4. Mössbauer parameters of NAG02 bentonite sample at 293 K.
The Fe2+ doublet in has parameters close to those of iron hydroxide Fe(OH)2 which is paramagnetic at 300 K. Mössbauer parameters are affected by factors that include composition, particle size, and temperature.
Profilometry of wire surfaces
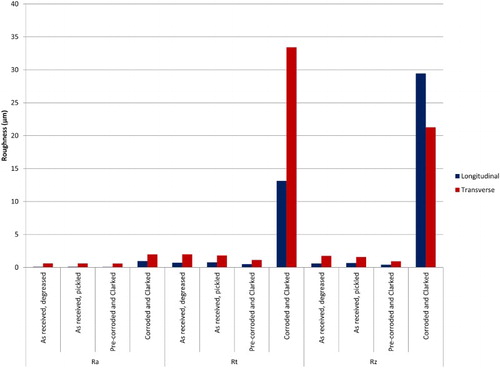
The following parameters [Citation22] were measured by profilometry analysis: Ra, average roughness, Rz, mean roughness depth, Rt, maximum height; some of the results for longitudinal and transverse measurements are summarised in . Overall, the profilometry data suggest that no significant roughening occurred during the pre-corrosion stage, but that some roughening or broad localised corrosion occurred during the corrosion experiments. Pits ∼10 µm deep and ∼20–40 µm across were observed on wires removed from the corrosion experiment and treated with Clarke’s solution to remove the surface corrosion product.
Figure 9. Summary of roughness values from profilometry measurements of steel wires for different surface conditions: longitudinal and transverse measurements. Ra: average roughness; Rz: mean roughness depth; Rt: maximum height.
Petrographic and mineralogical analysis of bentonite–wire composite samples
Bentonite alteration
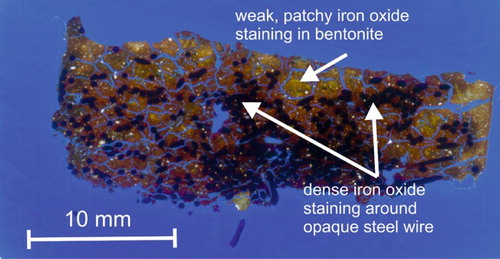
The reacted bentonite was heavily stained with a strong reddish-brown to ochreous colour, associated with the corrosion of the steel wires. In thin section, staining was seen to be particularly intense and dense immediately adjacent to layers or concentrations of steel wires (). However, the bentonite matrix itself tended to display very patchy staining with occasional domains of unstained greenish-yellow translucent bentonite with disseminated secondary iron oxide penetrating particularly along a network of microfractures that permeated the bentonite.
Figure 10. Transmitted light laser-scanned image of polished thin section through the compacted bentonite–steel wire composite.
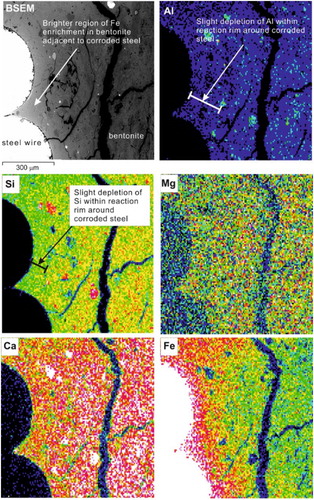
In general, no discrete new mineral alteration products of the bentonite were observed. However, BSEM-EDX () showed that within the zone of heavily ‘iron-stained’ bentonite the clay matrix displayed markedly higher electron backscattering and enrichment in iron close to the wires. This is associated with a concomitant slight decrease in the concentration of Ca, Al, and Si, which reflects the dilution of these elements through the addition of significant Fe. On the other hand, Mg shows no detectable change in concentration within the bentonite in agreement with the chemical analysis of the solution. BSEM images indicated that the clay particles themselves were enriched in Fe.
Figure 11. BSEM image and corresponding EDX element distribution maps for Al, Si, Mg, Ca, and Fe.
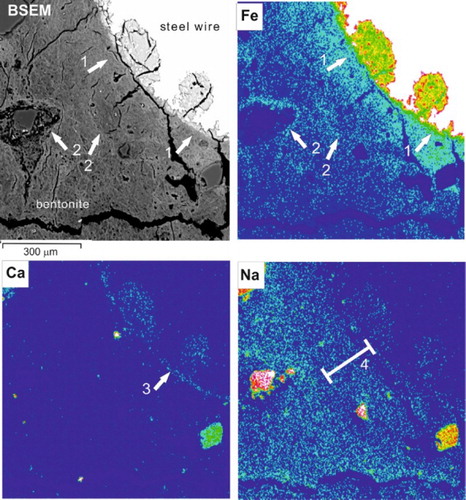
The enrichment of Fe in the bentonite matrix () extended for up to 300 µm away from the surface of the steel wires. In some cases, a marked concentration of Ca was observed within a very narrow region around the corroding wire 1–30 µm wide along the corroded steel–bentonite interface. Ca is also enriched in the iron oxide corrosion products filling corrosion pits in the surface of the wires. In contrast to Ca, element distribution maps for Na in the same areas indicate a slight depletion of Na. However, the Na depletion zone is much wider and less well defined than the very narrow zone of Ca enrichment.
Figure 12. BSEM image and corresponding EDXA element distribution maps for Fe, Ca, and Na. The bentonite is seen to be markedly enriched in Fe close to the corroding steel wire (1) and along discontinuities around the grain boundaries of original bentonite aggregate particles (2). Ca is concentrated within a very narrow zone located at the bentonite–steel oxide interface (3), and within corrosion products filling pits in the steel wire. The concentration of Na is generally depleted in a narrow zone around the corroding steel wire (4).
EDX analysis element mapping () indicates that the walls of many of the dilatant microfractures and the fine, apparently sealed, discontinuities display enrichment of Fe in the clay matrix of their walls. Although the apertures of these microfractures are probably significantly enhanced by shrinkage of the bentonite during sample handling and thin section preparation, the observed Fe enrichment implies that many of these microfractures developed during the course of the experiment. In much of the bentonite, iron staining and Fe-enrichment were seen to delineate the boundaries of what is probably the original bentonite aggregate particles, indicating that these particle boundaries also may have provided preferential pathways for the migration and/or diffusion of Fe released from the steel.
X-ray diffraction analysis
The results of XRD analyses are summarised in (random mounts) and (oriented mounts). Random orientation powder XRD analyses of ‘altered’ bentonite indicate that it has a generally similar mineralogy to the ‘unaltered’ bentonite. However, broad peak features, centred to the high angle-side of the smectite d001 at perhaps ∼10.5 Å, and also at ∼5.7 Å, were detected for the ‘altered’ material close to the wires but not in the ‘unaltered’ material. It is very difficult to attribute such broad features to any particular species but a reasonable match was obtained with palygorskite, an Mg/Al-rich phyllosilicate. A mean d060 dimension of 1.495 Å (range of values 1.495–1.497 Å) for the ‘altered’ bentonite subsamples indicates that the smectite-group mineral is dioctahedral and most likely to be a montmorillonite species. The montmorillonite in the wire-altered bentonite subsamples consistently displays a d001 peak at ∼12.7 Å.
Table 5. Summary of random orientation mount XRD analyses.
Table 6. Summary of oriented mount XRD analyses.
Oriented mount XRD analyses confirm that the clay mineral assemblages of the corroded wire-altered bentonite are dominated by montmorillonite. The air-dry d001 spacings for the ‘altered’ bentonite samples range from 12.36 to 12.76 Å, but the alteration immediately surrounding the wires also presents a peak at 10.55 Å. This 10.55 Å spacing, together with further subordinate spacings, may represent the presence of palygorskite, though due to the very broad nature of these peaks, their behaviour upon glycol-solvation is difficult to assess although it appears to collapse on heating to 550°C.
d002/d003 values for the ‘altered’ bentonite subsamples produce values of 0.71 and 0.74. These measured values together with Newmod II-modelling suggest that although the ‘altered’ bentonite subsample still has a montmorillonite senso stricto composition (0.42–0.46 Fe3+ per [O20(OH)4] formula unit), it is more Fe-rich than the smectite in the ‘unaltered’ bentonite. Peak width measurements coupled with Newmod II-modelling for the ‘altered’ sample distant from the wire suggest a similar mean defect-free distance of 9 layers (12.5 Å units) and a size range between 1 and 14 layers to the ‘unaltered’ material. However, the ‘altered’ sample surrounding the wire shows much broader peaks, indicative of a smaller defect-free distance and a size range.
Discussion
Corrosion rates and mechanisms
The values of corrosion rates from the weight loss measurements are in good agreement with the average corrosion rate measured in the gas generation experiments. Based on gas generation, the average corrosion rate after an experimental duration of 3.35 years was 2.1 µm/year, assuming Fe3O4 as the final corrosion product. Based on weight loss, the average corrosion rate after the same duration was ∼3.5 µm/year. However, the value from weight loss includes a contribution from the initial pre-corrosion stage, so the difference between the gas generation results and the weight loss results is probably due to the pre-corrosion stage. These corrosion rates are in general agreement with those measured in a parallel in situ experiment [Citation14], as well as those reported in the literature for similar exposure environments and durations [Citation23].
It should be noted that these values correspond to an average corrosion rate for the whole mass of wires in the experiment, although microscopic examination has shown significant differences occurring between individual wires. The rates are also based on the nominal surface area, based on the stated dimensions of the wires and they do not allow for surface area variations caused by surface roughness or defects, such as drawing marks. As a result, the real corrosion rate is probably lower.
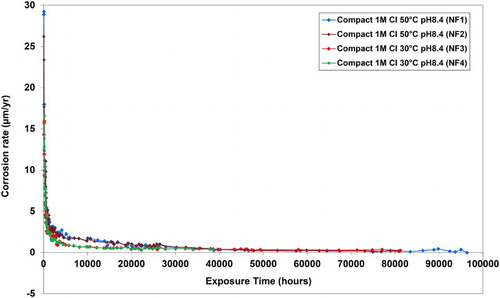
The corrosion rates of carbon steel obtained in the current experiments for carbon steel in compacted bentonite can be compared with data reported in a similar previous study [Citation6–9]. Monitoring of experiments set up in the ‘NF-PRO’ programme [Citation10] has continued, and the results for barometric gas cells in which carbon steel mounted in compacted bentonite was exposed to 1 M chloride solution at 30 and 50°C at pH 8.4 are summarised in . The initial anaerobic corrosion rates of carbon steel measured in the current experiments were very similar to the corrosion rates obtained previously under slightly different environmental conditions surrounding the same type of compacted bentonite, but with a different density (saturated bulk density 2000 kg m−3).
Figure 13. Anaerobic corrosion experiments for carbon steel (BS 4360 grade 43A) in compacted bentonite: continued data from experiments conducted in the ‘NF-PRO’ project.
No significant differences in corrosion rate between the pre-corroded samples and the freshly pickled samples were observed. This could be due to the fact that the oxide layer formed on the pre-corroded samples was quite thin and not thick enough to provide a protective layer.
The observation of an increase in the 18O/16O ratio at the metal–oxide interface and oxide–solution interfaces in the SIMS analysis is consistent with an oxide growth mechanism in which oxide formation occurs principally at the metal surface but with additional exchange processes occurring at the oxide surface. The extent of the difference in 18O/16O ratio between interfaces and bulk oxide is possibly affected by the roughness of the substrate.
Morphology of corroded carbon steel surface
The microscopic and profilometry analyses demonstrated that surface damage of the carbon steel had developed due to corrosion in the bentonite over a period of 3.35 years, resulting in the development of pock marks and surface roughening (see ). This depth of attack and the thickness of the corrosion product layer (∼5–12 µm) agree well with the corrosion rates derived from the weight loss measurements and the gas generation measurements. It should be noted that differences in the extent of corrosion were noted between different wires ranging from a shiny uncorroded surface to a significantly corroded surface, and this would explain the range of corrosion product thicknesses observed.
The SEM examination () and profilometry data () showed a large increase in surface roughness as a result of the corrosion experiment compared to the original ‘as received’ surface condition. This increase in roughness cannot be accounted for by the pre-corrosion stage or subsequent treatments to remove the corrosion product layer for analysis. The exact cause of this localised corrosion is not clear at present, but one possibility is that there could have been anodic and cathodic areas set up, so water reduction occurred predominantly at one location and anodic dissolution occurred in other areas.
Composition and morphology of corrosion product
Spectroscopic analysis (i.e. Raman analysis and FTIR) indicates that the corrosion product was predominantly sub-stoichiometric magnetite, with the possible presence of a carbonate species and other iron oxyhydroxides. This identification agrees with the mineral phase attributed to octahedral crystals observed in the petrographical analysis. Mössbauer spectroscopy indicated the presence of ferrous and ferric ions in the bentonite surrounding the corroding wires.
The oxide thickness was found to be ∼5 µm, but it appears to vary between different areas. The oxide thicknesses are too thin to account for all the corrosion that occurred; for example at a corrosion rate of 2 µm/year, for 3.35 years, and assuming that the oxide formed was magnetite, with a Pilling–Bedworth ratio of 2.7, the expected oxide thickness would be ∼18 µm. It is assumed that the difference between the predicted and actual oxide thickness is due to a proportion of the iron released by corrosion entering the surrounding bentonite matrix, as shown by the EDX profiles for iron and the chemical analysis of the solution.
Gas transport in bentonite
As can be seen from , the noise levels on the data reduced with time. The corrosion rate reduced to around 0.5 µm/year and this rate was still decreasing, albeit very slowly. The reduction in the noise levels may be due to the fact that the lower corrosion rate, and hence the lower gas production rate, results in a longer time required for gas pressure to build up before it reaches a sufficiently high pressure to be released through the bentonite. In addition, the longer time duration between release events would also allow more gas to diffuse through the bentonite and away from the metal–bentonite interface. There is also the possibility that iron enrichment in the walls of the gas channels, as observed in the SEM/EDXA examination of cross sections through the metal–bentonite interface, may have changed the physical properties of the bentonite so that the gas pathways remained open more easily and therefore there were fewer rapid release events leading to noise in the results.
Harrington and HorsemanCitation24 carried out experimental studies on the transport of gas through bentonite by injecting gas into a saturated compacted bentonite matrix. It was concluded that the gas transport through the bentonite showed intermittent flows. These experiments were interpreted by a rise in gas pressure associated with the formation of micro-fissures in the bentonite, when the local gas pressure (e.g. created by anaerobic corrosion) exceeded the opposing pressure created by swelling of the bentonite and the hydrostatic head. The formation of a gas pathway is followed by a release of gas, then a decrease in gas pressure and a collapse of the gas pathway. Gas transport is postulated to have occurred through a network of pressure-induced pathways, with no accompanying water transport or desaturation of the bentonite. When the pressure is released, the pathways in the bentonite can ‘close and self-heal’. The results obtained during the anaerobic corrosion experiments reported here appear to be consistent with this type of behaviour. The proposed mechanism may explain the apparent ‘noise’ in the gas generation data, in which gas generated by corrosion led to local pressure increases followed by pressure decreases as the gas broke through the bentonite matrix.
Effect of corrosion on bentonite
The increase in sodium, calcium, and potassium ion concentrations in solution (by a factor of ∼2.4–2.9) is consistent with displacement of these ions from the bentonite by the production of ferrous ions released by corrosion of the steel wire. There was no significant change in the magnesium concentration, indicating that it was not involved in equilibration, dissolution or exchange with the bentonite. There was also an increase in the concentration of chloride (by a factor of ∼2) and sulphate (by a factor of ∼11). A possible explanation for this change is the dissolution of halite (NaCl) and gypsum (CaSO4·2H2O) impurities, respectively, in the bentonite.
XRD analysis in this study reveals that the ‘unaltered’, grey bentonite has a similar composition to that previously described for MX-80.Citation25 The ‘altered’, pervasively stained bentonite in contact with the corroded steel wires and coupons has a generally similar mineralogy to the ‘unaltered’ bentonite. The montmorillonite in the wire-altered bentonite subsamples may have undergone replacement of some of the monovalent (Na/K) interlayer cations with larger divalent cations. As the experiment involves corrosion of steel wires, these divalent cations may be Fe. A subsample taken from the surface of the corroding wires possibly also suggests that the montmorillonite in close proximity to the corroding wires has also undergone divalent ion (possibly Fe) exchange with the originally monovalent interlayer cations.
Oriented mineral mount XRD analyses indicated a change in cation chemistry and most likely in the exchangeable cation sites. The 14.67 Å spacing may be the result of cation exchange with Ca from gypsum (identified by random powder XRD analysis) during the water-based preparation of the oriented mounts. As discussed previously, the 10.55 Å and other subordinate spacings may represent the formation of palygorskite during alteration.
The d002/d003 value for the montmorillonite in the ‘unaltered’ bentonite (0.61) compares to values of 0.71 and 0.74 obtained for the ‘altered’ bentonite subsamples. Such an increase, again measured under constant humidity conditions, may suggest an increase in the total number of electrons in the octahedral sheet of the ‘altered’ bentonite, possibly as a result of Fe substitution. This might indicate partial alteration and conversion of dioctahedral montmorillonite to an iron-rich dioctahedral smectite such as nontronite. A similar effect would also be expected if Fe2+ or Fe3+ from the corroding steel had displaced interlayer cations in the smectite, and this had subsequently converted to form a Fe-rich octahedral layer. This would have the overall effect of increasing the apparent Fe-substitution within the octahedral layer of the bulk of the smectite and might provide an alternative explanation for the increase in d002/d003 values for the montmorillonite component in the ‘altered’ bentonite.
In general, no discrete new mineral alteration products of the bentonite were observed. The most obvious visual alteration feature in the bentonite was the red-brown discoloration of the bentonite matrix around the corroding steel wires. This was most intensely developed within a narrow zone extending up to 300 µm into the bentonite from the surface of the steel. The bentonite was enriched in Fe within this region around the wires. However, there was little evidence of discrete secondary iron oxide formation within the bentonite matrix. Instead, BSEM imagery suggests that the clay (smectite) particles may themselves have been enriched in Fe.
Within this ‘iron-stained’ region, the bentonite was observed to suffer some alteration of the physical fabric, with the development of fine radial tensional microfractures formed around the corroding steel wires. These fractures are open with apertures ranging from <1 up to 2 µm. Some of this microfracturing was induced or enhanced by shrinkage of the bentonite during sample drying and section preparation, but many of the fractures were lined or partially filled by iron oxides or display Fe enrichment of the adjacent matrix, which implies that they developed during the course of the experiment. These microfractures appear to have provided pathways for Fe from the corroding steel to migrate into the adjacent bentonite. The corrosion and oxidation of steel consumes water, and this process will have utilised water within the pores in the bentonite. This will potentially have partially dehydrated the bentonite, leading to shrinkage and microfracturing around the corroding steel. The dehydration and microfracturing could also be due to the fact that the bentonite analysed was sampled from the part of the cylinder that was not immersed in solution at the end of the experiment. It is also possible that the channels observed were due to the passage of gas that was generated on the surface of the steel during the corrosion process.
A marked concentration of Ca was sometimes observed in a very narrow band around the corroding wires, and Ca is also enriched in the ultrafine iron oxide corrosion products filling corrosion pits in the surface of the wires. Although no discrete Ca phase was observed, the observations closely resemble those found previously in experiments from the EU NF-PRO programme [Citation15,Citation16]. These earlier experiments indicated that subordinate Ca2+ in the exchangeable cation sites of smectite in the MX-80 bentonite migrate towards the corroding steel surface leading to the precipitation of calcite and aragonite adjacent to the corroding metal surface. It seems likely that the concentration of Ca observed around the corroding wires in the present experiment represents the early stages of a similar process.
Conclusions
A set of laboratory corrosion experiments was conducted to measure the anaerobic corrosion rate of carbon steel in compacted bentonite under conditions that simulate the environmental conditions expected in a deep geological repository according to the Swiss disposal concept. Dismantling and characterising the surface of the metallic samples and the steel–bentonite interface provided an insight into the prevailing corrosion mechanisms under relevant repository conditions. The main conclusions from the experiments and the post-test analysis are as follows:
Corrosion rate decreased during the experiment, reaching about 0.5 µm/year after 5 years. Good agreement was obtained between carbon steel corrosion rates derived from weight loss measurements and gas generation measurements.
Corrosion resulted in localised surface roughening of the carbon steel embedded in compacted bentonite. Other possible causes of the corrosion, such as pre-corrosion and Clarke’s treatment to remove the post-test corrosion product, were considered and eliminated as possible causes of the observed roughening.
The corrosion product on the surface of the carbon steel was predominantly sub-stoichiometric magnetite with the possible presence of a carbonate species and oxyhydroxides.
A zone of altered, red-stained bentonite, containing ferrous ions, developed around the corroding wires. A network of microfractures was observed within this zone. Some of this microfracturing displayed Fe enrichment, which implies that they developed during the course of the experiment. Much of the iron staining and Fe-enrichment delineated the original boundaries of the bentonite aggregate pathways, which suggests that these particle boundaries provided preferential pathways for pore fluid migration through the bentonite.
Enrichment of iron in the bentonite was observed over a distance of ∼150–300 µm from the surface of the wires, while the smectite particles may themselves have been enriched in Fe.
No discrete new mineral alteration products of the bentonite were observed. Ca and Na showed a slight decrease but in some cases a marked concentration of Ca was observed within a very narrow region along the corroded steel–bentonite interface.
The replacement of some of the monovalent (Na/K) interlayer cations with larger divalent cations, such as Fe released during the corrosion process, occurred in the montmorillonite.
Acknowledgements
The authors gratefully acknowledge the following: Oxford University Materials Characterisation Service (UK) for providing analytical data; Drs A. E. Milodowski and S. J. Kemp (BGS, UK) for the mineralogical analysis of the bentonite; RWI, Institute of Geological Sciences, University of Bern (Switzerland) for preparation of the Opalinus Clay porewater simulant; Dr S. Forder (Sheffield Hallam University, UK) for Mössbauer spectroscopy measurements); Clay Technology (Sweden) for preparation of compacted bentonite samples; and SKB (Sweden) for partially funding the operation of the NF-PRO gas cells.
Disclosure statement
No potential conflict of interest was reported by the author(s).
ORCID
A. P. Rance http://orcid.org/0000-0002-5946-4024
D. J. Nixon http://orcid.org/0000-0002-7269-4019
References
- Diomidis N, Johnson LH. Materials options and corrosion-related considerations in the design of spent fuel and high-level waste disposal canisters for a deep geological repository in opalinus clay. JOM. 2014;66(3):461–470. doi: 10.1007/s11837-014-0876-4
- Diomidis N, Cloet V, Leupin OX, et al. Production, consumption and transport of gases in deep geological repositories according to the Swiss disposal concept. Wettingen, Switzerland: Nagra; 2016. (Report NTB 16-03).
- Smart NR, Blackwood DJ, Werme L. Anaerobic corrosion of carbon steel and cast iron in artificial groundwaters: part 1—electrochemical aspects. Corrosion. 2002;58(7):547–559. doi: 10.5006/1.3277646
- Smart NR, Blackwood DJ, Werme L. Anaerobic corrosion of carbon steel and cast iron in artificial groundwaters: part 2—Gas generation. Corrosion. 2002;58(8):627–637. doi: 10.5006/1.3287691
- Smart NR, Fennell PAH, Peat R, et al. Electrochemical measurements during the anaerobic corrosion of steel. Mater Res Soc Symp Proc. 2001;663:487–495. doi: 10.1557/PROC-663-487
- Smart NR, Rance AP, Werme LO. Anaerobic corrosion of steel in bentonite. Mater Res Soc Symp Proc. 2004;807:441–446. doi: 10.1557/PROC-807-441
- Smart NR, Rance AP, Carlson L, et al. Further studies of the anaerobic corrosion of steel in bentonite. Mater Res Soc Symp Proc. 2006;932:813–820. doi: 10.1557/PROC-932-32.1
- Carlson L, Karnland O, Oversby VM, et al. Experimental studies of the interactions between anaerobically corroding iron and bentonite. Phys Chem Earth. 2007;32(1-7):334–345. doi: 10.1016/j.pce.2005.12.009
- Carlson L, Karnland O, Olsson S, et al. Experimental studies on the interactions between anaerobically corroding iron and bentonite. Stockholm: SKB; 2008. (Report R-08-28).
- Understanding and physical and numerical modelling of the key processes in the near field and their coupling for different host rocks and repository strategies (NF-PRO). Brussels: European Commission; 2008. (Report EUR 23730).
- Xia X, Idemitsu K, Arima T, et al. Corrosion of carbon steel in compacted bentonite and its effect on neptunium diffusion under reducing condition. Appl Clay Sci. 2005;28:89–100. doi: 10.1016/j.clay.2004.01.002
- Ishidera T, Xia X, Idemitsu K, et al. Corrosion products from carbon steel formed in compacted bentonite under reducing conditions. J Nucl Sci Technol. 2008;45(8):763–772. doi: 10.1080/18811248.2008.9711477
- Standard Practice for Preparing, Cleaning, and Evaluating Corrosion Test Specimens. G1, ASTM, Philadelphia, PA, USA, 2011.
- Smart NR, Reddy B, Rance AP, et al. The anaerobic corrosion of carbon steel in compacted bentonite saturated with natural Opalinus Clay porewater containing native microbial populations. Corros Eng Sci Technol., 2017.
- Milodowski AE, Cave MR, Kemp SJ, et al. Mineralogical investigations of the interaction between iron corrosion products and bentonite from the NF-PRO experiments (Phase 1). Stockholm: SKB; 2009. (Report TR-09-02).
- Milodowski AE, Cave MR, Kemp SJ, et al. Mineralogical investigations of the interaction between iron corrosion products and bentonite from the NF-PRO Experiments (Phase 2). Stockholm: SKB; 2009. (Report TR-09-03).
- Carlson L. Bentonite mineralogy, parts 1 and 2. Olkiluoto: Posiva; 2004. (Posiva Working Report 2004-02).
- Graves PR, Johnston C, Campaniello JJ. Raman scattering in spinel structure ferrites. Mater Res Bull. 1988;23:1651–1660. doi: 10.1016/0025-5408(88)90255-3
- Wijnja H, Schulthess CP. ATR–FTIR and DRIFT spectroscopy of carbonate species at the aged γ-Al2O3/water interface. Spectrochim Acta Mol Biomol Spectrosc. 1999;55:861–872. doi: 10.1016/S1386-1425(98)00236-4
- Oh SJ, Cook DC, Townsend HE. Characterization of iron oxides commonly formed as corrosion products on steel. Hyperfine Interact. 1998;112:59–66. doi: 10.1023/A:1011076308501
- Komadel P, Anastacio AS, Andrejkovicova S, et al. Iron phases identified in bentonite from the lieskovec deposit (Slovakia) by variable-temperature mössbauer spectroscopy. Clay Miner. 2008;43:1–9. doi: 10.1180/claymin.2008.043.1.08
- Surface texture (Surface roughness, waviness, and lay). B46.1-2009, ASME International, USA, 2010.
- King F. Corrosion of carbon steel under anaerobic conditions in a repository for SF and HLW in Opalinus Clay. Wettingen: Nagra; 2008. (Nagra Technical Report 08-12).
- Harrington JF, Horseman ST. Gas migration in KBS-3 buffer bentonite. Sensitivity of test parameters to experimental boundary conditions. Stockholm: Svensk Kärnbränslehantering AB; 2003. (Report TR-03-02).
- Madsen FT. Clay mineralogical investigations related to nuclear waste disposal. Clay Miner. 1998;33: 109–129. doi: 10.1180/000985598545318