
 ?Mathematical formulae have been encoded as MathML and are displayed in this HTML version using MathJax in order to improve their display. Uncheck the box to turn MathJax off. This feature requires Javascript. Click on a formula to zoom.
ABSTRACT
The Volta potential is an electron-sensitive parameter and describes the thermodynamic propensity of a metal to take part in electrochemical reactions. It has found widespread acceptance among corrosion researchers due to its connection to the corrosion potential and its easy measurability in local scale, being often used to study localised corrosion phenomena and micro-galvanic activities. The principle object of this paper is to provide a comprehensive, fundamental insight into the meaning of the Volta potential and to define a polarity convention of measured potentials by the scanning Kelvin probe force microscopy (SKPFM) in order to assess local nobilities in microstructures. Conditions to relate the Volta potential with the mixed-potential theory are discussed and a possible connection to corrosion phenomena explained. The limitations of the Volta potential as well as the SKPFM technique are also aimed to be explained, with some practical information to maximise the output of high quality data.
Introduction
The Volta potential has been proven as a useful quantity to assess the (relative) nobility of local microstructures of an alloy regarding to improve the understanding of localised corrosion and galvanic activities in micrometre yet down to nanometre scale [Citation1–12]. The Volta potential is a material-specific property and describes the driving force of a metal for chemical and/or electrochemical reaction [Citation13–15]. The Volta potential can sense electrons, which can be involved in electrochemical reactions, and hence can indicate fingerprints in corrosion. However, the measured Volta potential is not a stable or constant parameter and is highly sensitive to the environment and the surface condition of the tested material [Citation16–23].
The absolute majority of all works published so far has considered the Volta potential as a relative quantity only, which is to report the measured Volta potential against a noble metal, often platinum (probe), and to disregard its magnitude in absolute scale (the map obtained is usually flattened). The Volta potential variation of a selected area is shown in a map in which sites of higher and lower potentials are compared with each other, without the consideration of the quantity in absolute scale. Hence, the Volta potential difference (i.e. value), often with respect to platinum, has been reported only without cross-comparative analyses between different materials. This is because the Volta potential is an extremely surface- and environment-sensitive parameter which can severely differ as a function of relative humidity, temperature, sample preparation, and scanning parameters [Citation1,Citation3,Citation24–26]. In addition, the instrument and/or the operator may impose artefacts to the measured quantity and reduce and yet falsify the data quality obtained by SKPFM. A thorough understanding of both the operation of the AFM and the fundamental meaning of the Volta potential with its relevance to corrosion is, therefore, required for a correct interpretation.
The Volta potential has often been reported in measurements performed in air and its magnitude depends on the Work function of the metal, its surface conditions, and several environmental parameters. There is no standard practice yet available for performing SKPFM measurements (although it is time to standardise Volta potential measurements), and the most publications do not provide all testing parameters which makes it difficult to compare between available data. Furthermore, data interpretation regarding to the (relative or practical) nobilities of the local microstructure, based on measurement parameters provided, remained as not straightforward. It is often not clear how the anodic or cathodic nature of measured regions in alloy microstructures was derived, due to real differences in electrode potential or made by empiricism. Often for aluminium alloys, large intermetallics have mostly been reported as cathodic due to pre-existing corrosion data, and the obtained maps were mathematically inverted to show the noble intermetallics as cathodic (‘high values’) while showing less noble regions or phases as anodic (‘lower values’) [Citation27,Citation28], claiming the necessity of a polarity inversion of SKPFM data due to a nulling method used in the measurement [Citation26,Citation29].
In most publications, instrumental parameters, such as the magnitude and polarity of the applied bias as well as humidity and time elapsed between sample preparation and the actual measurement time, have often been omitted to be reported which actually have key importance for data interpretation. The magnitude of the bias determines the sensitivity as well as the interaction area/volume of the surface, which in turn determines the information area/volume ('probe size'). The potential maps were often seen to have been manipulated by flattening, which is a filtering procedure that modifies the data to delete low frequency noises and centres and/or removes tilt from the maps. Flattening obscures the (bad) quality of the sample preparation and/or operational flaws. In this paper, it will be shown that it is more appropriate to report the Volta potential maps in absolute magnitudes (either relative to the tip or akin to the Work function concept) in order to allow cross-comparison. It will be further shown that the surface condition can highly influence the Volta potential and may lead to inversed nobilities within the microstructure and yet relative to the reference tip. It will be highlighted that there is a need to report the experimental parameters used for data acquisition in order to allow cross-comparison. Fundamental aspects of the Volta potential and influencing parameters will be thoroughly discussed. Moreover, a polarity concept of Volta potentials measured by SKPFM will be introduced to determine the nobility of the measured feature of interest (e.g. intermetallic). The polarity concept will be further discussed to better understand localised corrosion phenomena. The Volta potential will be brought into context with the mixed-potential theory to describe real corrosion phenomena.
The relevance of the Volta potential in corrosion science
If two dissimilar metals are brought into contact, their Fermi levels equilibrate and electrons drift from the metal with higher EF to the one with lower EF, thereby, leading to a measurable Work function difference () (). The Work function difference also establishes a Volta potential difference between the two metals (
), which is measured by the Kelvin probe technique.
Figure 1. Principle of the Volta potential difference (=contact potential difference, VCPD) measured by SKPFM: (a) two dissimilar metals with different Work functions (Φ) are brought into contact, (b) both Fermi levels (EF) equilibrate and electrons drift from the metal with lower Work function (ΦSample) to the metal with higher Work function (ΦProbe), (c) a voltage of the same magnitude as VCPD is applied to lift up the Fermi and vacuum levels (EVac) to their original positions.
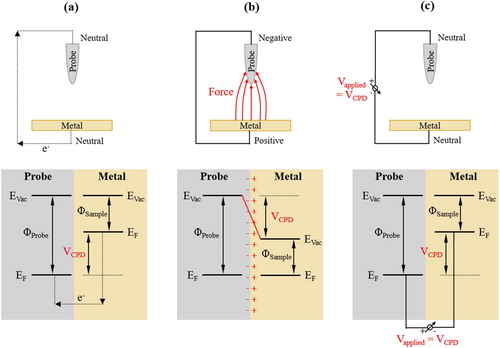
High and
indicate a high electrochemical nobility and, hence, can be considered as a reliable quantity reflecting the corrosion propensity of metals. The decrease of the Work function or Volta potential (energy) can be considered as an increased tendency for electron transfer and, hence, an enhanced propensity to undergo electrochemical reactions. The Volta potential of a metal has been demonstrated to linearly vary with the Work function of the metal, if the metal is a reversible electrode [Citation30]. Stratmann et al. used the scanning Kelvin probe (SKP) technique to measure the Volta potential difference between iron (sample) and gold (probe) in atmospheric environment, in which the surface of the iron was deposited with monolayers of water. With a rigorous calibration routine, the corrosion potential was seen to correlate with the Volta potential of iron [Citation31–33]. This achievement was ground-breaking since the SKP technique allowed the production of 2D and 3D Volta potential maps which could be used as ‘corrosion tendency maps’ to locate regions in the material as preferentially corrosion-active [Citation34].
Later, Frankel et al. used the Kelvin probe technique in an AFM, known as the SKPFM technique, with the difference, however, that the Volta potential was measured in ambient environment upon immersion of various metals in electrolyte followed by drying in air [Citation26]. Nevertheless, a similar correlation of the Volta potential with the corrosion potential was also confirmed despite of the ‘missing’ electrolyte on the metal surface [Citation26]. This work was also pioneering in corrosion science since SKPFM has been able to show anodic and cathodic regions in the microstructure with nanometre spatial resolution, a significant achievement to better understand micro-galvanic corrosion in aluminium alloys and other materials [Citation26–29,Citation35].
Rohwerder and Turcu, however, demonstrated later that the linear relationship of Volta potentials measured in air with the corrosion potential (Ecorr) may not hold true as a generic rule since the Ecorr of Fe as a function of pH did not follow the linear trend as contrasted to Nb [Citation1]. Hence, the Volta potential of Fe upon immersion in electrolyte with varying pH did not correlate with the respective Ecorr. The reason for this was argued with the changing ratio of ferric/ferrous ions in the oxide film, which determine the Work function of Fe oxide, hence, the Volta potential [Citation1]. The change of the Work function has been demonstrated to occur for ideally polarisable electrodes only [Citation30]. Reversible electrodes, in contrast, were shown not to vary with the Work function [Citation30]. Iron in electrolyte with varying pH is polarisable and Faradaic processes will change the surface structure of the electrode. Therefore, it has importance to assess the nature of the electrode prior to conducting SKPFM measurements.
Definition of potentials
The nature of the surface of a metal is both structurally and electronically different to that of its bulk interior. The surface is where electrochemical reactions take place and its nature determines the extent and kind of reaction. In order to understand and to describe reactions occurring on a metal surface (electrode) some definitions are needed to clarify the physico-chemical and electrochemical phenomena. Electrochemical reactions are of both electrostatic and chemical nature and are often associated with various physico-chemical interactions.
The electrostatic nature of a metal surface
The separation of charge causes a build-up of a potential difference, which is electrostatic, and there is likewise a chemical potential difference between two points of different metallic species. Work is needed to be done to move a unit of charge from one point in a medium to another and, so far, there is no way to differentiate the chemical work from the electrostatic one. The electrostatic potential decays by 1/x with the distance from the charge source, with all potentials defined in vacuum. There is a Coulombic interaction (repulsion) between charges of the same polarity, decaying by 1/x² with distance. Due to this interaction, energy is needed to bring a charge of the same polarity from infinity to ‘just about the surface’, which is usually ∼10 nm above the surface, where the charge does not feel image forces [Citation14,Citation15,Citation36,Citation37]. The latter describes the nature of the work needed in which chemical interactions do not prevail and is defined as the outer potential or more commonly known as the Volta potential [Citation14,Citation15,Citation36,Citation37].
More work is required to move the charge further towards or through the ‘surface’. This is the region where short-range forces prevail and where the charge gets induced and chemical variations occur [Citation36,Citation37]. The surface of an electrically conducting phase, in general, is composed of an electrical double layer. Metals form usually a negative ‘layer’ or ‘cloud’ of electrons above the surface, whereas the positive counter layer is formed directly underneath [Citation14,Citation15,Citation38,Citation39]. This is different to the electrochemical double-layer concept, where the metal is usually negatively charged and the electrolyte above is positively charged [Citation14,Citation15,Citation38,Citation39]. The change in charge distribution due to the interaction with the electrolyte leads to a change of the Volta potential, which explains why the corrosion potential (depending on both the electrode and electrolyte) does not always correlate with the Volta potential [Citation1]. The sum of charge of the entire metal surface is zero but there is still work needed to move charge from the bulk interior through the surface layer, and vice versa. The change of the electrostatic potential associated with this bipolar surface layer is hearkened back to the so-called Surface potential [Citation14,Citation15,Citation36,Citation37].
The Volta potential () and the Surface potential (
) form the so-called inner potential, also known as the Galvani potential (ϕ) (see [Citation37,Citation40]), and it describes the full electrostatic nature of a metal [Citation14,Citation15,Citation37,Citation40].
(1)
(1)
Figure 2. Schematic illustration of the Galvani (φ), Surface (χ), and Volta potentials (ψ) of a metal (simplified).
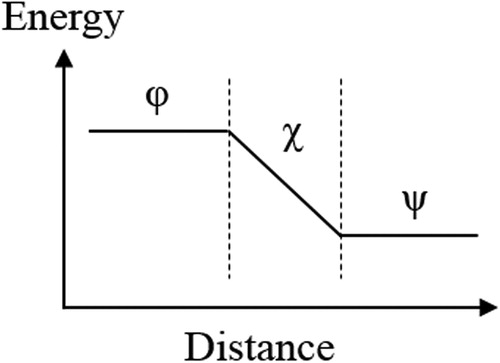
The Volta potential is determined by the surface charge and χ. Hence, the electrostatic properties of a metal can be fully described by ,
and ϕ, all schematically illustrated in . The Volta potential, in reality, decays with 1/x, and has a linear-like regime at distances ‘far away’ from the surface. This will be explained later on.
The Surface potential is a key parameter influencing the Volta potential of a metal and, hence, the electron affinity [Citation36,Citation40]. Some publications misused the potential measured by SKP/SKPFM and called it Surface potential and further misstated that Surface and Volta potentials are the same. This is due to the definitions of physicists who defined the contact potential difference as the Surface potential and named the dipole contribution to the electrode potential as the dipole potential. In fact, the contact potential difference and the Volta potential difference are the same, and the latter, however, is largely unknown to physicists and finds itself only in electrochemistry nomenclature. The confusion is there that there is no common terminology as pointed out by Erich Lange in 1950 [Citation40]. The potential energy of the electron increases with the further decrease of its distance to the surface due to acting image forces, which is described by the Surface potential. The Surface potential reflects the dipole nature of the metal surface and any adhering species. In reality, the Surface potential is more complex than illustrated in . Its energy has, strictly speaking, not a linear relationship with distance, and the Surface potential is not necessarily associated with a drop in potential across the bulk-vacuum interface. Likewise, the Volta potential does not linearly decay with distance, but it varies hyperbolically (this will be shown later). is a simplistic illustration, needed, however, for further communication. The Volta potential has been defined under vacuum (‘clean’) conditions, but measurements in air are also possible, which involve some changes occurring on the surface due to chemisorption or physisorption of species to be considered.
The electrochemical nature of the surface
Charge transport from infinity to the bulk metal, or vice versa, is associated with electrostatic and chemical interactions. Chemical work cannot be differentiated from electrostatic work, but the result of chemical interactions can be traced back to the chemical potential energy (). The chemical potential energy of an electron is the Fermi level (EF), which is the statistical value of the average energy of the electrons [Citation14,Citation15]. The electrochemical potential energy
) of an electron, describing the sum of the energy, composed of electric and chemical work, needed to transfer an electron from one phase to another is defined as:
(2)
(2) where
is the valence and
the Faraday’s constant [Citation36]. The Volta potential and the electrochemical potential are measurable quantities and both form a further measurable parameter, the Work function (
), as given in the following relationship [Citation24,Citation36]:
(3)
(3)
Based on previous equations, the relationship of with
and
is as follows:
(4)
(4)
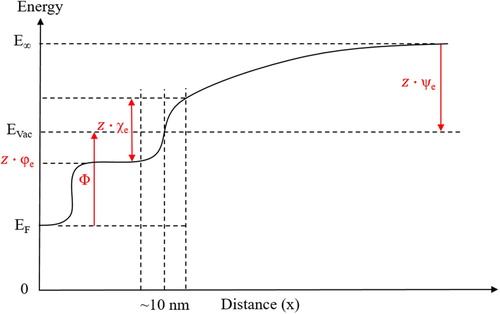
The Work function is defined as the energy needed to bring an electron from the Fermi level to the vacuum level (EVac) at a distance where the electron does not feel image forces (∼10 nm above the surface) [Citation14–16,Citation24,Citation37,Citation41–44]. The Volta potential energy, in contrast, is defined as the energy needed to bring an electron (or charge) from infinity to EVac [Citation14,Citation15,Citation24,Citation37]. The relationship between the Work function and the Volta potential energy as well as the Galvani and Surface potential energies is schematically illustrated in .
Figure 3. Relationship between the Volta potential energy (ψe), Surface potential energy (χe), Galvani potential energy (φe), and the Work function (Φ) (simplified). The Volta, Surface, and Galvani potentials are multiplied by charge (z) to satisfy Equations (3) and (4), and are therefore denoted as potential energies.
The discussion so far does not involve any effect of the electrolyte. For a metal in an electrolyte, the situation is more complicated. The electrochemical potential of an electrode in an electrolyte depends on the structure of the electrochemical double layer at the electrode/electrolyte interface and the electrochemical reaction(s) taking place on the electrode surface. According to Trasatti’s notation, the electrochemical electrode potential includes the Volta potential and the Volta potential difference at the electrode/electrolyte interface so that the interfacial parameters also have an influence on the electrode potential [Citation45]. A similar concept was seen also in earlier communication by Rüetschi and Delahay [Citation30]. Moreover, the corrosion potential of a metal in an electrolyte is a mixed potential reached at the open-circuit condition, which depends on the coupled anodic and cathodic reactions (mixed-potential theory), and also on other parameters such as the surface film formed as well as the Ohmic resistance of the electrolyte. These factors should be kept in mind when correlating the measured Volta potential with the corrosion potential [Citation46].
The Volta potential is of electrostatic nature and does not consider chemical interactions. Both electrostatic and chemical parts describe the fully electrochemical nature as a whole, which is part of the corrosion potential. The Volta potential misses the chemical part, given by the electrolyte, and therefore a generic correlation of the corrosion potential with the Volta potential is not possible, if the measurements are conducted in ‘dry’ air. The corrosion potential depends both on the metal and on the environment, i.e. the metal/electrolyte interface. A metal may be active in a certain condition but can become passive in another. The corrosion potential of a metal in an electrolyte reflects the real electrochemical nobility, whereas the Volta potential shows the strength of electrostatic fields generated between two dissimilar metals and, hence, indicates the tendency of a metal to take part in any chemical and/or electrochemical reaction.
Parameters that may influence the Work function and Volta potential
Adhering species on the surface of metals can alter the electronic structure and, hence, the nobility of a metal surface. It has been reported, for example, that self-assembled monolayers of molecules oriented with the negative pole upward from the surface (electronegative) increased the Work function of the metal, whereas positively oriented molecules (electropositive) decreased it [Citation47]. The changes in Work function have been stated to correlate with the dipole moment values of free molecules [Citation47]. The Surface potential has been further shown to correlate with the dipole moment on an example of two isomers of carboranethiol isomers [Citation47]. The electronic structure, the geometry, i.e. the symmetrical robustness of adhering species, have been stated to determine the dipole moment and hence the contribution to the Surface potential [Citation47]. Hence, the nature, strength, and orientation of the dipole have large influence on the Surface potential and can alter the nobility of a metal surface [Citation14,Citation48].
The effect of electronegative and electropositive species on the Work function is schematically illustrated in [Citation47]. The negative end of the dipoles of adhering species (chemi- or physisorbed) is oriented towards the outermost surface, which results in an increase of the Surface potential [Citation14,Citation48]. The bulk, however, is not affected and, therefore, there is no positional change of the Fermi level [Citation48]. The position of the Fermi level is associated with chemical changes of the bulk material only [Citation14,Citation15,Citation48]. An increase of the Surface potential results in an increase of Work function () and, hence, in an increased Volta potential (
) or Volta potential energy (
), all reflecting the (electrochemical) nobility of a metal (). Surface oxides can largely increase the Work function and Volta potential, and it has been reported that the chemisorbed/adsorbed oxides and water on Al resulted in a negative surface charge increasing its Work function by 0.5 eV [Citation49]. This change was attributed to the change of the Surface potential (
) resulting in an increase of the Volta potential [Citation49]. Likewise, a thermally grown oxide layer on stainless steel has also been shown to increase the Volta potential [Citation50].
Figure 4. The relationship between Volta potential energy (ψe), Surface potential energy (χe), Galvani potential energy (φe), Fermi level (EF), Vacuum level (EVac), and Work function (Φ) of a solid metal. The chemical composition (alloying) and adhering surface species (e.g. oxide/hydroxide) can alter both the surface nature and nobility of the metal. The ‘surface’ is defined as the region where the Surface potential prevails, limited by the outermost surface and subsurface. The subsurface is the region below the surface where the Surface potential contribution to the potential change across the surface vanishes and where the Galvani regime prevails. The Volta, Surface, and Galvani potentials are multiplied by charge (z) to satisfy Equations (3) and (4), and are therefore denoted as potential energies.
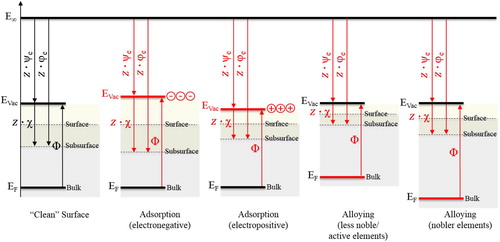
Chemical alterations of the metal, such as by alloying or de-alloying of noble or less noble (active) elements, can alter the nature and nobility of the surface of a metal. Alloying of Al in Mg and Ni in Fe, for example, decreases the Fermi level and thus increases their Work functions and Volta potentials (). Likewise, Mg in Al or Fe in Ni increases their Fermi levels and, hence, decrease their Work functions. Mechanical deformation, temperature, and defects in the surface can further alter the nature of the surface and complicate data interpretation of measured Volta potentials [Citation36,Citation51–56]. Sample preparation can impose large artefacts in the order of 10’s to 100’s of mV, such as due to tiny polishing marks, which may only be visible with ultra-high resolution microscopic observations. Furthermore, the pyrolysis of carbon on the surface (‘burnt carbon’), due to the ubiquitous presence of hydrocarbon in ambient air, which gets deposited onto the surface during sample preparation, have been reported to impose large Volta potential variations across unaffected and carbon-burnt regions [Citation57–59]. Hence, the surface condition has utmost importance to be ‘controlled’ when Volta potential measurements are conducted.
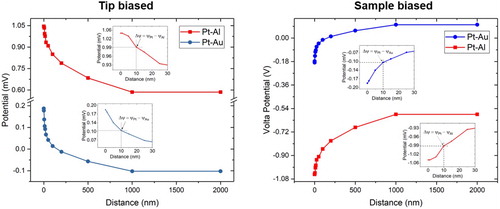
The Volta potential measured by SKPFM has been reported not to change with the increasing distance between 100 nm to a few micrometres within a so-called 'constant potential region' [Citation28]. The Volta potential is purely electrostatic and, therefore, the force between two separated point charges must decay by 1/x² with distance to each other according to Coulomb’s law. The Volta potential is not a constant quantity and it decreases with the increase of distance from the surface [Citation37,Citation48]. However, the Volta potential decay per unit distance may become negligibly small for large distances but this does certainly not hold true for distances smaller than 1 µm due to large Coulombic forces existing between point charges at small distances. shows the Volta potential difference measured between Pt (AFM tip) and Al or Au (reference samples) as a function of distance to each other. It can be clearly seen that the Volta potential obeys a hyperbolic relationship with the distance and that there is no constant potential region below 1 µm (there might be one between 1–2 µm). Thus, the Volta potential difference between two metals increases with the decrease of distance to each other and reaches maximum at ∼10 nmFootnote1 (begin of governing Surface potential region) [Citation14,Citation37]. Further decrease in distance increases image forces and the measured potential is not the Volta potential anymore, by definition at least [Citation14,Citation37]. Therefore, the lift height (in amplitude modulation, AM-KPFM) is an important parameter in measuring the Volta potential which must be stated when reporting Volta potential maps. Distance-related artefacts can be eliminated if the potential is measured in frequency modulation (single-pass method) [Citation16]. Problems arise if users report the Volta potential difference with different lift heights, making it difficult to cross-compare.
Figure 5. The dependence of the Volta potential difference between Pt and Al (top) or Au (bottom) as a function of distance. The measurement was performed using an OSCM-Pt R3 probe (platinum coated n-doped Si tip with 15 nm tip radius) and a PFKPFM-SMPL (Bruker) reference sample having discrete regions of Au and Al coating. A bias of 6000 mV was applied to the tip (left) and to the sample (right). The ambient temperature was 20°C with a relative humidity of ∼40%. Al and Au are less noble than Pt. Negative values indicate anodic (less noble) properties of Al or Au relative to Pt. Hence, . The Volta potential clearly depends on the distance between two electrodes. At distances ≥250 nm, the measurement indicates that Au is nobler than Pt. The image on the right hand-side is conform to the nobility concept in corrosion electrochemistry indicating cathodic (high nobility) characters for higher values and anodic properties (low nobility) for lower values.
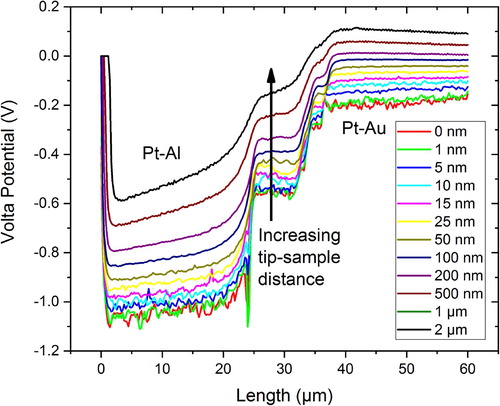
The Volta potential difference between two metals depends on the distance between their surfaces, as summarised in . The magnitude of the Volta potential difference, i.e. the strength of the signal, decreases with the increase of the distance, and the change is more manifested for metal couples having large Work function differences as demonstrated on the Pt-Al and Pt-Au couples in . The surface contribution to the Volta potential increases when the tip-sample distance decreases, and then topography or little chemical/structural variations across the surface contribute more to the measured potential. This becomes apparent from the potential signals showing more scatter when the tip-sample interaction is less than 10 nm (). It is not recommended to measure the Volta potential with distances lessthan 10 nm (ideally between 50 and 100 nm) due to Surface potential contributions to the measured value. Strictly speaking, measurements at distances less than 10 nm would not be the Volta potential. The potential scatter, however, may be related to the surface of the material, and therefore, in earlier work, a parameter called as 'Volta potential roughness' was introduced describing chemical/structural variations across the surface [Citation21].
Figure 6. Dependence of the Volta potential difference between Pt (tip) and Al or Au on the tip-sample distance. A bias of 6000 mV was applied to the sample. The Volta potential difference decreases with the increase of the tip-sample distance.
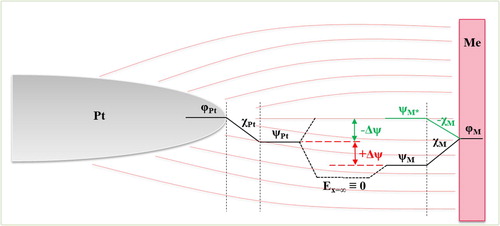
The Volta, Surface, and Galvani potentials between Pt (probe) and a metal (less noble) is summarised in the schematic shown in . An increased Surface potential can enhance the nobility of the metal resulting in a likewise enhancement of the Volta potential. The Volta potential alone is not a sufficient parameter to entirely characterise the nobility of a metal, and therefore, strictly speaking, the prediction of corrosion by scanning Kelvin probe force microscopy (SKPFM) is not possible, if measured in ‘dry’ air at least. The magnitude of measured by SKPFM can have similar values but can be of opposite sign (e.g. +200 mV or −200 mV), depending on the way of measurement. Therefore,
must be perceived as an absolute value, and information about its magnitude and polarity should not be omitted (due to e.g. flattening), in order to assess the nobility of a measured site relative to other regions in the microstructure and relative to the measured probe.
Figure 7. Simplified illustration of the Volta (ψ), Surface (χ), and Galvani (φ) potentials of Pt (probe) and a metal (less noble). The Surface potential can enhance the nobility of a metal resulting in a likewise enhancement of the Volta potential, which leads to a different Volta potential difference (Δψ) between both metals. The measured Volta potential difference is not sufficient to characterise the nobility of a metal. There can be similar potential differences but of opposite polarity.
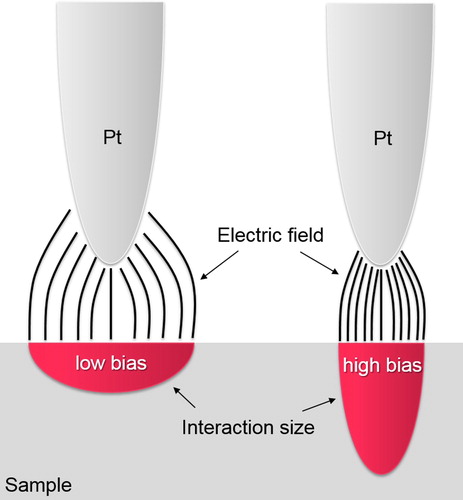
Another parameter that can further influence the magnitude and the resolution of measured Volta potentials is the bias voltage, as illustrated in . A bias above of a certain threshold is needed to measure the Volta potential difference between the probe and the sample, typically in the order between 500 and 1000 mV. Usually 6000–8000 mV is applied, but in principle there is no restriction not to apply lower or higher values. The electrostatic field generated due to the applied bias interacts with the surface of the metal, which strongly depends on the tip geometry, the roughness, and the magnitude of the bias [Citation16]. Large biases create dense electric fields which penetrate the surface to a few nanometers [Citation16]. Decreasing the biases decreases the penetration depth but increases the lateral interaction area of the electrostatic field with the surface of the metal. This is important since this can affect the spatial resolution of the measurement if small areas are mapped. In general, the spatial resolution of topography measurements is determined by the pixel size and the tip radius [Citation16]. The tip resolution can achieve maximum ∼2.5-times of the tip radius for cone-like tip geometries [Citation16]. However, the Volta potential resolution can be improved, spatially at least, when high bias voltages are used. The compromise, however, is that the depth resolution worsens. It is therefore advised to measure the metal to be investigated with varying biases and to use an optimised value.
Figure 8. Schematic illustrating the pit-sample interactions with two different bias voltages applied.
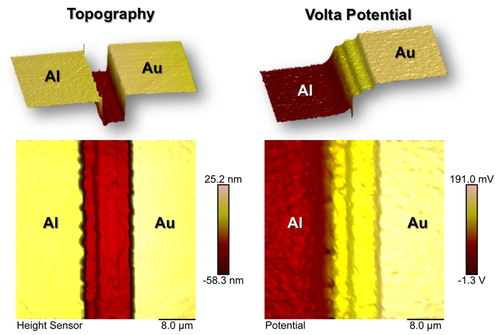
summarises Volta potential measurements with varying bias voltages. The magnitude of the measured Volta potential was not altered by the bias, but more volume information below the surface contributed to the measured potential when the bias was increased. This apparently had not a negative effect on the measurement outcome since pure metals were investigated. However, significant differences in the results may arise when materials having thin coatings or small particles are measured. It is always advised to check the quality of the tip by measuring against a known reference sample, as demonstrated here. This is needed not only to obtain absolute information of the measured data but also to verify the tip’s nobility relative to the investigated material. There might be a situation in which the tip is thought to be nobler than the studied metal which, however, may have the opposite nobility. This is demonstrated in for the Pt-Al couple. Au is nobler than Pt when measured with tip no. 5 and 6 for the same probe (OSCM-Pt R3) but the opposite is true when measured with tip no. 7 (all tips were new and from the same manufacturer). The tips are usually not identically fabricated and may show some variations in their Work function. Therefore, it has utmost importance to frequently measure the Volta potential of the tip relative to a known reference to verify its nobility. shows the topography and corresponding Volta potential maps of the used reference sample, which had a coated pattern of pure aluminium and gold on silicon. Au (with using tip no. 5) was nobler than Al and Pt, and apparently there is no topography artefact affecting the measured potential. SKPFM data is often questioned as being not reliable due to alleged topography artefacts. Artefacts may arise during measurements but this is rather a human error than a problem of the technique.
Figure 9. Dependence of the Volta potential on the bias voltage. The average Volta potential between the tip and the sample did not alter but the potentials increasingly scattered with the bias voltage.
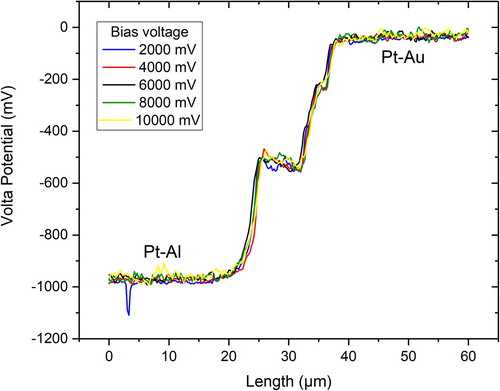
Figure 10. Dependence of the Volta potential on the tip (quality). The figure shows measurements of the Volta potential difference between Pt (tip) and Al or Au using three different tips (no. 5–7) of the same kind (OSCM-Pt R3). A bias of 6000 mV was applied to the sample. All measurements were done at room temperature with a relative humidity of ∼40%. The measurements were done within a few minutes (including the time for changing the probes).
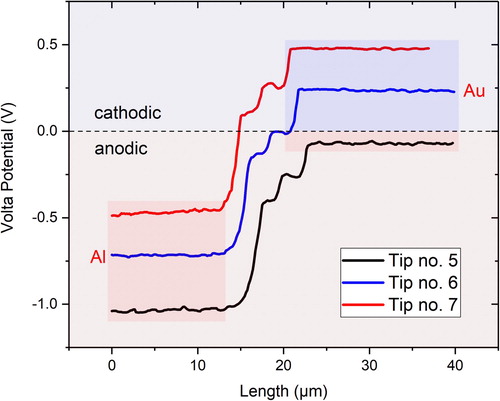
Figure 11. Topography and Volta potential information of the reference sample PFKPFM-SMPL having domains of pure aluminium and gold coated on silicon.
In this context, it is worth to discuss whether the tip can be perceived as a reliable reference as for conventional reference electrodes used in corrosion electrochemistry. If the tip’s Work function can be measured and its nobility verified, as shown above, then the tip is a reference with respect to Volta potential measurements. However, the Work function of the tip may change due to wear or damage, ultimately resulting in changes in the measured data. In case of a damage, this usually would be reflected by rapid potential changes in the map, and often no further measurements with good quality is possible. In such situations, it would be advised to look at the resonance frequency whether it has changed. If the measurement area is fairly constant (humidity, temperature, etc.) then the resonance frequency of the tip should remain the same. It is possible that the tip gets contaminated or spallation of the backside coating of the cantilever occurs, which changes the resonance frequency. This, however, may not necessarily affect the Volta potential measurement but a reference check is advised. The tip can, hence, be assumed as a reliable reference if one can go assure that the tip remained unaffected throughout the experiment. This can be done by measuring against a reference sample before and after the measurements. Humidity and temperature influence the Work function and hence the Volta potential, and therefore, it can be cumbersome to perform measurements in uncontrollable environments. In such cases it is advised to still report the results as obtained (no flattening) but providing all details such as humidity, temperature, the time elapsed between sample polishing and actual measurement etc.
The polarity concept
The Volta potential versus distance plot, shown in (left), was measured with a bias of 6000 mV, which was applied to the tip. It is important here to think about the polarity of the values measured. The measured data are relative to platinum, which has usually a higher Work function () than that of Al and Au, for ‘clean’ surfaces at least [Citation42–44,Citation60]. Higher Work functions reflect higher nobilities. Both curves show positive values for distances <1 µm (the bias was applied to the tip). The Work function of Al is lower than that of Pt and, therefore, the measured quantities need to be subtracted from the Work function of Pt (
) to obtain the Work function of Al (
). If
(probe) would be known, then
(sample) in absolute scale could be obtained. Hence, the following equation holds true for measurements with tip bias:
(6)
(6) where
is the Volta potential of the metal (here Al),
the Volta potential of platinum, and
the measured contact or Volta potential difference. In nowadays AFMs, the sample can also be biased ((right)) and the equation needs to be inverted:
(7)
(7)
In principle, it does not matter where the potential is applied to. However, it is of utmost importance to check the nobility of the probe versus a known reference in order to confirm its higher nobility than the sample. The bias polarity does not affect data interpretation (). In both cases, the sample (here Al) is less noble than the probe (here Pt). The bias polarity does, however, change the sign of the measured Volta potential differences and, therefore, it is not useful to report SKPFM data without giving information about the bias polarity and magnitude (the relevance will be shown later) and the probe’s nobility. Information about ‘low’ and ‘high’ potentials is not sufficient. The polarity needs to be properly defined before assessing the nobility of the sample to be measured.
The example above has shown how the nobility of the metal to be measured can be verified. Since positive values were measured for both Pt-Al and Pt-Au pairs, it can be inferred that Pt is nobler than Al and Au. Interestingly, there is a polarity inversion seen occurring between the Au-Pt pair for all potentials measured at distances >200 nm. Despite of ΦPt > ΦAu, holds true at >200 nm. So, while Pt is nobler than Au for distances at <200 nm (the point of intersection with the zero axis lies somewhere at ∼150 nm), Pt becomes less noble than Au at distances >200 nm, according to the measurements (this may have no physical meaning), apparent from the values with negative polarities. Seemingly, the Volta potential decay of Pt is larger than that of Au, leading to a nobility inversion for distances >200 nm. Disregarding the measured polarities can easily lead to a misinterpretation of the data measured by SKPFM. What is believed to be cathodic (high nobility) relative to the tip and yet relative to microstructural compounds may be in reality anodic (low nobility), or vice versa. Therefore, the polarity inversion as stipulated by Frankel et al. [Citation29] must be understood correctly.
From the above example, it has been shown that the knowledge about the Work function is needed to assess the nobility of a metal, and it has further been demonstrated that both the magnitude and the polarity of the measured Volta potential difference can change as a function of lift height. A simple check of the polarity of the measured data versus a known reference is not sufficient since this requires knowledge about the surface condition of the metal and the probe used. However, as shown for the Pt-Al pair (pure and clean states), the magnitude of the potential differences are >800 mV (positive values) showing that Al is less noble than Pt, unless Al would be covered by an electrically-resistive oxide layer (e.g. formed by ageing), which could make it even nobler than Pt (this will be shown later). Such oxide/hydroxide layers can be formed when the metal is exposed to corrosion, anodisation, or long-term natural oxidation. The reference sample used (Au and Al coated islands) had a clean surface and, therefore, the polarity, i.e. the nobility of Al and Au could be confirmed as less noble (anodic) relative to Pt, for short distances at least. In principle, the way of measurement (i.e. the lift height) should not affect the nobility or the nobility relative to the tip. The nobility of a metal is an intrinsic property and should be independent of measurement parameters. However, this example showed explicitly that the parameters used for Volta potential measurements need to be validated. Better is to measure the Volta potentials at distances ≤100 nm, and perhaps at 10 nm to be consistent with the definition. Most publications report a tip-sample distance of 50–100 nm.
The Kelvin technique uses the nullifying principle of either applying a current (SKP) or bias potential (SKPFM) to eliminate the contact potential difference existing between the probe and the metal to be investigated due to Work function differences. In principle, as mentioned above, it does not matter whether the tip or the sample is biased to measure the Volta potential difference. It is, however, important that a polarity convention is agreed on, in which the nobilities relative to the tip and within the microstructural compounds are correctly defined. At this point it may be useful to shed some light on the terms ‘anodic’ and ‘cathodic’. SKPFM certainly does not measure the corrosion potential (Ecorr) but is related to it. However, some unusual behaviour has been observed which is still open for discussion [Citation1–4,Citation24,Citation26,Citation28,Citation29]. In corrosion, the terms anodic and cathodic reflect the current passage caused by electrochemical reactions with chemical exchange. The metal is anodic if it dissolves by oxidation (e.g. leading to a charge transfer from the anode to the cathode, which consumes the electrons by a reduction reaction (e.g.
). In SKPFM, similar to corrosion, the term anodic reflects the tendency of a metal to take part in an oxidation reaction associated with charge transfer (electrons and not ions). Likewise, the cathode determined by SKPFM reflects the tendency of a metal (or local site in the microstructure) to take part in a reduction reaction. The terminology ‘relative nobility’ has often been used to characterise the compound with a higher propensity to oxidation reactions as anodic whereas that with lower propensity to oxidation was stated as cathodic [Citation6,Citation46,Citation61–63]. It should be emphasised that the potential measured by any Kelvin probe techniqueFootnote2 in ambient air or under thin-film electrolytic conditions is not the corrosion potential and cannot be compared directly with the corrosion potential obtained via the conventional electrochemical measurement. It, however, reflects the tendency of a metal to corrode and can certainly be correlated with the corrosion potential for a given environment, if a rigorous calibration work is performed [Citation1,Citation13,Citation24,Citation26,Citation28,Citation31–34,Citation64,Citation65]. Therefore, the term ‘nobility’ in SKPFM is strictly speaking not the same as that in corrosion. However, under most circumstances, the anodic character determined by SKPFM usually reflects the driving force for electrochemical oxidation reactions and is therefore a very useful parameter to better understand localised corrosion phenomena, although it should not be used directly for prediction.
The effect of the surface nature on both the magnitude and polarity of measured Volta potentials is shown on an aluminium alloy AA6063-T5 (). The alloy contains numerous intermetallics that are rich in Fe, Si, Mn, and Cr. These secondary phases have typically enhanced nobilities with respect to aluminium in their ‘clean’ surface conditions [Citation26–28,Citation35,Citation46,Citation61,Citation62,Citation66]. The material was mechanically ground and OPS-polished, which is an active oxide polishing suspension containing SiO2 nano-particles (from Struers, pH ≈ 9), and the Volta potential map was repeatedly measured with little latency (∼30 min). SKPFM measurements confirmed the cathodic nature of these intermetallics () with respect to the anodic matrixFootnote3, in line with other works [Citation26–28,Citation58,Citation67]. The potential map shows positive values if the tip is biased (top left in ), which means that the entire microstructure is less noble (anodic) than Pt. Here, low potentials (less positive) indicate cathodicFootnote4 regions whereas high potentials (more positive) indicate anodic (less noble) characters. If the bias is applied to the sample or if the previous map is mathematically inverted, then high potentials (less negative) indicate cathodic regions, whereas lower values (more negative) indicate an anodic nature (top right in ). This conforms to the electrochemical nobility convention and is the recommended way of reporting Volta potential data [Citation26,Citation29].
Figure 12. SKPFM Volta potential differences measured on an AA6063-T5 microstructure containing various Fe–Si–Mn–Cr-rich intermetallics in the alloy's matrix: (top) showing a freshly polished (‘clean’) surface where all intermetallics are cathodic relative to the matrix, (bottom) showing the same surface exposed to ambient air for two months and to controlled humidity (up to 95% RH) for a few hours where the intermetallics have become anodic relative to the matrix. Surface adsorption of oxide and/or hydroxide caused a nobility inversion within the microstructure. Note that the bias, beingeither applied to the tip or sample, does not affect data interpretation, but all data are of inversed polarity with respect to each other. All measurements were done in ambient air at 20°C and a relative humidity of ∼30%. The bias voltage was 6000 mV. An OSCM-Pt R3 (platinum coated) probe was used.
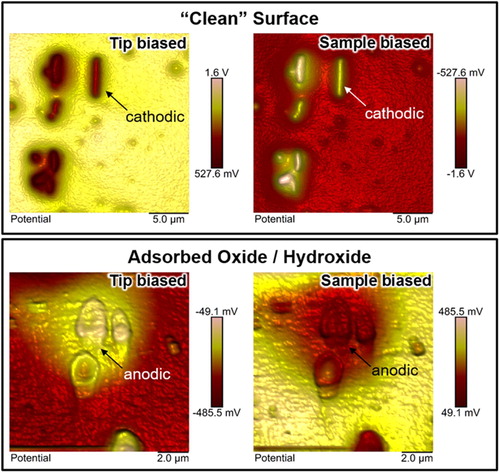
Next, the sample was stored in office-air environment for two months, followed by further exposure to controlled humidity (up to 95% RH) for ca. six hours, and was re-measured (bottom in ). The potential difference between Pt and the microstructure, measured in different regions across the sample, was largely reduced and even dropped to negative values. Negative values indicate that the microstructure become nobler than Pt. Exposure to air for two months with further exposure to controlled humidity (up to 95% RH) has clearly increased the electrochemical nobility of the entire microstructure as apparent from measured negative values (tip biased) or positive values (sample biased) relative to Pt. During the exposure in office-air environment, the sample was aged where oxide and/or hydroxide formation took place, a natural phenomenon seen on aluminium. This may have become more fostered during the exposure to humidity causing further oxidation and, perhaps, leading to atmospheric corrosion. The surface of the material was certainly affected by the environment, which resulted in a nobility enhancement of the entire microstructure. Moreover, the absolute majority of all intermetallics became anodic relative to the aluminium matrix, as apparent from the flipped potentials seen in (bottom).
This example clearly shows that the bias polarity can exhibit the Volta potential map with opposite sign. It further shows that it is not correct to assume the probe nobler than the sample since this would otherwise lead to misinterpretations. Furthermore, information such as ‘low’ and ‘high’ alone may not reflect the real nature of the surface. It is important to define and understand the (electrochemical) nobility of the material relative to the probe, and then the nobilities within the microstructure can be discussed more appropriately. The material in its freshly polished condition can be regarded to be more in its reference position, since both the nobility of the alloy relative to the probe and of the intermetallics with respect to the matrix can reverse when the microstructure is covered by a thicker (more resistive) layer of oxides and/or hydroxides (bottom in ). For a correct interpretation of the nobility of the microstructure relative to the AFM-tip and with respect to each microstructural component, two aspects are important: one is the knowledge about the Work function of the tip and the other where the bias is applied to. Pt has often been used due to its inertness (although it is not perfectly inert) and robust nature although changes of its Work function as a function of humidity has been measured and also confirmed by density functional theory (DFT) calculations [Citation68,Citation69].
Mixed-potential theory
In the following, the Volta potential concept will be brought into context with the mixed-potential theory to describe the connection between the Volta potential and the corrosion potential. The mixed-potential theory states that a minimum of one anodic and one cathodic partial reaction must exist and that these need to be separated from each other for a metal to corrode, with the anodic current(s) being consumed by cathodic reaction(s). In a corrosion cell, the electrode potential at each anode and cathode consists of a Volta potential and an interfacial potential between the metal and the electrolyte, and the sum difference of the potentials of both electrodes (half-cell) are the driving force for corrosion [Citation30,Citation45,Citation46,Citation70]. If the Volta potential difference between the anode and the cathode is significantly larger than the contribution of the interfacial potentials to the mixed potential, then the corrosion potential correlates with the Volta potential, and SKPFM can provide insightful information to better understand localised corrosion [Citation46]. For the other case, more work is required to elucidate the relationship between the Volta potential and diffusional or other processes which typically lead to large overpotentials at the interface. Volta potential measurements carried out in ‘dry’ air cannot provide direct information about coupled oxidation/reduction reactions as the ‘electrolyte’ needed for ionic exchange is missing for the establishment of electrochemical reactions. However, a connection to the mixed potential is possible and also plausible if, for example, the surface can be subjected to a thin-film corrosive electrolyte (atmospheric corrosion) in a controlled humid environment. Most metals form instantaneously an ultra-thin oxide layer, which usually increases the Volta potential as the Work function of most metals covered with oxides is often higher than that of pure metals [Citation71]. The Volta potential measured by SKPFM or SKP is a convoluted information consisting of all species on the outermost surface and the bulk underneath (reaching to some nanometers). So, when water is adhering onto the surface, both the thickness and the dipole orientation of the water molecules will influence the Work function and, hence, the Volta potential, and when more than approximately three monolayers of water are formed bulk aqueous-like corrosion will be established [Citation72]. On the anode, electrons will be liberated and transferred through the metal to the nearest cathode where cathodic reactions take place. This suggests, as earlier explained and illustrated in , that the loss of electrons on the anode will render the surface electropositive which ultimately results in a lowered Work function and hence nobility. The cathode, in the contrary, will get negatively charged which leads to an increased local Work function and, hence, to increased Volta potentials. All electrons are immediately consumed so that there is no charge pile-up occurring on the surface. Hence, anodic and cathodic Volta potentials can correlate with the half-cell potentials and thus with the mixed potential. In a nutshell, we can say that during anodic dissolution anodic Volta potentials are formed whereas cathodic Volta potentials develop on cathodic sites. Volta potential maps do not only show anodic regions but can also disclose cathodic sites with nanometer resolution (this is one of the key advantages of SKPFM and the Volta potential). If the oxidation power of the ‘thin-film’ electrolyte is high, i.e. if there is, for example, more oxygen available, then the cathodic reaction would promote anodic dissolution and hence the Volta potential difference between the anodic and cathodic regions would increase. In all, we can conclude that the concept introduced in can be used as a guide to interpret measured Volta potentials of a corroding metal.
Summary
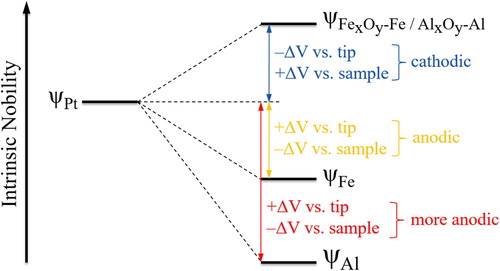
In a nutshell, the examples illustrated above clearly show that it is useful to report the measured Volta potentials in absolute scale (no data flattening) and with information about the surface nature of the material (polish condition) and experimental parameters such as the magnitude and polarity of the bias. The Volta potential data should be verified, if concern exists, using a calibration sample. The potential maps do not have to be inverted if the meaning of the values is correctly interpreted. It is, however, useful to show anodic sites as ‘low’ and cathodic regions as ‘high’ in the potential maps obtained by SKPFM in order to conform to the classic electrochemical scale of nobility, which was the point raised by Frankel et al. [Citation29]. A polarity convention for SKPFM measured Volta potentials, hence, is needed and has been summarised in . In practice, a Pt tip is often used for SKPFM measurements, and, therefore, the polarity convention holds true if the Work function of Pt is higher than that of the sample after ‘fresh’ polishing. Negative values indicate anodic nature of the sample relative to the tip, if the bias is applied to the sample and if the data has not been manipulated (no flattening). In this case, more negative values indicate less nobilities than regions with less negative values. Likewise, positive values indicate higher Work functions and, hence, higher Volta potentials of the sample relative to Pt. The entire polarity scheme is vice versa if the bias is applied to the tip. It is useful to apply the bias directly to the sample, which does not require a polarity inversion to show anodic regions low and cathodic ones high [Citation63]. The magnitude and polarity of the measured SKPFM Volta potentials are always useful and should not be omitted. The illustration in can be used as a guideline reference but should be used with precaution. The introduced polarity concept of the Volta potential is a step towards standardisation of SKPFM measurements, which is needed for cross-comparative purposes and correct data interpretation.
Figure 13. The polarity convention of Volta potentials measured by SKPFM on an example of two different metals (Fe and Al) versus Pt. Both metals can become nobler than Pt if sufficiently well-oxidized ultimately resulting in an inversion of their electrochemical nobilities relative to Pt (OSCM-Pt R3). Note that the electrochemical nobility (i.e. the cathodic/anodic nature) depends on the absolute Work function of the tip relative to that of the sample. If the Work function of the tip is less than that of the sample, then the electrochemical nobilities reverse.
Conclusions
There is a need for a polarity convention of SKPFM measured Volta potentials in order to understand the correct nobility of the sample relative to the probe (e.g. Pt) and the nobility of microstructural compounds relative to each other.
The Volta potential is an extremely surface-sensitive parameter, which can change as a function of surface condition.
Volta potential maps should always be reported together with sufficient information about the surface finish, environmental parameters, the latency i.e. the time past from sample polishing to begin with the experiment, operational parameters, such as the magnitude and polarity of the bias, measurement mode, and lift height, if any.
For a correct interpretation of the nobilities both the sample and the probe should be scrutinised, and the sample should be measured in its freshly polished state first to define a reference condition.
Acknowledgement
The authors are grateful for fruitful discussions with Dr Matthew Fielden, KTH Royal Institute of Technology.
Disclosure statement
No potential conflict of interest was reported by the authors.
ORCID
Cem Örnek http://orcid.org/0000-0002-3029-6493
Christofer Leygraf http://orcid.org/0000-0002-9453-1333
Additional information
Funding
Notes
1 The Volta potential has been defined at ≈10 nm above the surface.
2 It is nowadays possible to measure the Volta potential also with a measurement technique called intermodulation electrostatic force measurement [Citation63]. Volta potential measurements are not restricted to the use of the vibrating electrode (Kelvin) technique.
3 The polarity of the Volta potentials was calibrated using pure Au and Al references, as described earlier.
4 When we say ‘anodic or cathodic’ we mean anodic/cathodic Volta potentials and refer to the intrinsic nobility of the metal. Cathodic/anodic Volta potentials may not always correlate with electrochemically anodic/cathodic behaviour in a true corrosion system, as explained earlier.
References
- Rohwerder M, Turcu F. High-resolution Kelvin probe microscopy in corrosion science: scanning Kelvin probe force microscopy (SKPFM) versus classical scanning Kelvin probe (SKP). Electrochim Acta. 2007;53(2):290–299.
- Blücher DB, Svensson J-E, Johansson L-G, et al. Scanning Kelvin probe force microscopy. J Electrochem Soc. 2004;151(12):B621–B626.
- Örnek C, Walton J, Hashimoto T, et al. Characterization of 475°C embrittlement of duplex stainless steel microstructure via scanning Kelvin probe force microscopy and magnetic force microscopy. J Electrochem Soc. 2017;164(6):C207–C217.
- Örnek C, Engelberg DL. Correlative EBSD and SKPFM characterisation of microstructure development to assist determination of corrosion propensity in grade 2205 duplex stainless steel. J Mater Sci. 2016;51(4):1931–1948.
- Örnek C, Engelberg DL. SKPFM measured Volta potential correlated with strain localisation in microstructure to understand corrosion susceptibility of cold-rolled grade 2205 duplex stainless steel. Corros Sci. 2015;99:164–171.
- Bettini E, Kivisäkk U, Leygraf C, et al. Study of Corrosion Behavior of a 2507 Super Duplex Stainless Steel: Influence of Quenched-in and Isothermal Nitrides. Int J Electrochem Sci. 2014;9:61–80.
- Anantha KH, Örnek C, Ejnermark S, et al. Correlative microstructure analysis and in situ corrosion study of AISI 420 martensitic stainless steel for plastic molding applications. J Electrochem Soc. 2017;164(4):C85–C93.
- Bettini E, Eriksson T, Boström M, et al. Influence of metal carbides on dissolution behavior of biomedical CoCrMo alloy: SEM, TEM and AFM studies. Electrochim Acta. 2011;56(25):9413–9419.
- Sathirachinda N, Gubner R, Pan J, et al. Characterization of phases in duplex stainless steel by magnetic force microscopy/scanning Kelvin probe force microscopy. Electrochem Solid-State Lett. 2008;11(7):C41–C45.
- Sathirachinda N, Pettersson R, Wessman S, et al. Study of nobility of chromium nitrides in isothermally aged duplex stainless steels by using SKPFM and SEM/EDS. Corros Sci. 2010;52(1):179–186.
- Sathirachinda N, Pettersson R, Wessman S, et al. Scanning Kelvin probe force microscopy study of chromium nitrides in 2507 super duplex stainless steel—implications and limitations. Electrochim Acta. 2011;56(4):1792–1798.
- Sathirachinda N, Pettersson R, Pan J. Depletion effects at phase boundaries in 2205 duplex stainless steel characterized with SKPFM and TEM/EDS. Corros Sci. 2009;51(8):1850–1860.
- Hausbrand R, Stratmann M, Rohwerder M. The physical meaning of electrode potentials at metal surfaces and polymer/metal interfaces: consequences for delamination. J Electrochem Soc. 2008;155(7):C369–C379.
- Bockris JOM, Reddy AKN, Gamboa-Aldeco M, et al. Fundamentals of electrodics. Vol. 2A. New York: Kluwer Academic; 2002. p. 1–817.
- Bagotsky VS. The electrochemical society series. Hoboken (NJ): Wiley-Interscience; 2006.
- Sadewasser S, Glatzel T. Kelvin probe force microscopy measuring and compensating microscopy. Heidelberg: Springer; 2012.
- Burshtein RC. The investigation of corrosion of metals and semiconductors by Volta potential measurements. Electrochim Acta. 1962;7 (5):551–558.
- Kalinin SV, Gruverman A, editors. Nanoscale imaging and spectroscopy. New York: Springer, 2010.
- Zagórska I, Koczorowski Z. Volta potential at metal-solid salt interface and real potentials of ions in solid electrolytes. J Electroanal Chem Interfacial Electrochem. 1979;101(3):317–328.
- Galizzioli D, Trasatti S. Work function, electronegativity, and electrochemical behaviour of metals. J Electroanal Chem Interfacial Electrochem. 1973;44(3):367–388.
- Örnek C, Engelberg DL. An experimental investigation into strain and stress partitioning of duplex stainless steel using digital image correlation, X-ray diffraction and scanning Kelvin probe force microscopy. J Strain Anal Eng Des. 2016;51(3):207–219.
- Anantha KH, Örnek C, Ejnermark S, et al. In situ AFM study of localized corrosion processes of tempered AISI 420 martensitic stainless steel: effect of secondary hardening. J Electrochem Soc. 2017;164(13):C810–C818.
- Örnek C, Liu M, Pan J, et al. Volta potential evolution of intermetallics in aluminum alloy microstructure under thin aqueous adlayers: a combined DFT and experimental study. Top Catal. 2018;61(9–11):1169–1182.
- Rohwerder M. The Kelvin Probe Technique as Reference Electrode for Application on Thin and Ultrathin Electrolyte Films. In: Inzelt G, Lewenstam A, Editors FS, editors. Handbook of reference electrodes. Heidelberg: Springer; 2013. p. 333–340.
- Rohwerder M, Stratmann M, Grundmeier G. Corrosion Prevention by Adsorbed Organic Monolayers and Ultrathin Plasma Polymer Films. In: Marcus P, editor. Corrosion mechanisms in theory and practice. New York: Marcel Dekker; 2012. p. 617–667.
- Schmutz P, Frankel GS. Characterization of AA2024-T3 by scanning Kelvin probe force microscopy. J Electrochem Soc. 1998;145(7):2285–2295.
- Leblanc P, Frankel GS. A study of corrosion and pitting initiation of AA2024-T3 using atomic force microscopy. J Electrochem Soc. 2002;149(6):B239–B247.
- Frankel GS, Guillaumin V, Schmutz P. Characterization of corrosion interfaces by the scanning Kelvin probe force microscopy technique. J Electrochem Soc. 2001;148(5):B163–B173.
- Iannuzzi M, Vasanth KL, Frankel GS. Unusual correlation between SKPFM and corrosion of nickel aluminum bronzes. J Electrochem Soc. 2017;164(9):C488–C497.
- Rüetschi P, Delahay P. Potential at zero charge for reversible and ideal polarized electrodes. J Chem Phys. 1955;23(4):697–699.
- Stratmann M, Streckel H. On the atmospheric corrosion of metals which are covered with thin electrolyte layers—II. Experimental results. Corros Sci. 1990;30(6):697–714.
- Stratmann M, Streckel H, Kim KT, et al. On the atmospheric corrosion of metals which are covered with thin electrolyte layers-iii. The measurement of polarisation curves on metal surfaces which are covered by thin electrolyte layers. Corros Sci. 1990;30(6–7):715–734.
- Stratmann M, Streckel H. On the atmospheric corrosion of metals which are covered with thin electrolyte layers—I. Verification of the experimental technique. Corros Sci. 1990;30(6):681–696.
- Yee S, Oriani RA, Stratmann M. Application of a Kelvin microprobe to the corrosion of metals in humid atmospheres. J Electrochem Soc. 1991;138(1):55–61.
- Leblanc PP, Frankel GS. Investigation of filiform corrosion of epoxy-coated 1045 carbon steel by scanning Kelvin probe force microscopy. J Electrochem Soc. 2004;151(3):B105–B113.
- Bergveld P, Hendrikse J, Olthuis W. Theory and application of the material work function for chemical sensors based on the field effect principle. Meas Sci Technol. 1998;9(11):1801–1808.
- Moore WJ, Hummel DO, Trafara G, Holland-Moritz K, et al. Physikalische Chemie. New York: Walter de Gruyter; 1986. p. 1236.
- Wendt H, Kreysa G. Electrochemical engineering: science and technology in chemical and other industries. Heidelberg, Germany: Springer; 1999.
- Brett C M A, Brett A M O. Electrochemistry: principles, methods, and applications. New York, USA: Oxford Science Publications; 1993.
- Lange E. Über elektrochemische Grundbegriffe, insbesondere der Elektrode Metall/Lösung. Zeitschrift für Elektrochemie und angewandte physikalische Chemie. 1951;55(2):76–92.
- Lang ND, Kohn W. Theory of metal surfaces: work function. Phys Rev B. 1971;3(4):1215–1223.
- Michaelson HB. Work functions of the elements. J Appl Phys. 1950;21(6):536–540.
- Michaelson HB. The work function of the elements and its periodicity. J Appl Phys. 1977;48(11):4729–4733.
- Haynes WM, Lide DR, Bruno TJ, editors. CRC handbook of chemistry and physics. 97th ed. Boca Raton (FL): CRC Press Taylor & Francis Group; 2017. p. 2198 (2112–2123).
- Trasatti S. The absolute electrode potential: an explanatory note (recommendations 1986). Pure Appl. Chem. 1986;58(7):955–966.
- Jin Y, Liu M, Zhang C, et al. First-principle calculation of Volta potential of intermetallic particles in aluminum alloys and practical implications. J Electrochem Soc. 2017;164(9):C465–C473.
- Lübben JF, Baše T, Rupper P, et al. Tuning the surface potential of Ag surfaces by chemisorption of oppositely-oriented thiolated carborane dipoles. J Colloid Interface Sci. 2011;354(1):168–174.
- Eva Mutoro BL, Günther S, Janek J. Photoelectron Microscopy: Imaging Tools for the Study of Surface Reactions with Temporal and Spatial Resolution. In: Schafer R, Schmidt PC, editors. Methods in physical chemistry Vol. Vol. 1. Weinheim, Germany: Wiley-VCH; 2012. p. 513–546.
- Semov YI. Work function of oxidized metal surfaces and estimation of Al2O3 film band structure parameters. Phys Status Solidi B. 1969;32(1):K41–K44.
- Maachi B, Pirri C, Mehdaoui A, et al. Atomic force microscopy, scanning Kelvin probe force microscopy and magnetic measurements on thermally oxidized AISI 304 and AISI 316 stainless steels. Corros Sci. 2011;53(3):984–991.
- Loeb LB. Static electrification. Berlin: Springer; 1958. p. 32–58.
- Anderson PA. The contact difference of potential between barium and magnesium. Phys Rev. 1938;54(9):753–757.
- Li W, Li DY. Variations of work function and corrosion behaviors of deformed copper surfaces. J Appl Surf Sci. 2005;41(5):388–389.
- Li W, Li DY. Effect of surface geometrical configurations induced by microcracks on the electron work function. Acta Mater. 2005;53(14):3871–3878.
- Li W, Li DY. Influence of surface morphology on corrosion and electronic behavior. Acta Mater. 2006;54(2):445–452.
- Li W, Cai M, Wang Y, et al. Influences of tensile strain and strain rate on the electron work function of metals and alloys. Scr Mater. 2006;54(5):921–924.
- Efaw CM, da Silva T, Davis PH, et al. Toward Improving ambient Volta potential measurements with SKPFM for corrosion studies. J Electrochem Soc. 2019;166(11):C3018–C3027.
- Hurley MF, Efaw CM, Davis PH, et al. Volta potentials measured by scanning Kelvin probe force microscopy as relevant to corrosion of magnesium alloys. Corrosion. 2015;71(2):160–170.
- Mallinson CF, Watts JF. Communication—the effect of hydrocarbon contamination on the Volta potential of second phase particles in beryllium. J Electrochem Soc. 2016;163(8):C420–C422.
- Wilson RG. Vacuum thermionic work functions of polycrystalline Be, Ti, Cr, Fe, Ni, Cu, Pt, and type 304 stainless steel. J Appl Phys. 1966;37(6):2261–2267.
- Zhang F, Nilsson J-O, Pan J. In situ and operando AFM and EIS studies of anodization of Al 6060: influence of intermetallic particles. J Electrochem Soc. 2016;163(9):C609–C618.
- Davoodi A, Pan J, Leygraf C, et al. The role of intermetallic particles in localized corrosion of an aluminum alloy studied by SKPFM and Integrated AFM/SECM. J Electrochem Soc. 2008;155(5):C211–C218.
- Borgani R, Forchheimer D, Bergqvist J, et al. Intermodulation electrostatic force microscopy for imaging surface photo-voltage. Appl Phys Lett. 2014;105(14):143113.
- Cook AB, Barrett Z, Lyon SB, et al. Calibration of the scanning Kelvin probe force microscope under controlled environmental conditions. Electrochim Acta. 2012;66(0):100–105.
- Senöz C, Evers S, Stratmann M, et al. Scanning Kelvin probe as a highly sensitive tool for detecting hydrogen permeation with high local resolution. Electrochem Commun. 2011;13(12):1542–1545.
- Kharitonov DS, Örnek C, Claesson PM, et al. Corrosion inhibition of aluminum alloy AA6063-T5 by Vanadates: microstructure characterization and corrosion analysis. J Electrochem Soc. 2018;165(3):C116–C126.
- Pawar S, Zhou X, Thompson GE, et al. The role of intermetallics on the corrosion initiation of twin roll cast AZ31 Mg alloy. J Electrochem Soc. 2015;162(9):C442–C448.
- Heras JM, Viscido L. Work function changes upon water contamination of metal surfaces. Appl Surf Sci. 1980;4(2):238–241.
- Rusu PC, Brocks G. Work functions of self-assembled monolayers on metal surfaces by first-principles calculations. Phys Rev B. 2006;74(7):073414.
- Trasatti S. The Electrode Potential. In: Bockris JOM, Conway BE, Yeager E, editors. Comprehensive treatise of electrochemistry: the double layer. Boston (MA): Springer US; 1980. p. 45–81.
- Greiner MT, Chai L, Helander MG, et al. Transition metal oxide work functions: the influence of cation oxidation state and oxygen vacancies. Adv Funct Mater. 2012;22(21):4557–4568.
- Leygraf C, Wallinder IO, Tidblad J, et al. Atmospheric corrosion. 2nd ed. Hoboken (NJ): Wiley; 2016.