
 ?Mathematical formulae have been encoded as MathML and are displayed in this HTML version using MathJax in order to improve their display. Uncheck the box to turn MathJax off. This feature requires Javascript. Click on a formula to zoom.
ABSTRACT
The mean size and fraction of the second-phase particles in a 13% chromium steel are investigated, while no plastic deformation was applied. The results of the measurement are compared with the modelling results from a physicallybased model. The heating sequence is performed on samples using a Gleeble thermo-mechanical simulator over the temperature range of 850–1200°C. Using scanning electron microscopy (SEM) and energy dispersive spectroscopy (EDS), the size distribution and composition of the carbides were evaluated, respectively. For obtaining particle size distribution (PSD), an image-processing software was employed to analyse the SEM images. Additionally, the relation between the 2D shape factor and size of the particles is also studied at different temperatures and most of the particles turned out to have a shape factor close to two. In order to measure the carbide weight fraction, electrochemical phase isolation was employed. The Ms and fraction of the martensite phase after quenching of samples are calculated and the results were comparable with the measured hardness values at corresponding temperatures. The measured hardness of the samples is found to comply very well with the measured mean size of the precipitates. The calculated mean size of the particles from the model shows very good agreement with both hardness value and experimentally measured mean size, while the calculated volume fraction from simulation follows a slightly different trend.
Introduction
Knowledge about the size and fraction of the second-phase particles is an intense field of interest in both academia and industry. This strong interest arises from the critical role of these particles in microstructure evolution during the manufacturing process and their influence on the final properties of the material [Citation1–3].
The second-phase particles are the result of the diffusional phase transformation. This thermally activated phenomenon that occurs continuously during many industrial processes, determines the final properties of the material. The second-phase particles are known to usually harden the material, mainly by interacting with dislocations. Dislocations can cut and pass through these particles or loop around them and harden the work piece. If the particles are hard enough the so-called Orowan bowing [Citation4] sets an upper limit for the hardening. In particle strengthening process, many other parameters, including alloying effect, type of particles, particle coherency and shear modulus, and the particle matrix interfacial energy, are also influential in addition to the size and fraction of the particles [Citation5–7]. In precipitation which happens through a series of nucleation, growth and coarsening events [Citation8], first the size and fraction of particles increase simultaneously until the equilibrium fraction is achieved. At this stage, only particle size increases further by coarsening and the fraction remains constant during an isothermal heat treatment. These variations in fraction and size will affect the particle spacing, which is an important parameter in calculating the Orowan strengthening mechanism [Citation9] and calculating the flow stress [Citation10–13]. Therefore, the knowledge about the size and fraction of precipitations would be crucial to adjust the final microstructure of the product as well as the process parameters especially those related to the flow stress modelling.
Precipitation modelling has also advanced a lot recently and many good models were developed that can verify experimental data with high accuracy [Citation14–17]. However, the current authors could not find any quantitative study on the second-phase particles of this 13 wt% chromium steel or any similar grade at the temperatures above 800°C so far. This temperature is important because most of the hot working processes of this alloy take place at this temperature interval and accurate quantitative information about the present precipitates is crucial for controlling any high-temperature deformation process or for the modelling purposes.
In this study, the existing second-phase particles of a 13% chromium steel at the temperatures from 850 to 1200°C are investigated and the results are compared with those obtained from the model used to simulate the flow stress for this alloy [Citation13]. This comparison is made assuming that any change in the size and fraction of the carbides is negligible due to the short time of deformation, i.e. approximately one minute for the longest test. In the experimental part, precipitations are first identified using scanning electron microscopy (SEM) and energy dispersive spectroscopy (EDS) and then the SEM images are analysed by an image-processing software, ImageJ [Citation18], to generate particle size distributions (PSD), and the shape factor of the carbides. In order to investigate the fraction of particles, electrochemical phase isolation method is used and finally, the measured hardness of the samples at all temperatures is also compared with the obtained carbide mean size and fraction in addition to the calculated Ms and martensite fraction in each sample after quenching.
Material and experiments
The chemical composition of the material, which was studied in this work, is given in .
Table 1. The chemical composition of the studied material.
Test specimens were shaped to cylinders of radius 10 mm and length of 15 mm from a hot-rolled slab. All the samples went through a similar heating cycle using a Gleeble thermo-mechanical simulator, according to the schematic diagram of .
Figure 1. Schematic heat sequence in the Gleeble thermo-mechanical simulator. Start and end points of tests are room temperature.
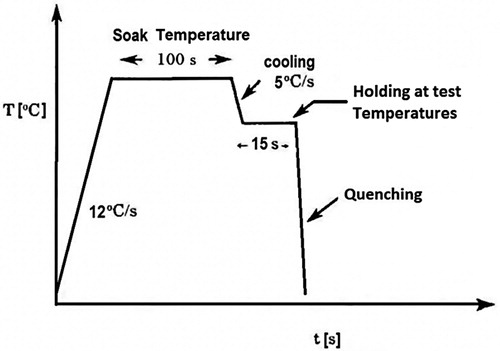
The samples were first heated up to near 1250°C and held there for 100 s to obtain an austenitic microstructure. Then they were cooled down to various desired test temperatures followed by 15 s soak to achieve a uniform temperature and then quenched to room temperature using compressed air without any deformation in samples.
The metallographic examinations were initially performed using light optical microscopy (LOM) and hardness measurements. Vickers hardness was measured using a low-load hardness tester with one-kilogram load (HV1) under ambient laboratory conditions. Each length of the diagonal square-shaped Vickers indents was measured with LOM immediately after indentation. The mean Vickers hardness was calculated from five indentations on each sample.
In order to study the second-phase particles in detail, a Zeiss Sigma Scanning Electron Microscope (SEM) equipped with Oxford Instrument Energy Dispersive X-ray spectroscopy (EDS) was used.
Electrochemical phase isolation was carried out on samples using a VersaSTAT 3 Potentiostat with a mixture of ethanol and 10% hydrochloric acid (HCl) as electrolyte. In this technique, after an electrochemical reaction the matrix dissolves but other phases, i.e. carbides, generate a solid–liquid solution can be filtered for later measurements. The solution including the dissolved matrix and remained carbides was filtered using PALL Super® 200 filters with a pore size of 0.2 microns. The filters were dried in the oven before and after the tests and the weight differences were assumed to be only from the carbides in the solution.
The model
The model used to analyse our experimental results were described in detail elsewhere [Citation11,Citation13] and for example, it can predict the flow stress based on the dislocation density evolution during plastic deformation. The dislocation density-dependent flow stress in the model is stated as follows:(1)
(1) where σ is the true stress and σ0 represents strengthening contributions from solute drag, Peierls-Nabarro stress (athermal) and the second-phase particles. However, since the focus in this work is on deformation at very high temperatures, the only effective contributor would be from particles and the other contributions can be neglected. G, m, b, α and ρ are the shear modulus, the Taylor factor, Burgers vector, a constant with the value of 0.15 [Citation19] and the dislocation density. Assuming that σ0 is mainly related to strengthening effects from the Orowan hardening mechanism [Citation9], it can be described by Equation (2).
(2)
(2) where Lprec is the particle spacing and assuming a random distribution of particles it can be obtained from Equation (3).
(3)
(3) In Equation (3), r and f are the mean size and volume fraction of the precipitates, respectively.
Another important parameter in the model is the ratio of precipitate volume fraction and their mean size (f/r). Knowing σ0, the operative particle spacing (Lprec) can be calculated from Equation (2) and with substituting Lprec in Equation (3) and using (f/r) ratio, the mean size and fraction of precipitates can be calculated at different temperatures from Equations (4) and (5).(4)
(4)
(5)
(5)
Generally, in modelling it is common to assume that the particles are uniformly distributed spheres of radius r; the same concept was adopted in this work as well. All these calculations for mean size and volume fraction are based on the assumption that, due to a relatively short deformation time, the fraction and size of carbides do not change considerably before and after the hot compression tests, from which the values of σ0 and the f/r ratio were determined [Citation13].
Results
Modelling
Both σ0, i.e. the strengthening effect from the carbides, and f/r ratio were obtained for the test material in another work [Citation13], and the results are summarised in .
Table 2. σ0 and f/r ratio that used in flow stress modelling for the test alloy [Citation13].
Data at 850°C are adapted from an unpublished work, although the values are obtained in the same way as for the other temperatures. Substituting values from into Equations (4) and (5), the mean size and volume percent of precipitates were calculated, and the results are shown in .
Table 3. Resulted mean size and fraction of the carbides from the data in .
Experimental
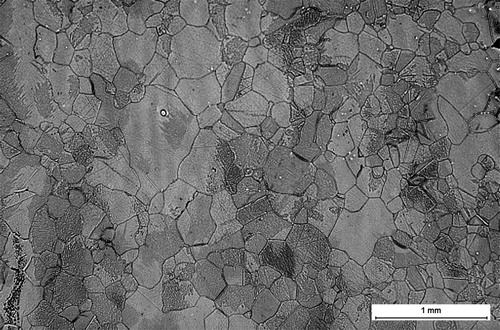
Metallographic investigation was started with LOM and measuring grain size followed by hardness measurements. shows the average grain size of the quenched samples using the linear intercept method.
Table 4. Measured average grain size by linear intercept method for samples quenched from different temperatures.
The LOM micrograph of a sample quenched from 900°C is illustrated in .
Figure 2. LOM image of the sample quenched from 900°C with 25X magnification, the scale bar is 1 mm.
The hardness of the samples is measured using a Vickers hardness testing machine and the average value from five separate measurements on each sample are presented in .
Table 5. The average Vickers hardness of samples quenched from various temperatures, measured using 1 Kg load (HV1). Numbers in parentheses are the obtained standard deviations.
The samples were further investigated using SEM and EDS in order to identify different particles in more detail. From the early observations, two types of particles were generally present in the samples. The vast majority of the observed particles were chromium carbides, but there were also a few non-metallic inclusions, mainly sulphides and oxides, which are not in the scope of this work.
In SEM observation, the evident characteristic of the samples was the random distribution of the precipitates and the obvious size difference of carbides inside the grains and on the grain boundaries. Carbides with a noticeable larger size were mainly located on the grain boundaries, while finer carbides were generally distributed inside the grains. Additionally, some grains and grain boundaries were containing carbides, while others did not. In , a high-resolution SEM image of a sample quenched from 1100°C shows the typical microstructure of the samples together with four different chosen points for EDS analysis.
Figure 3. SEM micrograph of the sample quenched from 1100°C, (a) lower magnification, and (b) higher magnification of the selected area in (a). Scale bars in (a) and (b) are 10 and 2.5 µm, respectively. Arrows in (b) show the selected points for EDS analysis.
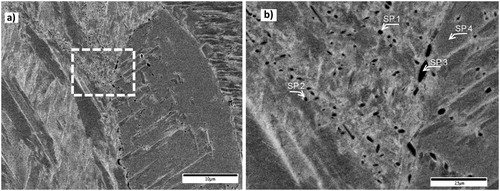
summarises the EDS point analysis results of three different carbides in addition to the matrix, as shown in (b). Spectrum one (SP.1) originates from a carbide inside the grain, while spectrum two and three are for analysing two carbides at the grain boundary with a noticeable size difference, and spectrum four (SP.4) is more representative for the matrix. This last point (SP.4) was selected to distinguish the composition difference between the carbides and the matrix and also to compare the results with the provided nominal composition of this alloy. Measured values in the table are in mass present and the numbers in parentheses are the respective standard deviations.
Table 6. EDS analysis results for the displayed points in the (b). Values in the parentheses are the standard deviation.
It is obvious from the results in that the first three selected points, i.e. carbides, are rich in chromium and carbon, while they have less iron in their composition as compared to point 4 which is more representative for the matrix. This difference in element content becomes more pronounced as the carbide size increases, which is in agreement with other observations [Citation20]. To verify that all the observed particles are chromium carbides, EDS area mapping was also employed to identify the carbides in the samples. shows an EDS maps for different elements in a sample at 850°C.
Figure 4. EDS compositional map for identifying chromium-rich carbides, (a) SEM image, (b) C Kα1, (c) Cr Kα1 and (d) Fe Kα1. Scale bar is 10 μm. The brighter area shows higher element contents in b, c and d.
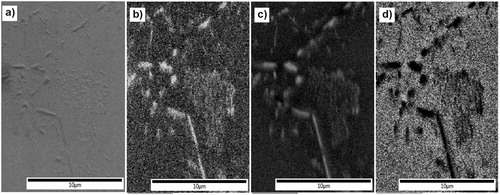
The EDS area maps, similar to point analysis, clarify that the observed carbides are rich in chromium and carbon and depleted from iron compared to the neighbouring matrix.
In phase isolation, the matrix was dissolved using an electrochemical reaction which led to the release of the carbides in the solution. During this process, the electrolyte was turned into green which indicates chromium release. The obtained suspension, which contains carbide particles, was filtered and then all filters were dried in an oven to eliminate moisture. Both samples and filters were weighted before and after the tests to obtain the weight fraction of the carbides. summarises the calculated weight percent of the carbides from these values.
Table 7. Carbide weight fraction according to the weight of filters and samples before and after the phase isolation process.
In , at 1200°C, the fraction is very low compared to other temperatures which seems reasonable. At other temperatures, the fraction decreases progressively from its peak at 1100°C with decreasing temperature but at 850°C the fraction raises again.
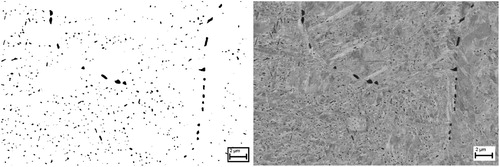
In order to study the PSD in the samples, several SEM images with different magnifications at all test temperatures were processed with the ImageJ software. In this process, the chosen SEM images were transferred to binary black and white images according to the contrast and the equivalent circular diameters (ECD) of the carbides were calculated from their measured area. shows an SEM image and the corresponding processed binary image with carbides in black for a sample quenched from 1100°C.
Figure 5. SEM image of the sample quenched from 1100°C (right) and the corresponding processed binary image (left). Matrix is turned white and carbides remained black for measurements.
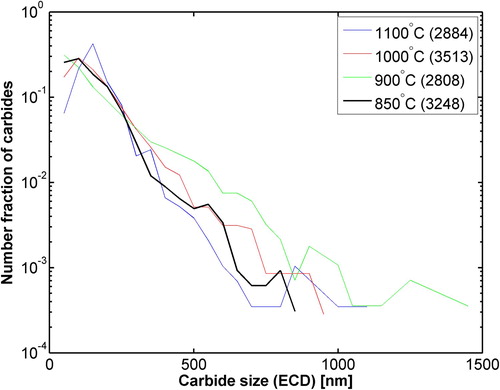
Using this method, particle size distributions were obtained for all the samples except for the one quenched from 1200°C where only a few carbides were observed with SEM and it is excluded to keep the acceptable statistics in the calculations. The logarithmic number fraction of carbides versus their equivalent circular diameter (ECD) is plotted in .
Figure 6. Number fraction vs equivalent circular diameter (ECD) of carbides at various test temperatures, values in parentheses are the total number of observed carbides.
Each PSD was fitted to a bimodal log-Normal distribution function [Citation21] and the results together with the mean ECD of the carbides at all temperatures are presented in .
Figure 7. Experimental particle size distributions and the corresponding fitted bimodal distributions for all the quenched samples. SD and M are the standard deviation and geometrical mean of each log-normal distribution function, respectively.
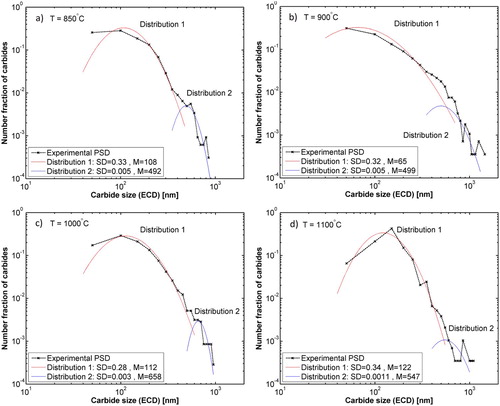
As it can be seen in , the distribution functions are bimodal, one mode represents the larger carbides and the other is for the smaller carbides. This is also in a good agreement with the earlier SEM observations.
summarises the mean ECD calculated for the both functions shown in together with the arithmetic mean size for the whole range of data. The mean size decreases from 1100°C to 900°C but increases again at 850°C. It should be noted that the mentioned mean values of distribution functions in are geometric means and differ from the arithmetic means that are given in .
Table 8. Mean size of the carbides obtained from distribution one and two at each temperature in and the arithmetic mean for the total range of data.
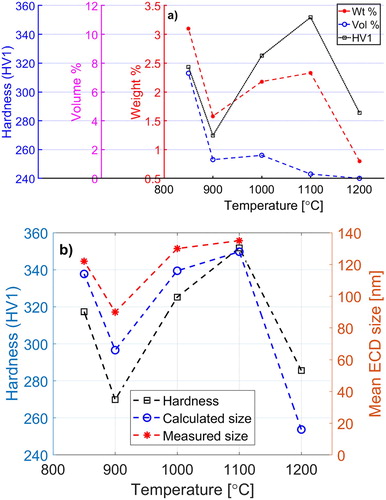
Comparing the hardness measurement results with the weight fraction of the carbides in and their mean size in , it can be seen that the hardness curve has a very similar trend as the measured size and fraction have. shows the mean size and fraction of the observed carbides in comparison to the model results and hardness of the samples.
Figure 8. Comparison of the hardness values with fractions (a) and measured equivalent circular diameter (ECD) with the calculated mean size of the carbides at different temperatures (b). In (a), the experimental measurements are showing weight fraction, while the model results are in volume fraction.
Another interesting remark during the image analysing was obtaining the shape factor of the counted carbides which can give quantitative information about their shape. By comparing the shape factor of the carbides with their size, it might be possible to understand the carbide precipitation behaviour at different temperatures. depicts an intensity diagram for the size of the carbides against their shape factor. The colour bar shows the number density of the carbides.
Figure 9. Intensity diagram shows the accumulation of the observed carbides with respect to their size and shape factor for samples quenched from different temperatures, (a) 850, (b) 900, (c) 1000 and (d) 1100°C.
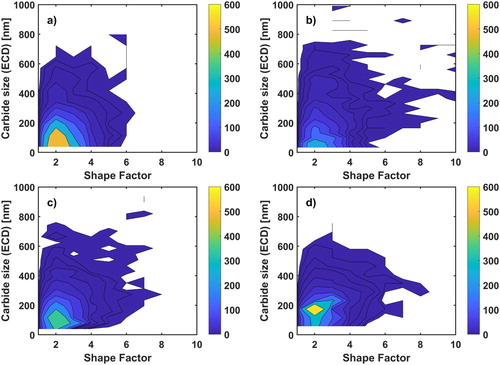
In , the highest density for carbides lies in a region of shape factor between one and three with a size lower than 200 nm at all temperatures. There are no data for carbides with size under 40 nm due to SEM resolution limit.
Discussion
From the SEM investigations, it is obvious that some grains have carbides both at the boundaries and inside them, while others are free from carbides. This might be due to composition variations in the matrix, especially carbon content variation, as a direct effect of solute partitioning or the so-called micro-segregation during solidification.
In , which is representative for the general observed microstructure in this study, most of the carbides are in the order of a few hundreds of nanometres, especially the intragranular carbides, e.g. spectrum 1. Additionally, the concentration of iron seems higher in smaller carbides comparing to relatively larger carbides, see data from spectrum 3. This could be due to the small size of the carbides that leads to detect signal from the iron-rich matrix or as Hou et al. [Citation22] reported in a study on M7C3 carbides, the newly precipitated carbides were more iron rich in their metallic composition than previously precipitated carbides. Coarser carbides are mainly located on the grain boundaries, e.g. spectrum 3. These intergranular carbides, by having no effect on the moving dislocations, are not generally contributing to the hardening in flow stress calculations and this might be the reason that the model predicts lower fraction of carbides compared to measured values.
As the temperature decreases, other type of carbide will become thermodynamically stable and nucleation and the growth of this new carbide could be the reason for the sudden rise in the mean size and fraction of particles at 850°C. However, Inoue and Masumoto [Citation23] proposed that M7C3 could transform to other stable carbides, i.e. M23C6, during temperature decrease.
The bimodal PSD in was also observed to be plausible by Chen et al. [Citation24] after modelling precipitation in a Fe-Cr-C alloying system during an isothermal annealing. Chen et al. claimed that the bimodal distribution was the result of the slower growth rate in smaller particles and remarkably the faster growth rate of larger ones due to different dominant size-dependent growth mechanism.
In , by comparing the results, the maximum of the mean carbide size occurs at 1100°C. This maximum can be described by the lower driving force and higher diffusion rate, which favour the formation of rather large carbides at this high temperature. But at a relatively lower temperature, e.g. 850°C, there is a higher driving force for precipitation but lower diffusion rate which probably leads to the precipitation of finer carbides. Detecting all these fine carbides might be hard especially with the available resolution of SEM and limited pore size of the filters used in the phase isolation process.
Although hardness values and the mean size and weight fraction of the experimental measurements demonstrate a similar trend, these results are not comparable with the σ0 values for this steel at the same temperatures that are shown in . While the σ0 values increase with the decreasing temperature, the other mentioned values, e.g. mean size of particles, increase from 1200°C to a maximum at 1100°C and then drop to a minimum at 900°C and rise again at 850°C.
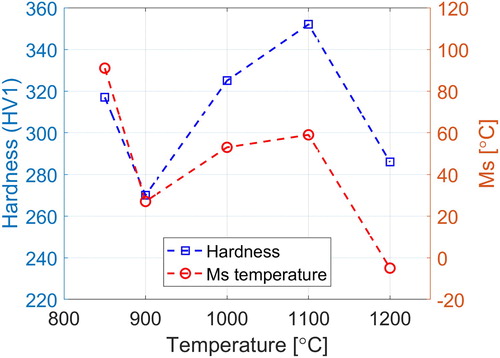
A possible reason for this behaviour is martensite formation during quenching and to investigate this, the martensite start temperature, Ms, and the amount of martensite formed during quenching were calculated.
The Ms temperatures were calculated from Steven and Haynes [Citation25] formula, and the equilibrium values for carbon content and mass fraction of M7C3, as the main second-phase particle, were obtained from Thermo-Calc with the TCFE7 database. The results showed a close to linear relation between mass fraction of M7C3, Wp and Ms which is used to estimate the Ms temperatures for the experimental values of Wp. The calculations imply that martensite will form in samples quenched from 1100°C and lower, in addition to an Ms trend which is in accordance with the measured hardness values as shown in .
Figure 10. Calculated Ms temperatures and its relation to measured hardness.
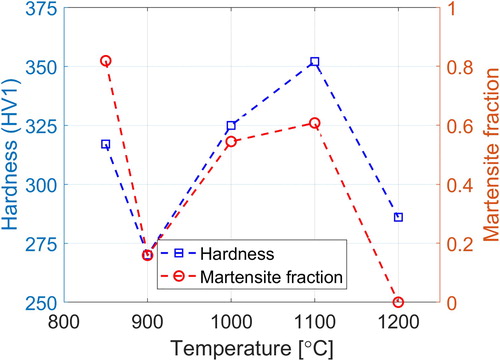
The relation between hardness and volume fraction of martensite, Xm, that is calculated from the relation given by Koistinen and Marburger [Citation26] and using a k value equal to 0.024 given in literature [Citation27] is depicted in .
Figure 11. Comparison between calculated martensite fraction and measured hardness at different temperatures.
The contradictory behaviour of σ0 and hardness in accordance to quench temperatures could be described in respect to second-phase particles as well. While the fraction of large particles who are not contributing in hardening was higher at high temperatures the smaller particles with more strengthening effect were abundant at lower temperatures. The measured size and fractions in this study might not show this trend clearly since the data are not conclusive and the statistics are mainly related to rather large particles. It is however in accordance with the fact that growth rates are higher at high temperatures, while the nucleation rates are low and vice versa.
The experimental limitation in measuring the weight fraction of carbides, i.e. filter pore size of 200 nm, most probably leads some fine carbide to pass through the filter and consequently excluding their effect in the results. Additionally, the SEM resolution might not be sufficiently good to capture all small but effective nano-sized carbides and other measurements, such as transmission electron microscopy (TEM), might be needed.
The effect of these issues can be supported by the results from the image analysis. For example, in it is possible to estimate, by extrapolating at 850°C and 900°C, that there are probably areas with high concentration of fine particles which are not covered in this figure. This is also in agreement with the greater σ0 values at these two mentioned temperatures compared to other higher temperatures and our assumption that σ0 mainly originates from Orowan hardening mechanism at the test temperature range of this study. Moreover, when the temperature falls, more particles are precipitating from the solid solution that contributes to hardening and increase of σ0, although since they are in the early stage of precipitation they have a small size which makes it hard to be captured easily.
Finally, the number density of carbides with respect to their size and shape factor in shows that small carbides mainly have a shape factor of close to two, and this shape factor can be related to the relative energy of the bounding interfaces, i.e. the ratio of grain and phase boundary interface energies. This shape factor might suggest a lenticular or cylindrical 3D shape for the carbides.
Conclusions
In this work, a 13 wt% chromium steel is investigated mainly to develop a better understanding about precipitation in this alloy with studying the mean size and fraction of the present second-phase particles at temperatures above 800°C. This temperature has been chosen since it is a common interval for hot working processes and to gather more data about the material’s microstructure at this state.
According to the metallographic assessments and SEM observations, generally two classes of carbides exist in the samples. One is the small intragranular carbides, and the second is relatively larger intergranular carbides. This observation is later verified by the particle size distribution calculations and it is calculated that the former ones have a mean equivalent circular diameter (ECD) of around 100 nm, while the latter ones have a mean ECD of roughly 500 nm.
The composition of the precipitates, studied with EDS, shows that most of the particles are chromium carbides, and finer carbides have less chromium and carbon content in their composition, while they are richer in iron, in contrast to coarser carbides.
Phase isolation analysis is performed to obtain the weight fraction of the second-phase particles at all test temperatures. The sample quenched from 1200°C had the lowest fraction and the carbide fractions decrease from a peak at 1100°C to a minimum at 900°C but rise again at 850°C.
The measured mean size of carbides has a similar trend as for the carbide fraction measurements and the average hardness values of each sample. This behaviour is most probably due to the precipitation start of M23C6 carbides in vicinity of 850°C for this alloy.
These results are compared with the calculated mean size and volume fraction of the carbides from the data used in the hot compression flow stress simulations. The mean size from the model shows a good agreement with experimental measurements, while the volume fraction follows a slightly different trend.
The Ms temperature and fraction of martensite were also calculated for all test temperatures and the results had a similar trend as the measured hardness data.
In general, it seems that the majority of carbides were under 200 nm and had a 2D shape factor close to two, which might show the ratio between the grain and phase boundary energies and suggest a lenticular or cylindrical 3D shape for them.
Acknowledgements
The authors are grateful to Sandvik Materials Technology’s support for this work and providing the experiment material. Special thanks to the R&D personnel for their support and helpful discussions, especially Raveendra Siriki, Lisa Karlsson, Jerry Lindqvist and Fredrik Sandberg. The authors are gratefully acknowledging the sponsors of SIFOS; Regional Development Council of Dalarna, Regional Development Council of Gävleborg, County Administrative Board of Gävleborg, The Swedish Steel Producers’ Association, Dalarna University and Sandviken City Council.
Disclosure statement
No potential conflict of interest was reported by the authors.
ORCID
Nima Safara http://orcid.org/0000-0002-3812-5285
Correction Statement
This article has been republished with minor changes. These changes do not impact the academic content of the article.
References
- D.H. Bratland, Ø Grong, H. Shercliff, O.R. Myhr, and S. Tjøtta, Overview No. 124 modelling of precipitation reactions in industrial processing, Acta Mater. 45 (1997), pp. 1–22. doi: 10.1016/S1359-6454(96)00100-0
- S. Jiang, H. Wang, Y. Wu, X. Liu, H. Chen, M. Yao, B. Gault, D. Ponge, D. Raabe, A. Hirata, M. Chen, Y. Wang, and Z. Lu, Ultrastrong steel via minimal lattice misfit and high-density nanoprecipitation, Nature 544 (2017), pp. 460–464. doi: 10.1038/nature22032
- D.P. Dunne, Review: Interaction of precipitation with recrystallisation and phase transformation in low alloy steels, Mater. Sci. Technol. 26 (2010), pp. 410–420. doi: 10.1179/026708309X12526555493350
- E. Orowan, Internal Stress in Metals and Alloys, The Institute of Metals, London, 1948, p. 451.
- B. Verlinden, J. Driver, I. Samajdar, and R.D. Doherty, Work hardening, in Thermo-Mechanical Processing of Metallic Materials, R. Cahn, eds., Elsevier, 2007. pp. 55–81.
- Y.R. Wen, Y.P. Li, A. Hirata, Y. Zhang, T. Fujita, T. Furuhara, C.T. Liu, A. Chiba, and M.W. Chen, Synergistic alloying effect on microstructural evolution and mechanical properties of Cu precipitation-strengthened ferritic alloys, Acta Mater. 61 (2013), pp. 7726–7740. doi: 10.1016/j.actamat.2013.09.011
- G. Couturier, C. Maurice, and R. Fortunier, Three-dimensional finite-element simulation of Zener pinning dynamics, Philos. Mag. 83 (2003), pp. 3387–3405. doi: 10.1080/1478643031000152771
- R. Wagner, R. Kampmann, and P.W. Voorhees, Homogeneous second-phase precipitation, in Phase Transformations in Materials, G. Kostorz, ed., Wiley-VCH Verlag GmbH & Co. KGaA, Weinheim, FRG, 2005. pp. 309–407.
- L.M. Brown and R.K. Ham, Dislocation-particle interactions, in Strengthening Methods in Crystals, A. Kelly and R.B. Nicholson, eds., Applied Science Publishers, London, 1971. pp. 9–135.
- T. Gladman, Precipitation hardening in metals, Mater. Sci. Technol. 15 (1999), pp. 30–36. doi: 10.1179/026708399773002782
- G. Engberg and L. Lissel, A physically based microstructure model for predicting the microstructural evolution of a C-Mn steel during and after hot deformation, Steel Res. Int. 79 (2008), pp. 47–58. doi: 10.1002/srin.200806315
- G. Engberg, I. Kero, and K. Yvell, Modeling microstructure development during hot working of an austenitic stainless steel, Mater. Sci. Forum 753 (2013), pp. 423–426. doi: 10.4028/www.scientific.net/MSF.753.423
- N. Safara, G. Engberg, and J. Ågren, Modeling microstructure evolution in a martensitic stainless steel subjected to hot working using a physically based model, Metall. Mater. Trans. A 50 (2019), pp. 1480–1488. doi: 10.1007/s11661-018-5073-6
- A. Bjärbo and M. Hättestrand, Complex carbide growth, dissolution, and coarsening in a modified 12 pct chromium steel—an experimental and theoretical study, Metall. Mater. Trans. A 32 (2001), pp. 19–27. doi: 10.1007/s11661-001-0247-y
- H. Magnusson and R. Sandström. Modelling of the Influence of Laves Phase on the Creep Properties in 9% Cr Steels, Proceedings of the ASME 2007 Pressure Vessels and Piping Conference, Volume 9: Eighth International Conference on Creep and Fatigue at Elevated Temperatures, San Antonio, Texas, USA. July 22–26, 2007. pp. 519–526. ASME. https://doi.org/10.1115/CREEP2007-26417.
- O. Prat, J. Garcia, D. Rojas, C. Carrasco, and A.R. Kaysser-Pyzalla, Investigations on coarsening of MX and M23C6 precipitates in 12% Cr creep resistant steels assisted by computational thermodynamics, Mater. Sci. Eng. A 527 (2010), pp. 5976–5983. doi: 10.1016/j.msea.2010.05.084
- O. Prat, J. García, D. Rojas, J.P. Sanhueza, and C. Camurri, Study of nucleation, growth and coarsening of precipitates in a novel 9%Cr heat resistant steel: Experimental and modeling, Mater. Chem. Phys. 143 (2014), pp. 754–764. doi: 10.1016/j.matchemphys.2013.10.010
- C.A. Schneider, W.S. Rasband, and K.W. Eliceiri, NIH image to ImageJ: 25 years of image analysis, Nat. Methods 9 (2012), pp. 671–675. doi: 10.1038/nmeth.2089
- F.R.N. Nabarro, Z.S. Basinski, and D.B. Holt, The plasticity of pure single crystals, Adv. Phys. 13 (1964), pp. 193–323. doi: 10.1080/00018736400101031
- M. Bonvalet, T. Philippe, X. Sauvage, and D. Blavette, The influence of size on the composition of nano-precipitates in coherent precipitation, Philos. Mag. 94 (2014), pp. 2956–2966. doi: 10.1080/14786435.2014.941029
- K. Yvell, T.M. Grehk, and G. Engberg, Microstructure characterization of 316L deformed at high strain rates using EBSD, Mater. Charact. 122 (2016), pp. 14–21. doi: 10.1016/j.matchar.2016.10.017
- Z. Hou, P. Hedström, Y. Xu, W. Di, and J. Odqvist, Microstructure of martensite in Fe–C–Cr and its implications for modelling of carbide precipitation during tempering, ISIJ Int. 54 (2014), pp. 2649–2656. doi: 10.2355/isijinternational.54.2649
- A. Inoue and T. Masumoto, Carbide reactions (M3C→M7C3→M23C6→M6C) during tempering of rapidly solidified high carbon Cr-W and Cr-Mo steels, Metall. Trans. A 11 (1980), pp. 739–747. doi: 10.1007/BF02661203
- Q. Chen, K. Wu, G. Sterner, and P. Mason, Modeling precipitation kinetics during heat treatment with Calphad-based tools, J. Mater. Eng. Perform 23 (2014), pp. 4193–4196. doi: 10.1007/s11665-014-1255-6
- W. Steven and A.G. Haynes, The temperature of formation of martensite and bainite in low-alloy steels, J. Iron Steel Inst. 183 (1956), pp. 349–359.
- D.P. Koistinen and R.E. Marburger, A general equation prescribing the extent of the austenite-martensite transformation in pure iron-carbon alloys and plain carbon steels, Acta Metall. 7 (1959), pp. 59–60. doi: 10.1016/0001-6160(59)90170-1
- J. Gyhlesten Back. Simplified implementation of the Koistinen-Marburger model for use in finite element simulations, Proceedings of the 11th International Congress on Thermal Stresses, Salerno, Italy, June 5–9, 2016, pp. 107–110.