
 ?Mathematical formulae have been encoded as MathML and are displayed in this HTML version using MathJax in order to improve their display. Uncheck the box to turn MathJax off. This feature requires Javascript. Click on a formula to zoom.
ABSTRACT
The as-deposited microstructure and mechanical properties of the near-β titanium alloy Ti-5Al-5V-5Mo-3Cr (Ti-5553) produced by wire-arc additive manufacture (WAAM) were investigated, to understand its microstructural evolution under WAAM deposition conditions and to establish correlations between the microstructure features formed and the thermal cycles experienced during deposition. The ‘as-deposited’ Ti-5553 WAAM material exhibited higher tensile strengths than other as-deposited additively manufactured Ti-5553 deposits previously reported in the literature, but had significant anisotropy in elongation, as a consequence of the coarse and columnar β-grain structure that formed on solidification, which exhibited a strong cube texture. The multiple reheating cycles, inherent to the WAAM process, were recorded using a novel ‘harpoon’ thermocouple technique, and the α precipitation evolution was related to the thermal history. Electron probe microanalysis chemical maps revealed significant solute microsegregation during solidification, which influenced the subsequent precipitation due to its effect on the local β-phase stability. As each layer experienced more reheating cycles, the microstructure evolution could be ‘time resolved’ and the α laths were found to precipitate in a specific sequence of nucleation sites, starting at the β-grain boundaries and then inter-dendritically, where there was lower matrix β stability. However, after the reheating peak temperature was insufficiently high to have any further effect, the microstructure consisted of a relatively uniform distribution of α laths.
1. Introduction
The alloy Ti-5Al-5Mo-5V-3Cr-0.5Fe (Ti-5553, wt.%) is a modification of the Russian-developed near-β titanium alloy VT-22 and can offer strengths as high as 1300 MPa in thick section aerospace components [Citation1, Citation2]. The use of this alloy has grown substantially during the last 15–20 years, thanks to its outstanding deep-hardenability and its retention of useful levels of ductility and toughness after heat treatment [Citation1, Citation3]. In addition, although significantly more expensive, β-stabilised titanium alloys like Ti-5553 offer other advantages over the more commonly used α-β titanium alloys like Ti-6Al-4V (Ti-64), such as increased high-cycle fatigue properties [Citation1–3]. Ti-5553 is therefore an attractive alloy to investigate for near-net-shape additive manufacturing (AM) applications.
The greater strength of alloys like Ti-5553 arises from the controlled decomposition of the metastable β phase, which in conventional products occurs through solution and aging heat treatments that produce a uniform distribution of fine α-phase lath-morphology precipitates. Due to the greater concentration of β-stabilising elements (V, Mo, Cr), the lower β-transus temperature, and presence of slow diffusing elements like Mo, diffusional phase transformation kinetics in Ti-5553 are slower than in Ti-64, allowing the metastable-β phase to be retained at room temperature with relatively slow cooling rates [Citation1, Citation3–5]. In addition, the metastable-β solid solution can decompose by multiple transformation pathways that are highly dependent on the thermal conditions, including heating rate, cooling rate, and time at temperature [Citation1, Citation3–7]. In AM, in the as-deposited state, a greater level of microsegregation is also expected within the parent β grains in Ti-5553 than in Ti-64, due to the greater deviation of the partition coefficients of the main alloying elements Mo and Cr from unity [Citation8–12]. As a result, the AM microstructures of as-deposited Ti-5553 differ greatly to those of Ti-64 and are highly dependent on the cyclic thermal conditions experienced during a specific AM process, which will have a varied effect on the final microstructure and mechanical properties of the as-deposited material [Citation12–18].
To date, studies of the microstructure of Ti-5553 produced by AM have only focused on higher-energy-density laser and powder based processes (e.g. [Citation12, Citation14]). Some of this work has focused on the processability of Ti-5553, to obtain high density parts, while other studies have focused on metallurgical aspects of the microstructure development under different AM conditions [Citation12–17, Citation19], [Citation20]. The as-deposited solidification microstructure is typically reported to develop with coarse, columnar β-phase grains elongated in the average solidification direction [Citation12, Citation16, Citation18]. Due to the rapid thermal cycles in AM processes, the presence of the α phase, which precipitates below the β transus after solidification, has only been found during certain build conditions. In the powder bed and laser directed energy deposition (DED) processes studied to date, α precipitation has only been seen when higher heat inputs are used, or where a higher build temperature is maintained by heating the base plate [Citation12, Citation14, Citation16]. Thus, it is evident that the heat input, energy density, and thermal cycles experienced during AM play an important role in controlling the as-deposited transformation microstructure of Ti-5553, which strongly influences its mechanical properties.
High-deposition-rate, wire-fed, plasma-arc-based AM has significant advantages for producing larger scale titanium components; however, no studies have been previously published on Ti-5553 (to the authors’ knowledge). We have recently reported on the microstructure transition seen between Ti-5553 and Ti-64 in alloy-alloy composite WAAM deposits [Citation18], but the effect on the evolution of the transformation microstructure in a near-β alloy has not yet been fully characterised. It is therefore important to explore the phase transformation behaviour in this alloy during an additive process that involves a more diffuse heat source, relatively larger melt pool and significantly lower cooling rates (<100°C/s) [Citation12, Citation14, Citation17, Citation21–27]. In addition, there is currently only very limited information available in the literature on the interaction between Ti-5553 and arc heat sources in the context of arc welding [Citation28].
The present study therefore seeks to improve understanding of the as-deposited microstructural evolution of Ti-5553 during the complex, but slower, cyclic heating and cooling rate thermal history of a typical high-deposition-rate AM process, capable of building large aerospace components. In this paper, in-depth multiscale microstructure characterisation has been performed, using a range of techniques, including optical microscopy, electron backscatter diffraction (EBSD), transmission Kikuchi diffraction (TKD) and electron probe microanalysis (EPMA), to fully understand both the effects of the solidification microstructure and subsequent thermal cycling on the α precipitation behaviour in a wire and plasma arc AM process. In addition, the full temperature cycle during deposition was recorded, using a novel ‘harpoon’ technique, so that correlations could be established between the microstructure development and thermal history.
2. Materials and methods
2.1 Sample manufacture
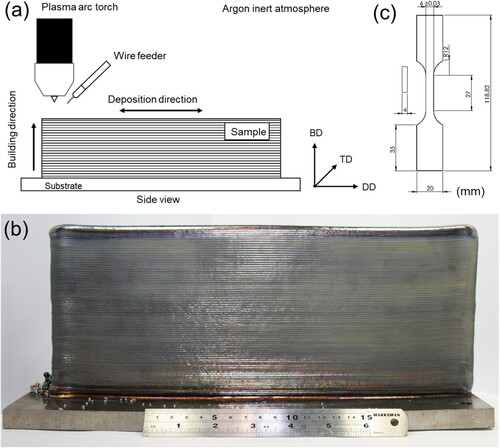
A single-track-wide linear wall was deposited using a plasma transferred arc (PTA) welding power source attached to a 6-axis industrial robot. In order to provide an inert atmosphere to avoid oxidation, deposition was performed inside a flexible shielding tent filled with argon. An oxygen concentration level of approximately 800 ppm was maintained during deposition and monitored by an oxygen analyser. The sample was built using an average current of 160 amps, travel speed of 5 mm/sec, and wire feed speed of 1.8 m/min. The torch stand-off distance was 8 mm, with an argon plasma gas flow rate equal to 0.8 l/min, and a shielding gas flow rate of 15 l/min. The composition (wt.%) of the Ti-5553 1.2 mm diameter wire used was Al 5.0%, V 4.92%, Mo 4.86%, Cr 2.89%, Fe 0.43%, O 0.129%, C 0.007% and N 0.002% with a balance of Ti. The manufactured wall had final dimensions of approximately 9 × 130 × 310 mm and was deposited on an 11 mm-thick Ti-64 substrate. During deposition, the heat source travel direction was alternated (backwards and forwards) every layer. A schematic diagram of the deposition process and an image of the built wall are presented in .
Figure 1. (a) Schematic representation of the experimental setup (the reference system is defined as: building direction (BD), transverse direction (TD), and deposition direction (DD)); (b) the manufactured sample, and (c) geometry and dimensions of the uniaxial tensile specimen used.
2.2 Thermal cycle measurement
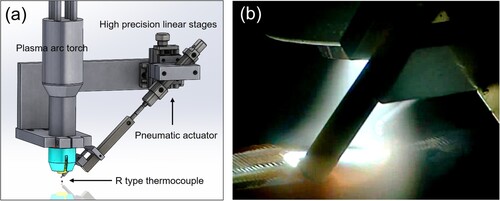
The thermal history of the upper section of the deposit was measured, in order to correlate it with the microstructural evolution during deposition, using a novel, in-house developed thermocouple ‘harpooning device’. This device enabled a type-R thermocouple to be automatically plunged into the centre of the melt pool with precise positioning during deposition. To the authors’ knowledge, this is the first time this type of device and experimental approach have been used to acquire thermal data during WAAM processing of a titanium alloy. A schematic of the device used, and a still image of the inserted thermocouple, can be seen in . The harpooning action of inserting the thermocouple into the melt pool was achieved by using a linear pneumatic actuator attached to a set of high precision linear stages that allowed accurate adjustments of the thermocouple position. At the same time, a solenoid type valve was interfaced with the robot motion system, which allowed insertion of the thermocouple in the exact desired location. After insertion at the central line of a melt track, the thermocouple solidified in place. This enabled accurate measurement of the thermal cycles experienced at the selected location during the deposition of subsequent layers. The data was recorded using LabVIEW with a data acquisition rate of 10 Hz.
Figure 2. (a) Schematic of the harpooning device used in this work. (b) Still image showing R-type thermocouple inserted into the melt pool using the harpooning device.
2.3 Mechanical testing
Tensile tests were performed under the guidelines of the BS EN 2002-1:2005 standard [Citation29] using an Instron 5500R electromechanical test frame, equipped with a load cell of 100 kN and an extension rate of 0.2 mm/min. Tensile coupons were machined out of the WAAM manufactured sample with the test direction both in the vertical build direction (BD) and horizontally, parallel to the wall (DD). Five samples from each orientation were tested and the proof stress, ultimate tensile strength, and elongation to failure were averaged, with errors given as one standard deviation. The sample extension was measured with a laser extensometer. The geometry of the tensile coupon used is indicated in (c).
Vickers hardness maps were acquired automatically across the centre of the BD-TD plane with a Struers Durascan 80 hardness tester, using an array of indents with a 0.4 mm pitch, with an applied load of 0.1 kg and a 10 s dwell time. The hardness vs build height profile was produced from the array data by averaging the points in the sample transverse direction (TD) and given 95% confidence intervals.
2.4 Microstructural characterisation
A transverse direction (TD) section of the top 24 mm of the wall was extracted for microstructural characterisation, representing the last ∼20 layers deposited. Metallographic preparation of the sample was carried out using the procedure outlined by Voort [Citation30] and etched with Kroll’s reagent. Optical microscopy was performed using a Zeiss Axio Imager 2, with automated stage scanning to produce a large-scale, high-resolution, stitched macrograph.
Scanning electron microscopy (SEM) imaging and EBSD orientation maps were obtained on unetched, polished samples using a TESCAN Mira3 field emission gun (FEG) SEM, equipped with an Oxford Instruments’ Symmetry EBSD detector and AZtec acquisition software, with an accelerating voltage and beam current of 20 kV and 48 nA, respectively, and a 10 µm step size. EBSD data was processed using Oxford Instruments’ AZtecCrystal software and maps are displayed throughout with inverse pole figure (IPF) colouring (reference direction BD), with low (>5°) and high angle grain boundaries (>15°) highlighted in white and black, respectively. Contoured pole figures were also produced and scaled in multiples of random density (MRD).
For the higher resolution TKD analysis, a 3 mm diameter sample was punched from a ∼110 µm foil and electropolished at a voltage of 17 V in a 5% perchloric acid and methanol electrolyte at −40°C. TKD was carried out on an FEI Magellan 400L FEG-SEM, using an accelerating voltage of 30 kV, with the sample tilted to a 20° angle away from horizontal, at a working distance of 2 mm.
A JEOL JXA-8530F FEG-EPMA was used to map the chemical segregation throughout the WAAM build. EPMA uses wavelength dispersive spectrometry (WDS), which has a higher X-ray spectrum resolution than conventional energy dispersive spectrometry (EDS) (∼5 eV compared to ∼129 eV, respectively), and so WDS can resolve the X-ray emission peak overlaps between Ti, V, and Cr [Citation31]. Large-area multifield maps were obtained using an accelerating voltage of 15 kV, a current of 100 nA, and a 1 and 5 µm step size was used for the small and large-area maps, respectively. The wavelength dispersive spectrometers were equipped with TAP (Al Kα emission), PETL (Mo Lα), and LIFL (Fe Kα, Cr Kα, and V Kβ) diffraction crystal. Probe for EPMA software was used to quantify elemental maps, with pure elements used for standardisation, Ti determined by difference, and background subtraction via the mean atomic number method [Citation32].
3. Results
3.1 Overview
Representative tensile test results from the Ti-5553 WAAM samples, machined from the steady-state region of the deposit, are shown in . Average values for the coupons tested in each orientation (BD and WD) are also summarised in , along with other results reported in the literature for AM processes and a baseline comparison to conventional wrought products. The as-built proof stresses of the test samples were in the range of 1040–1070 MPa, which is comparable to the lower end of that reported for fully heat treated wrought Ti-5553 materials when in a standard solution-treated and aged condition [Citation2]. However, the as-deposited proof stresses of the WAAM samples surpassed those reported for Ti-5553 AM builds produced by laser-based processes by ∼30%, while still maintaining comparable elongation to failure (see ). At 21%, the average elongation to failure in the build direction of the Ti-5553 WAAM samples was also high for this strength level, but it was 2.5 times lower in DD (∼8%). In addition, in BD, the stress–strain curves showed limited strain hardening and the elongation mainly occurred in a diffuse neck; whereas in DD, strain hardening was evident, but the samples failed abruptly without significant necking.
Figure 3. Typical strain-stress curves measured in the deposition (DD) and building direction (BD) orientations.
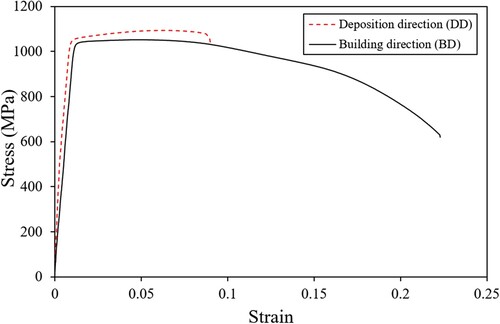
Table 1. Summary of the tensile test results for coupons extracted parallel to the build (BD) and deposition direction (DD). PS: 0.2% proof strength; and UTS: ultimate tensile strength. Tensile properties of various Ti-5553 AM deposits (both powder bed and DED) and wrought forged components are included for comparison.
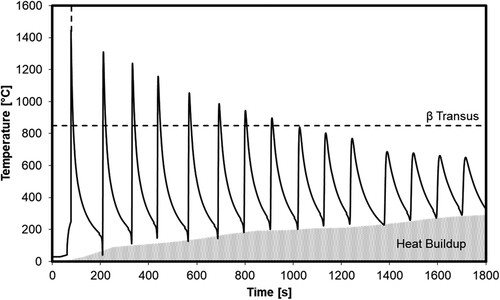
Given that Ti-5553 is conventionally solution heat-treated and aged to obtain its optimum mechanical properties, the thermal history of the Ti-5553 WAAM test builds were recorded to better understand the conditions that gave rise to α precipitation during deposition. The thermal history recorded during deposition, measured by the harpoon method, is presented in . This starts from the point where the type R thermocouple was inserted into the melt pool and shows the thermal cycles caused by subsequent deposition of 15 added layers. It can be seen that the peak temperature recorded of ∼1450°C, when the thermocouple was first inserted, is near the maximum detectable temperature of a type R thermocouple, so the first temperature peak in the melt pool was not correctly recorded. During the subsequent heating cycles, where the thermocouple was embedded in the solid material, the peak temperature decreased in each cycle, passed through the β transus after 9 layers (∼850°C [Citation34, Citation35]), then fell to ∼650°C by the addition of layer 15. The build-up in the minimum temperature can also be noted in as more layers were added.
Figure 4. Measured thermal history during WAAM deposition.
An overview optical macrograph of the Ti-5553 WAAM build, cross sectioned in the BD-TD plane, is shown in to demonstrate the impact of this cyclic thermal history on the microstructure. This figure shows the upper 24 layers deposited in the sample and the microstructure evolution throughout, from solidification of the last (top) layer through the subsequent thermal cycles experienced by previously deposited layers as new layers were added, until the temperature fell sufficiently such that no further changes occurred. The dark curved lines labelled in the lighter etched top section are caused by a thin fusion boundary segregation band [Citation22] and can be used to identify each individual layer. Interdendritic microsegregation and the coarse, columnar β grains are also more apparent in the top, lighter etched, part of the sample, with the microsegregation most apparent near the top surface. The analysis presented hereafter focuses on this top region of the as-built sample where the final microstructure evolves and the regions relating to the higher resolution figures shown below are indicated in . also shows a strong etching contrast change between the top and bottom regions of the build, separated by a heterogeneous transition region, which occurred due to precipitation of the α phase. By correlation between the thermal history and the optical image layers, it can be seen that the α phase only starts to precipitate in cycle 12 when the peak temperature at the thermocouple position was <700°C, but it should be noted that the peak temperature gradient within a single deposited layer during reheating is significant. This confirms that the α phase precipitates predominantly during subsequent reheating high in the sub-transus region, rather than during cooling in the last cycle from above the β transus (layer 9); i.e. because the β phase is more stable than in alloys like Ti-64, and Ti-5553 is not particularly quench sensitive, it does not transform on cooling through the β transus.
Figure 5. Overview optical macrograph of the etched Ti-5553 sample in a transverse (BD-TD) cross section, showing the areas examined in .
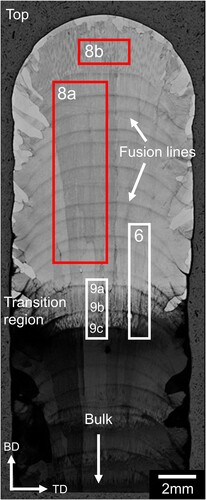
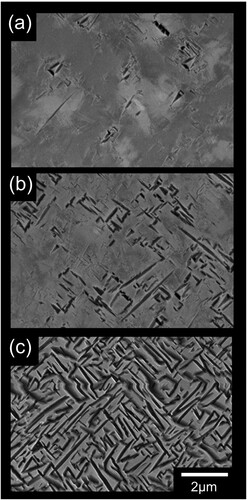
Higher magnification optical micrographs of the β-annealed top layers, the transition region where the α begins to nucleate, and the microstructure in the bottom steady-state section are presented in , to show the different regions of α precipitation in more detail. In the dark etched region at the bottom of the sample ((f)), although the α precipitates are too fine to be resolved by optical microscopy, the micrograph appears homogeneous. In contrast, α, as evidenced by regions of darker contrast, is seen to first develop heterogeneously within the transition region, with the images suggesting a preference for earlier α precipitation at the β-grain boundaries ((b–c)) as well as within the interdendritic regions ((d)).
Figure 6. Higher magnification optical images showing the evolution of the microstructure across the transition zone between the top metastable-β region and dark etched bottom section with α precipitation seen in . The left micrograph indicates the image locations (area indicated in ) shown in (a) – (f).
3.2 Solidification microstructure
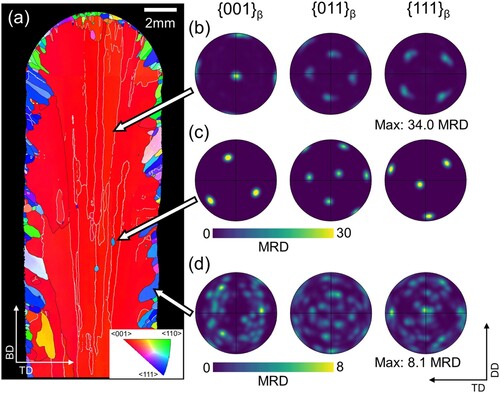
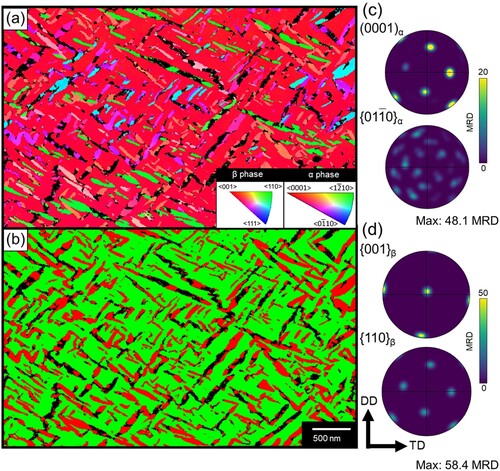
EBSD and EPMA maps were used to reveal the nature of the primary β-grain structure and the extent of microsegregation that developed during solidification. A β-phase EBSD orientation map of the upper section of the sample is shown in (a) where it is evident that the core of the deposited wall contained coarse, columnar β grains that are strongly textured. The grains have strong alignment of their directions nearly parallel to BD and TD; such that they exhibit an intense
cube texture ((b)). The grains that do exist within the sample interior are also mainly separated by low angle grain boundaries (white lines) of misorientations <15°– i.e. the core of the deposit can be thought of as being close to a
cube orientated single β-Ti crystal, containing subgrains with a small spread of orientations around BD. However, the wall’s outer surface layer exhibited a skin of differently orientated smaller columnar grains [Citation18], and their microtexture can be seen in (d). These grains appear to have reorientated to grow closer to normal to the solidification front where they experience a severe curvature towards the build edges, which can be seen from the profile of the fusion boundary segregation bands in . These smaller surface grains are also elongated and tend to have their
directions aligned closer to ∼45° to BD. A few small, equiaxed grains with non-
orientations can further be seen within the wall’s coarse and columnar core grain structure. These grains did not grow greatly after formation and were engulfed by the dominant
orientated columnar β grains during solidification. An example of one of these grain’s associated orientations can be found in (c).
Figure 7. The β-grain structure and texture formed on solidification: (a) EBSD inverse pole figure orientation map; and pole figures show (b) the columnar grain cube texture in the core, (c) an isolated non-cube grain orientation in the core of the deposit, and (d) the microtexture of the surface skin layer of smaller grains.
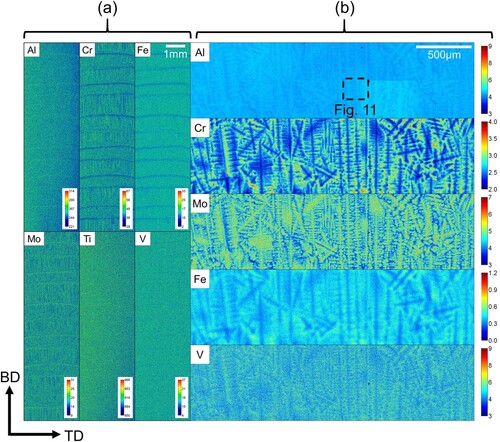
The extent of solute segregation during solidification can be seen in the EPMA composition map obtained from the upper-sample section in . A 5 µm step size was used in the overview map in (a), and a higher resolution 1 µm step size map ((b)) was acquired from the last layer deposited to better resolve the interdendritic segregation. The strongest interdentritic microsegregation evident in (a–b) is for Cr and Fe, which have partition coefficients of k = 0.81 and 0.38-0.79, respectively [Citation8, Citation10, Citation11]. Strong inverse segregation to the dendrite cores is also noted for Mo (k = 2.0) [Citation9, Citation36]. In comparison, Al and V have partition coefficients close to unity [Citation10, Citation11, Citation37] and are relatively neutral in terms of their microsegregation; although there is evidence of slight inverse segregation of Al. In (a), Cr and Fe can also be seen to have segregated away from the thin horizontal fusion boundary lines ((a)) that are observed in the etched optical macrograph in and are enriched in Mo.
Figure 8. Microsegregation in the Ti-5553 deposit revealed by EPMA compositional maps: (a) large step size overviews; (b) higher magnification of the last deposited layer.
Note: (a) shows photon count maps where (b) shows quantified elements in wt.%.
3.3 Transformation microstructure
Higher magnification SEM images of the transition region, and the fully developed transformation microstructure found below layer 15, are shown in . At this magnification, the coarser α-phase precipitation can be resolved and there is a gradual increase in the volume fraction of α laths down the wall through the transition region ((a–b)), until precipitation stagnates and the microstructure stabilises as the temperature and supersaturation falls with depth. It can be seen that the stable bulk ‘as-deposited’ microstructure contains a high volume fraction of ∼50-150 nm-thick α laths that are relatively homogeneously distributed in the β-phase matrix ((c)). However, when α first precipitates, it is heterogeneously distributed in clusters with finer laths than those developing in the matrix as the material experiences further lower peak temperature heating cycles.
Figure 9. Backscatter electron SEM micrographs moving down through the transition region as the α volume fraction increases: (a) (b) (c) taken at the marked locations in .
TKD using an electron transparent foil was employed to index the α precipitates, which were too small to be characterised by conventional EBSD. The TKD orientation map acquired for the fully transformed ‘as-deposited’ microstructure region is shown in , along with the α and β-phase map and the phase pole figures. In this map area the β-phase matrix consisted of a single // BD orientation grain. The α laths did not index well in some areas (coloured black), which is partly a consequence of lattice distortion in the foil caused by relief of the stress induced by the β → α phase transformation. If these unindexed points are assumed to also represent the α phase (which is likely given the location and morphology of the unindexed areas), its area fraction was determined to be ∼44%. In the accompanying pole figures, the α laths can be observed to have adopted all 12 orientations possible via the Burgers orientation relationship, which causes a significant dilution of the α texture relative to that of the β phase, and is approximately representative of the near single β Ti crystal bulk. However, in b – in the
pole figure in particular – some variant selection can also be inferred from the observation that some
poles having stronger intensities than others. However, without sampling multiple β grains, the effect this has on the overall bulk α texture cannot be commented upon.
Figure 10. TKD maps of the fully developed ‘as-deposited’ α precipitate microstructure: (a) inverse pole figure crystal orientations, (b) phase distributions (red = α phase and green = β phase), and (c) and (d) pole figures for the α and β phase. Black pixels are unindexed points.
4. Discussion
4.1 Mechanical performance
Following deposition of the Ti-5553 alloy by the WAAM process using ‘standard’ build conditions, a higher proof strength was obtained compared to that reported for other as-deposited AM samples produced by higher power density processes, like laser DED and powder bed [Citation15, Citation17]. The as-deposited material also had strength levels comparable with the lower end of the range possible for fully heat-treated Ti-5553 forged products [Citation2]. Overall, this indicates that WAAM deposition naturally produced an α-precipitate microstructure in the ‘as-deposited’ state that was more similar to that found in a conventional fully heat-treated wrought component than reported for other AM processes. This high level of α precipitation generated during deposition occurred in response to the thermal cycling induced by the translated heat source, even though no attempt was made to optimise the deposition parameters to control the α microstructure, as would be normally required with a conventional wrought product.
The WAAM samples also displayed little yield stress anisotropy when measured in the orthogonal build (BD) and deposition directions (DD, ), despite the material’s strong texture ( and ) [Citation38–40]. However, the Ti-5553 WAAM test build solidified with a very strong cube texture ( and ), where two
directions are aligned parallel to both BD and DD. In addition, the α transformation microstructure formed with all 12 possible orientations determined by the BOR (), which would lead to a similar Taylor factor in each loading direction [Citation41]; so, if only the effect of texture is considered, both the BD and DD tensile test directions will be similar due to cube symmetry. The tensile tests did, however, display significant anisotropy in their elongation (as have other Ti-5553 AM samples [Citation15]) where the build direction exhibited less than half the ductility of the DD samples. Anisotropy in tensile ductility is regularly reported for Ti-64 WAAM components [Citation38–40], and has been attributed to a heterogeneous distribution of ‘hard’ and ‘soft’ microtexture regions present in the α transformation microstructure, associated with the coarse, columnar parent β-grain structure, which causes severe shear concentration at the β-grain boundaries during transverse loading [Citation42]. The fracture behaviour of the current Ti-5553 WAAM samples was not investigated, but given the preferential nucleation of α on the β-grain boundaries (e.g. (b–c)), and the presence of large, columnar β-grains present in the tensile test samples (), the low elongation to failure in DD is similarly probably a consequence of shear concentration in the region of the aligned columnar β-grain boundaries.
4.2 Solidification microstructure
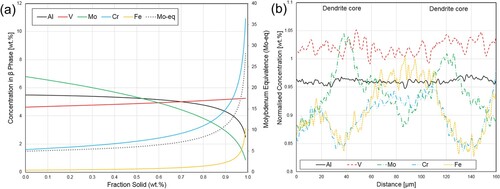
Coarse and columnar β-grain structures that exhibit strong fibre textures are commonly observed in titanium alloys produced by WAAM, particularly in Ti-64 components [Citation18, Citation42–44]. This grain structure is a consequence of the positive thermal gradient in the liquid at a solidification front in a heated melt pool, combined with both a lack of nucleation sites in the melt pool and low solute partitioning, which during solidification leads to low constitutional supercooling. The primary β-phase solidification behaviour is consequently dominated by epitaxial growth from the fusion boundary without significant nucleation ahead of the solidification front [Citation45–47]. As Ti-5553 contains alloying elements that produce greater solute partitioning during solidification than Ti-64 (Mo, k = 2.0; Cr, k = 0.81; Fe, k = 0.38-0.79 [Citation8–11, Citation36]), the coarse and columnar solidification structure seen in and was not a foregone conclusion. Schiel-Gulliver solidification calculations produced with the JMatPro thermodynamic modelling software [Citation48] in (a) also highlight the microsegregation trends in Ti-5553. This plot shows the predicted segregation of Cr and Fe and the inverse segregation of Mo across a dendrite, which will result in local variation in the β-phase stability across the solidified microstructure. In addition, an EPMA line scan across two prior dendrite cores from near the top of the Ti-5553 wall has been included in (b) (the line scan area is indicated in (b)). In general, the trends match the modelling results; i.e. Mo partitioning is observed towards the dendrite cores and Cr and Fe to the interdendritic regions, with minimal segregation of Al and V to the core and dendrite boundaries, respectively.
Figure 11. Microsegregation across a dendrite: (a) predicted by JMatPro Scheil solidification calculations for Ti-5553 compared to (b) smoothed EPMA line scan data in TD from the region highlighted in b, averaged in BD, across two dendrite cores in the top of the Ti-5553 WAAM wall. The molybdenum equivalence (Mo-eq) has also been calculated from the Scheil solidification data and added to (a) to show the variance in β-phase stability.
The EPMA maps further confirmed the presence of a solute segregation band at the fusion boundary for each melt track ((a)), which were identified in the optical macrographs in from the etching contrast. These fusion boundary etch lines have previously been attributed to the transient partitioning of solute that develops due to the melting back and acceleration of the solidification front that occurs at the edge of the melt pool as the heat source is translated [Citation22]. This results in fusion-boundary bands rich in Mo, but lean in Cr and Fe, which can be conveniently used to identify the convex melt pool depth profile seen in the BD-TD sections in .
Even though more significant solute segregation was found in the Ti-5553 WAAM samples compared to in Ti-64 [Citation22], the β-grain structure still exhibited coarse, columnar grains () as well as a strong texture. The additional constitutional cooling possible in Ti-5553 due to its different alloy constitution was therefore still insufficient to promote nucleation ahead of the solidification front, with the standard WAAM process conditions employed. Nevertheless, the presence of a surface skin of finer grains (), which is not normally seen with a Ti-64 alloy using the same processing parameters (e.g. [Citation18]), is indicative of a higher degree of constitutional supercooling with Ti-5553. This change in surface grain structure requires further investigation, but is related to the curvature of the solidification front seen in the transverse sections that would require dendrites with a
// BD orientated grain to grow at ∼45° to BD to follow the thermal gradient close to the wall surfaces (). Greater solute partitioning resulting in a wider mushy zone (semisolid region) would thus give more opportunity for dendrites to reorientate closer to their preferred crystallographic growth direction, with respect to the solidification front, by dendrite fragmentation or other mechanisms [Citation49]. Some small discrete equiaxed β grains were also observed to be present in the core of the wall that were engulfed by the more favourably
// BD orientated columnar grains (). These findings thus show greater potential for the Ti-5553 alloy, compared to Ti-64, for forming a more equiaxed grain structure by modifying the thermal conditions in the WAAM deposition process (for example, by increasing the wire feed speed to lower the G/R ratio [Citation50]).
4.3 α-Phase precipitation
During conventional solution heat treatment of Ti-5553, cooling rates from above the β transus faster than 0.1°C/s prevent precipitation of the α phase [Citation34]. The subsequent decomposition of the metastable-β phase during sub-transus ageing treatments is complex and can occur through multiple pathways, which include the formation of the athermal ω phase by a diffusionless transformation, spinodal decomposition, and the development of ordered and disordered forms of and
[Citation6, Citation7, Citation51–53], all of which are transition states that can affect the subsequent nucleation of the α phase during aging heat treatments. The solvus temperatures of these metastable precursor phases are relatively low (<400°C) and to form they generally require far longer heat treatments and lower heating rates than are experienced during a typical WAAM thermal history. However, more recent publications have also claimed, based on evidence from step-quenching experiments, that a pseudo-spinodal mechanism may allow the α phase to nucleate directly from β, at higher temperatures during short isothermal aging times (<15 minutes), in the temperature range of 600-700°C [Citation6], which coincide with the nose of the α time-temperature-transformation curve [Citation34]. This proposed mechanism has been reported to generate both a high density and homogeneous distribution of α-lath precipitates, without the requirement for heterogeneous nucleation sites, such as dislocations or metastable precursor precipitates like the ω phase [Citation6, Citation51].
In the WAAM process, after solidification, a dynamic local volume of material is reheated multiple times with a diminishing peak temperature rise as the heat source travels across the surface when each new layer is added (). For the experimental conditions used in this work, the measured cooling rate during the first WAAM heating cycle was around 60°C/s (), higher than that required to prevent α formation during cooling in Ti-5553 [Citation34, Citation54]. The regions of the build that are reheated in excess of the β transus temperature, but are located high enough in the build that they are not further reheated below the β transus, would, therefore, be expected to remain as a metastable-β phase on cooling to room temperature. Consequently, no α precipitates were observed in the top 9 layers of the build. This behaviour would then persist to a depth where the peak temperature reached on reheating, caused by the thermal field of the translated heat source, became lower than the β-transus temperature, but where the temperature rise was still sufficient for the α transformation kinetics to allow precipitation in a short enough time; i.e. the accumulative time spent above 600°C in cycles 9–11 is typically less than 100 s ().
This precipitation evolution throughout the build can be tracked using Vickers hardness mapping, and a map of the top 24 layers of the build and a line profile across them have been provided in . In the top β-annealed section of the wall, where there is no α precipitation, the hardness is at a minimum of ∼320 HV (0-14 mm below the top surface of the build, (b)). As the α begins to precipitate in the transition region (∼14-20 mm in (b)), the hardness begins to increase, until reaching an average peak hardness of ∼500 HV in the dark-etched lower section of the build (>22 mm), which is representative of the bulk. When compared to other Ti-5553 deposits in the literature, the WAAM bulk ‘as-deposited’ hardness is higher than other as-deposited AM builds and their aged counterparts (e.g. [Citation4, Citation27]). This provides further credence that the WAAM thermal history intrinsically produces highly efficient α precipitation that results in a high density of fine α laths.
Figure 12. Microhardness distribution of the upper Ti-5553 WAAM sample section, showing: (a) a hardness map superimposed on an optical image and (b) a hardness-line profile produced from the hardness map using values averaged across 13 measurements in TD.
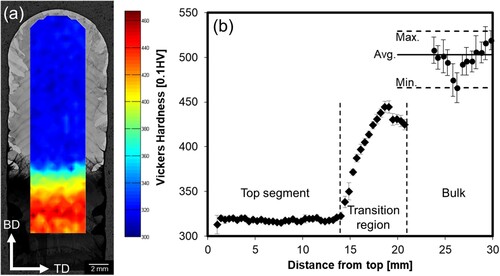
From the ‘harpoon’ thermal measurements, it can be seen that the homogenised alloy’s β transus temperature of 850 °C would be expected to equate to about the top 8–9 layers, although the transition region where the hardness started to increase () and α precipitation was first seen occurred below approximately layer 12, where the measured peak temperature rise had fallen to <700°C (or ∼150°C below the β transus). By the ∼15th layer, where the α-lath volume fraction stabilised (), and the hardness then reached a maximum level (), the peak temperature was measured to have dropped further to ∼650°C. However, it should be noted that the harpoon method only measures the temperature history at a single location, and due to the thermal gradient under the heat source, it is not possible to extract the exact temperature rise at which α precipitation initiates. In addition, the microsegregation noted above will affect the stability of the β phase and the local transus temperature. The main α-phase stabilising element Al (k = ∼1 [Citation11, Citation37]) marginally segregated inversely ((b)), in a similar direction to Mo; however, the amount of segregation was minimal compared to Mo [Citation8, Citation9], which is a strong β-phase stabilising element in Ti [Citation1, Citation3]. The other β-stabilising elements, Cr and Fe, became concentrated in the interdendritic regions [Citation10, Citation11]. An approximate calculation from the solidification simulation data in (a), using the Mo-equivalence index (Mo-eq) in ref. [Citation1], shows the overall effect this would have on the relative change in β-phase stability. The Mo-eq can be seen to gradually increase towards 0.7 fraction solid, but then rapidly increases in the final 10% of solidification, following the trends of Cr and Fe segregation towards the interdendritic regions. However, this simulation represents the maximum possible influence of segregation on the parent β-phase stability, as back diffusion and repeated reheating above the β transus will tend to reduce solute gradients after solidification. For example, there is some evidence of the Fe distribution, which has a high diffusivity in β [Citation3], homogenising with depth in the build.
As a consequence of the solute segregation pattern after solidification, after the 12th heating cycle, α can be seen in the optical micrograph of the Ti-5553 WAAM deposit shown in to begin to first nucleate heterogeneously within the β grains and at the β-grain boundaries ((b–c)), which are sites favoured for α nucleation at low undercoolings [Citation55, Citation56]. Earlier nucleation of coarser α laths was also seen within the β grains ((d)) with a distribution similar to the dendritic segregation pattern that occurred during solidification. In the following heating cycles, as the peak temperature falls and the undercooling increases, precipitation of finer α laths can be seen to expand within the remaining β matrix until after the 15th heating cycle, where the microstructure had been reheated multiple times and the peak temperature had dropped to ∼650°C, and they cover entire β grains. This suggests that these finer homogeneously distributed laths are nucleated during a heating cycle that hits a narrow range corresponding to the ‘nose’ of the nucleation curve, which is known to lie between 600-800°C [Citation34]. However, the fact that they precipitate within such a short accumulative time at temperature and with a very rapid heating rate suggests their nucleation pathway is consistent with the pseudo-spinodal mechanism proposed by Nag et al. [Citation6, Citation57], whereby a fine-scale microstructure can be produced in a short time without any apparent prior heterogeneous nucleation sites in the β matrix. However, an independent study utilising controlled rapid heating experiments, with comparison to the results in refs. [Citation6, Citation57], would be required to verify this precipitation sequence.
Overall, the finer and homogeneously distributed α laths seen within the less β-stabilised regions form the majority of the final transformation microstructure (e.g. ) and are similar to those found in a classically solution treated and aged Ti-5553 microstructure [Citation3, Citation4, Citation33, Citation58, Citation59]. Their high coverage of the parent β grains, combined with the high volume fraction estimated for the α-phase precipitates from , is consistent with the comparable proof stress levels measured in the tensile tests. However, fortunately, for Ti-5553 WAAM components, due to their low quench sensitivity, it would also be viable to conduct post-build β-solutionising and conventional aging heat treatments to precipitate a tailored α microstructure even more homogeneously, throughout an entire part, to optimise the mechanical properties for a target application [Citation2, Citation15, Citation27, Citation33].
5. Conclusions
The microstructural evolution during WAAM processing of the near-β alloy Ti-5553 has been investigated for the first time. Correlation to the solidification microstructure that creates the parent metastable β phase prior to the precipitation of α, and the complex cyclic temperature history in the WAAM process, has revealed the following main conclusions:
The tensile strength of the ‘as-deposited’ WAAM Ti-5553 build was superior to that reported for other higher energy density AM processes, due to the high density of α precipitation produced by cyclical heating when using a more diffuse plasma-arc heat source.
β-phase EBSD orientation maps showed that, with the deposition conditions investigated, the WAAM Ti-5553 build developed a coarse and columnar β-grain structure, with a strong
texture, which resulted in anisotropic elongation during tensile testing.
The greater solute partitioning seen in the Ti-5553 alloy, compared to in Ti-64, was still not able to promote an equiaxed β-grain structure in the bulk of the sample under standard WAAM conditions. However, it was found that, where the curvature of the solidification front caused a large deviation from the preferred
EPMA chemical maps revealed that significant solute microsegregation occurred during solidification, with Mo and Al partitioning to the dendrite cores, and Cr, V, and Fe to the dendrite boundaries. Repeated thermal cycling during deposition did not remove this solute segregation completely.
Due to the low quench sensitivity of Ti-5553, α precipitation did not occur on cooling through the β transus, but a high density of α laths were found to start to precipitate during reheating in subsequent thermal cycles when the peak temperature fell below ∼700°C. This initiated heterogeneously with α precipitating first in interdendritic regions and at β-grain boundaries, where the lower local Mo concentration reduced the stability of the parent solid solution. A high density of finer laths was then observed to form uniformly within the remaining matrix as the peak temperature reduced, and precipitation was complete when the peak temperature in subsequent reheating cycles fell below 600°C. The relatively short time available for nucleation and homogeneous distribution of the precipitates suggests this may have occurred by the ‘pseudo-spinodal’ mechanism proposed in refs. [Citation6, Citation57].
The high density of α precipitation during the WAAM process produced a material strength comparable to the lower end of the range reported for fully heat-treated wrought Ti-5553 products. However, it should be emphasised that controlled post-build heat treatments can also be readily applied to WAAM deposits to similarly optimise their properties.
Disclosure statement
No potential conflict of interest was reported by the author(s).
Acknowledgements
The authors are appreciative of the EPSRC programme grants NEWAM (EP/R027218/1) and LightForm (EP/R001715/1) for supporting aspects of this research, and acknowledge the use of equipment associated with the Advanced Metals Processing and Characterisation themes of the Henry Royce Institute for Advanced Materials, funded through EPSRC grants EP/R00661X/1, EP/S019367/1, EP/P025021/1 and EP/P025498/1. P.B. Prangnell is grateful to the Royal Academy of Engineering, UK, and Airbus for supporting his research through the Airbus-University of Manchester Centre for Metallurgical Excellence.
Additional information
Funding
References
- J.D. Cotton, R.D. Briggs, R.R. Boyer, S. Tamirisakandala, P. Russo, N. Shchetnikov and J.C. Fanning, State of the Art in beta titanium alloys for airframe applications. Jom 67(6) (2015), pp. 1281–1303.
- J. C. Fanning, “Properties of TIMETAL 555 (Ti-5Al-5Mo-5V-3Cr-0.6Fe),” J. Mater. Eng. Perform., vol. 14, no. 6, pp. 788–791, 2005.
- G. Lütjering and J.C. Williams, Titanium, Springer, 2007.
- D. Sharma, S.R. Kada, D. Fabijanic, D. Parfitt, B. Chen, B. Roebuck, M.E. Fitzpatrick, M.R. Barnett, “The ageing response of direct laser deposited metastable β-Ti alloy, Ti–5Al–5Mo–5V–3Cr,” Addit. Manuf., vol. 48, no. September, p. 102384, 2021.
- P. Barriobero-Vila, G. Requena, S. Schwarz, F. Warchomicka, and T. Buslaps, “Influence of phase transformation kinetics on the formation of α in a β-quenched Ti-5Al-5Mo-5V-3Cr-1Zr alloy,” Acta Mater., vol. 95, pp. 90–101, 2015.
- S. Nag et al., “Non-classical homogeneous precipitation mediated by compositional fluctuations in titanium alloys,” Acta Mater., vol. 60, no. 18, pp. 6247–6256, 2012.
- N. G. Jones, R. J. Dashwood, M. Jackson, and D. Dye, “Β phase decomposition in Ti-5Al-5Mo-5V-3Cr,” Acta Mater., vol. 57, no. 13, pp. 3830–3839, 2009.
- M. J. Bermingham, S. D. McDonald, M. S. Dargusch, and D. H. St.John, “Grain-refinement mechanisms in titanium alloys,” J. Mater. Res., vol. 23, no. 1, pp. 97–104, 2008.
- T. Lyman, Atlas of Microstructures of Industrial Alloys, American Society for Metals, 1972.
- H. Okamoto and H. Okamoto, Phase Diagrams for Binary Alloys, ASM international Materials Park, OH, 2000.
- M. J. Bermingham, S. D. McDonald, D. H. StJohn, and M. S. Dargusch, “Beryllium as a grain refiner in titanium alloys,” J. Alloys Compd., vol. 481, no. 1–2, pp. L20–L23, 2009.
- C. Hicks, T. Konkova, and P. Blackwell, “Influence of laser power and powder feed rate on the microstructure evolution of laser metal deposited Ti-5553 on forged substrates,” Mater. Charact., vol. 170, no. February, p. 110675, 2020.
- M. Ansari, A. Martinez-Marchese, Y. Huang and E. Toyserkani, A mathematical model of laser directed energy deposition for process mapping and geometry prediction of Ti-5553 single-tracks. Materialia 12(April) (2020), pp. 100710.
- S. Bakhshivash, H. Asgari, P. Russo, C.F. Dibia, M. Ansari, A.P. Gerlich and E. Toyserkani, Printability and microstructural evolution of Ti-5553 alloy fabricated by modulated laser powder bed fusion. Int. J. Adv. Manuf. Technol 103(9–12) (2019), pp. 4399–4409.
- C. Hicks, G. Sivaswamy, T. Konkova and P. Blackwell, Anisotropic tensile properties and failure mechanism of laser metal deposited Ti–5Al–5Mo–5V–3Cr alloy before and after sub-transus heat-treatment. Mater. Sci. Eng. A 825(February) (2021), pp. 141928.
- H. Schwab, M. Bönisch, L. Giebeler, T. Gustmann, J. Eckert, and U. Kühn, “Processing of Ti-5553 with improved mechanical properties via an in-situ heat treatment combining selective laser melting and substrate plate heating Mater. Des., vol. 130, no. May, pp. 83–89, 2017.
- H. Schwab, F. Palm, U. Kühn, and J. Eckert, “Microstructure and mechanical properties of the near-beta titanium alloy Ti-5553 processed by selective laser melting,” Mater. Des., vol. 105, pp. 75–80, 2016.
- Kennedy J.R., Davis A.E., Caballero A.E., White M., Fellowes J., Pickering E.J., Prangnell P.B., “Microstructure transition gradients in titanium dissimilar alloy (Ti-5Al-5V-5Mo-3Cr/Ti-6Al-4V) tailored wire-arc additively manufactured components,” Mater. Charact., vol. 182, no. October, p. 111577, 2021.
- C. Zopp, S. Blümer, F. Schubert, and L. Kroll, “Processing of a metastable titanium alloy (Ti-5553) by selective laser melting,” Ain Shams Eng. J., vol. 8, no. 3, pp. 475–479, 2017.
- D.S. Shin, C.H. Lee, U. Kühn, S.C. Lee, S.J. Park, H. Schwab, S. Scudino and K. Kosiba, Optimizing laser powder bed fusion of Ti-5Al-5V-5Mo-3Cr by artificial intelligence. J. Alloys Compd 862 (2021), pp. 158018.
- S. W. Williams, F. Martina, A. C. Addison, J. Ding, G. Pardal, and P. A. Colegrove, “Wire + Arc additive manufacturing,” Mater. Sci. Technol., vol. 32, no. 7, pp. 641–647, 2016.
- A. Ho, H. Zhao, J. W. Fellowes, F. Martina, A. E. Davis, and P. B. Prangnell, “On the origin of microstructural banding in Ti-6Al4V wire-arc based high deposition rate additive manufacturing,” Acta Mater., vol. 166, pp. 306–323, 2019.
- C. Körner, “Additive manufacturing of metallic components by selective electron beam melting — a review,” Int. Mater. Rev., vol. 61, no. 5, pp. 361–377, 2016.
- X. Bai, P. Colegrove, J. Ding, X. Zhou, C. Diao, P. Bridgeman, J. roman Hönnige, H. Zhang and S. Williams, Numerical analysis of heat transfer and fluid flow in multilayer deposition of PAW-based wire and arc additive manufacturing. Int. J. Heat Mass Transf 124 (2018), pp. 504–516.
- I. A. Roberts, C. J. Wang, R. Esterlein, M. Stanford, and D. J. Mynors, “A three-dimensional finite element analysis of the temperature field during laser melting of metal powders in additive layer manufacturing,” Int. J. Mach. Tools Manuf., vol. 49, no. 12–13, pp. 916–923, 2009.
- T. DebRoy, H.L. Wei, J.S. Zuback, T. Mukherjee, J.W. Elmer, J.O. Milewski, A.M. Beese, A. Wilson-Heid, A. De and W. Zhang, Additive manufacturing of metallic components – process, structure and properties. Prog. Mater. Sci 92 (2018), pp. 112–224.
- H. D. Carlton, K. D. Klein, and J. W. Elmer, “Evolution of microstructure and mechanical properties of selective laser melted Ti-5Al-5V-5Mo-3Cr after heat treatments,” Sci. Technol. Weld. Join., vol. 24, no. 5, pp. 465–473, 2019.
- T. Pasang, J.M.S. Amaya, Y. Tao, M.R. Amaya-Vazquez, F.J. Botana, J.C. Sabol, W.Z. Misiolek and O. Kamiya, Comparison of Ti-5Al-5V-5Mo-3Cr welds performed by laser beam, electron beam and gas tungsten arc welding. Procedia. Eng. 63 (2013), pp. 397–404.
- “BS EN 2002-1:2005, Aerospace series. Metallic materials. Test methods. Tensile testing at ambient temperature.”
- G.F. Vander Voort, Metallographic preparation of titanium and its alloys. Buehler Tech. Notes 3(3) (2006), pp. 1–5.
- S. Burgess, “Why is spectral resolution so important when analysing using WDS?,” Oxford Instruments NanoAnalysis Blog, 2020. Available at https://nano.oxinst.com/library/blog/spectral-resolution-wds. [Accessed: 26-Jan-2022].
- J.J. Donovan, J.M. Allaz, A. von der Handt, G.G.E. Seward, O. Neill, K. Goemann, J. Chouinard and P.K. Carpenter, Quantitative WDS compositional mapping using the electron microprobe. Am. Mineral 106(11) (2021), pp. 1717–1735.
- B. Jiang, S. Emura and K. Tsuchiya, Microstructural evolution and its effect on the mechanical behavior of Ti-5Al-5Mo-5V-3Cr alloy during aging. Mater. Sci. Eng. A 731(March) (2018), pp. 239–248.
- J.D. Cotton, et al., Phase transformations in Ti-5Al-5Mo-5V-3Cr-0.5Fe. Proc. Ti-2007 Sci. Technol. Japan Inst. Met. (2007).
- S. K. Kar, A. Ghosh, N. Fulzele, and A. Bhattacharjee, “Quantitative microstructural characterization of a near beta Ti alloy, Ti-5553 under different processing conditions,” Mater. Charact., vol. 81, pp. 37–48, 2013.
- M. J. Bermingham, S. D. McDonald, M. S. Dargusch, and D. H. St.John, “Grain-refinement mechanisms in titanium alloys,” J. Mater. Res., vol. 23, no. 1, pp. 97–104, 2008.
- H. Okamoto, “Al-Ti (aluminum-titanium),” J. Phase Equilib., vol. 21, no. 3, p. 311, 2000.
- F. Martina, S.W. Williams and P.A. Colegrove, Improved microstructure and increased mechanical properties of additive manufacture produced Ti-6Al-4V by interpass cold rolling. SFF Symp (2013), pp. 490–496.
- F. Wang, S. W. Williams, P. A. Colegrove, and A. A. Antonysamy, “Microstructure and mechanical properties of wire and arc additive manufactured Ti-6Al-4V,” Metall. Mater. Trans. A Phys. Metall. Mater. Sci., vol. 44, no. 2, pp. 968–977, 2013.
- L. Neto, S.W. Williams, J. Ding, J.R. Hönnige and F. Martina, "Mechanical Properties Enhancement of Additive Manufactured Ti-6Al-4V by Machine Hammer Peening," Adv. Surf. Enhanc. 1st Int. Conf. Adv. Surf. Enhanc. 1 (2020), pp. 121–132.
- U. F. Kocks and H. Mecking, “Physics and phenomenology of strain hardening: the FCC case,” Prog. Mater. Sci., vol. 48, pp. 171–273, 2003.
- D. Lunt, A. Ho, A. Davis, A. Harte, F. Martina, J. Quinta da Fonseca and P. Prangnell, The effect of loading direction on strain localisation in wire arc additively manufactured Ti–6Al–4V. Mater. Sci. Eng. A 788 (2020), pp. 139608.
- J. Donoghue, A. A. Antonysamy, F. Martina, P. A. Colegrove, S. W. Williams, and P. B. Prangnell, “The effectiveness of combining rolling deformation with wire-Arc additive manufacture on β-grain refinement and texture modification in Ti-6Al-4V,” Mater. Charact., vol. 114, pp. 103–114, 2016.
- J. Wang, X. Lin, J. Wang, H. Yang, Y. Zhou, C. Wang, Q. Li and W. Huang, Grain morphology evolution and texture characterization of wire and arc additive manufactured Ti-6Al-4V. J. Alloys Compd 768 (2018), pp. 97–113.
- P. A. Kobryn and S. L. Semiatin, “Microstructure and texture evolution during solidification processing of Ti–6Al–4V,” J. Mater. Process. Technol., vol. 135, no. 2-3 SPEC., pp. 330–339, 2003.
- S. A. David and J. M. Vitek, “Correlation between solidification parameters and weld microstructures,” Int. Mater. Rev., vol. 34, no. 5, pp. 213–245, 1989.
- M. J. Bermingham, D. H. StJohn, J. Krynen, S. Tedman-Jones, and M. S. Dargusch, “Promoting the columnar to equiaxed transition and grain refinement of titanium alloys during additive manufacturing,” Acta Mater., vol. 168, pp. 261–274, 2019.
- N. Saunders, Z. Guo, X. Li, A.P. Miodownik and J.P. Schillé, Using JMatPro to model materials properties and behavior. Jom 55(12) (2003), pp. 60–65.
- D.A. Porter and K.E. Easterling, Phase Transformations in Metals and Alloys 3 (1992).
- F. Wang, S. Williams, and M. Rush, “Morphology investigation on direct current pulsed gas tungsten arc welded additive layer manufactured Ti6Al4V alloy,” Int. J. Adv. Manuf. Technol., vol. 57, no. 5–8, pp. 597–603, 2011.
- S. Nag, R. Banerjee, R. Srinivasan, J. Y. Hwang, M. Harper, and H. L. Fraser, “ω-Assisted nucleation and growth of α precipitates in the Ti-5Al-5Mo-5V-3Cr-0.5Fe β titanium alloy,” Acta Mater., vol. 57, no. 7, pp. 2136–2147, 2009.
- Y. Zheng, S. Antonov, Q. Feng, R. Banerjee, D. Banerjee, and H. L. Fraser, “Shuffle-induced modulated structure and heating-induced ordering in the metastable β-titanium alloy, Ti-5Al-5Mo-5V-3Cr,” Scr. Mater., vol. 176, pp. 7–11, 2020.
- S. Antonov, R. Shi, D. Li, Z. Kloenne, Y. Zheng, H.L. Fraser, D. Raabe and B. Gault, Nucleation and growth of α phase in a metastable β-Titanium Ti-5Al-5Mo-5V-3Cr alloy: influence from the nano-scale, ordered-orthorhombic O″ phase and α compositional evolution. Scr. Mater 194 (2021), pp. 113672–5.
- D. Sharma, D. Parfitt, B. Chen, B. Roebuck, D.A. Venero, S.R. Kada, D. Fabijanic and M.E. Fitzpatrick, Influence of cooling rate on the precipitation kinetics of nanoscale isothermal ω-phase in metastable β-Ti alloy, Ti–5Al–5Mo–5V–3Cr. J. Alloys Compd 859(xxxx) (2021), pp. 157822.
- M. Salib, J. Teixeira, L. Germain, E. Lamielle, N. Gey, and E. Aeby-Gautier, “Influence of transformation temperature on microtexture formation associated with α precipitation at β grain boundaries in a β metastable titanium alloy,” Acta Mater., vol. 61, no. 10, pp. 3758–3768, 2013.
- A. E. Davis, J. Donoghue, J. R. Kennedy, N. Byres, and P. B. Prangnell, “In-Situ observation of single variant α colony formation in Ti-6Al-4V,” Acta Mater., vol. 220, p. 117315, 2021.
- A. Boyne, D. Wang, R.P. Shi, Y. Zheng, A. Behera, S. Nag, J.S. Tiley, H.L. Fraser, R. Banerjee and Y. Wang, Pseudospinodal mechanism for fine α/β microstructures in β-Ti alloys. Acta Mater. 64 (2014), pp. 188–197.
- Callegari B., Aristizabal K., Suarez S., Wu L., Coelho R.S., Brito P.P., García J.L., Soldera F.A., Mücklich F., Pinto H.C., “In situ evaluation of the low-temperature aging response of Ti–5Al–5Mo–5V–3Cr alloy as influenced by starting microstructure,” J. Alloys Compd., vol. 835, 2020.
- A. Settefrati, et al., Precipitation sequences in beta metastable phase of Ti-5553 alloy during ageing. Ti 2011 - Proc. 12th World Conf. Titan. 1(June) (2012), pp. 468–472.