
 ?Mathematical formulae have been encoded as MathML and are displayed in this HTML version using MathJax in order to improve their display. Uncheck the box to turn MathJax off. This feature requires Javascript. Click on a formula to zoom.
ABSTRACT
We have previously explored the hysteresis and reversibility of transitions between ordered packings of soft spheres of diameter d in cylindrical channels of diameter D [A. Mughal, J. Winkelmann, D. Weaire, S. Hutzler, Phys. Rev. E 98, 043303 (2018)]. Here we extend these initial results to include transitions between all columnar structures without inner spheres (i.e. packings in which all of the spheres are in contact with the cylindrical boundary). These results can be represented by a directed network showing permissible transitions between structures. From the hard sphere limit we deduce that there are two different types of transitions, reversible and irreversible. We explore the nature of these transitions for soft spheres as a function of pressure and due to changes in the ratio D/d. These results are illustrated by the use of schematic diagrams, indicating the topological features of each transition. Specific cases are tabulated and can be understood by reference to the appropriate schematic diagram.
1. Introduction
Ordered dense packings of spheres in cylindrical confinement have attracted increasing attention in recent years, with examples being found at various length scales [Citation1]. On the microscopic scale, many examples of biological microstructures (e.g. microtubules, viruses and flagella) can be described as tubular packings of spheres [Citation2, Citation3], while on the macroscopic level the arrangement of buds and leaves in plants can be understood by similar means [Citation4].
Columnar structures have also been realised in a range of experiments, some of the earliest include the packing of bubbles inside tubes [Citation5–12]. More recently, it has been shown that colloidal particles also crystallise into microscopic helical structures when trapped inside cylindrical pores [Citation13–16]. In nano-science, similar structures have been generated by inserting molecules or atoms into cylinders [Citation17–20] or on their surface [Citation21] in order to create novel materials. Further elaborations on the same theme include, the ground state arrangement of repulsive point-like particles confined to the surface of a cylinder [Citation22], the packing of spheroids in cylinders [Citation23] and the packing of ellipses on the surface of a cylinder [Citation24]
We and others have published extensive results for the packing of hard [Citation3, Citation25–28] and soft [Citation12, Citation16, Citation29] spheres. The latter are modelled by purely repulsive harmonic forces, allowing for an overlap between spheres. This is a rough representation of bubbles in particular [Citation30]. These results are contained in an extensive phase diagram (Figure 2 in [Citation29]) which specifies the equilibrium structures for all relevant values of D/d (i.e. the ratio of cylinder diameter D to sphere diameter d) and applied pressure p.
Figure 2. Computational results for the densest columnar sphere packings. Shown is the packing density Φ as a function of the ratio D/d of tube to sphere diameter, together with the phyllotactic notation of the structures (see [Citation27] for an extended range of D/d values). The shaded region of the diagram is of relevance to the soft sphere packings discussed in this article. Whenever the line-slip packings and
are not those of highest density their packing fraction is indicated by dotted lines (these are for illustrative purposes only and not the result of computation).
![Figure 2. Computational results for the densest columnar sphere packings. Shown is the packing density Φ as a function of the ratio D/d of tube to sphere diameter, together with the phyllotactic notation of the structures (see [Citation27] for an extended range of D/d values). The shaded region of the diagram is of relevance to the soft sphere packings discussed in this article. Whenever the line-slip packings (3,2,1) and (3,3,0) are not those of highest density their packing fraction is indicated by dotted lines (these are for illustrative purposes only and not the result of computation).](/cms/asset/8b6798ee-5555-45e2-b67c-ee6306c6a5ef/tphm_a_2208885_f0002_oc.jpg)
For the macroscopic systems for which this work has proved relevant so far (foams [Citation6, Citation7, Citation31, Citation32]), questions of metastability and hysteresis arise. The system must remain in a (meta)stable state, but not necessarily that of lowest enthalpy. We have broached this question in our earlier investigation, but provided only one limited example of what we term a ‘stability diagram’, indicating the structures that are encountered for a given change of pressure p or size ratio D/d, and the loci for instability and structural transitions.
In the present paper we will provide a more comprehensive answer to the question raised, by investigating all parts of the phase diagram (up to the point at which internal spheres are found in the structures of maximal density, i.e. [Citation27]). There are several such cases: we condense the results by representing various types of stability diagrams by a few key parameters.
The paper is organised as follows. In Section 2 we summarise some of our previous results for hard and soft sphere packings. In Section 3 we present the key features of a stability diagram. In Section 4 we introduce a new directed network graph of possible transitions between packings. In Section 5 we extend our results to a number of reversible transitions and also present stability diagrams for irreversible transitions. We give our conclusions in Section 6.
2. Summary of previous results
2.1. Hard sphere packings
For close packings of hard spheres in cylindrical tubes, such as those shown in , the key parameter is the ratio between the tube diameter D and sphere diameter d [Citation26, Citation27]. Varying D/d gives rise to a family of helical structures for which we have provided a complete taxonomy (in terms of phyllotactic indices, see [Citation26, Citation27] for details) up to the above mentioned critical value
. shows the variation of packing density Φ (volume fraction of spheres) with D/d for most of the structures discussed in this paper.
Figure 1. An example of a uniform (a) columnar structure and its line slip modification (b), generated by packing spheres of diameter d into a tube of diameter D. In the uniform structure, every sphere has an identical neighbourhood with a coordination number z = 6. Its corresponding line slip structure (shown to the right) is characterised by gaps (i.e. loss of contacts), highlighted by the (red) ellipse. For the structure classification we use the phyllotactic notation (see [Citation26, Citation27] for details).
![Figure 1. An example of a (4,4,0) uniform (a) columnar structure and its line slip modification (b), generated by packing spheres of diameter d into a tube of diameter D. In the uniform structure, every sphere has an identical neighbourhood with a coordination number z = 6. Its corresponding line slip structure (shown to the right) is characterised by gaps (i.e. loss of contacts), highlighted by the (red) ellipse. For the structure classification we use the phyllotactic notation (see [Citation26, Citation27] for details).](/cms/asset/b35261a3-6ba7-4ae3-a1f7-41d0889b07af/tphm_a_2208885_f0001_oc.jpg)
For a set of discrete values of D/d the densest packing arrangements are given by uniform structures, that is packings in which each sphere is in contact with six neighbouring spheres. For all other values of D/d the densest packings are line-slip arrangements whereby neighbouring spiral chains slide over each other, so that some spheres only have five contacts. An example of a uniform and its related line-slip structure is given in .
In the uniform structures correspond to the local peaks in the packing density. Uniform packings can be continuously transformed into the appropriate line-slip arrangement by the loss of a contact, the result is a structure with a lower density. Local minima, on the other hand, are where a given line-slip is surpassed in density by another line-slip structure. The two structures are unrelated to each other, that is, there is no simple continuous transformation between them.
In what follows we will have reason to refer to the region highlighted in grey in . For now we simply note that the diagram presents the packing arrangement (either a uniform arrangement of a line-slip packing) with the greatest density for any given D/d, alternative packings with lower density are not shown. However, in the grey region of we illustrate the continuation of some of these line-slip structures (of a lower density) by dotted lines. These dotted lines have been simply sketched in for illustrative purposes and are not the result of computation.
2.2. Soft sphere packings: phase diagram
In [Citation12, Citation29] we have extended our study of columnar sphere packings to packings of soft spheres. In this case the pressure P is an additional parameter. Stable structures are found by minimising the enthalpy H = E + PV for a system of N soft spheres contained in a volume V and given diameter ratio D/d; E is the internal energy due to sphere-sphere and sphere-cylinder overlaps. The results were presented in the form of an equilibrium phase diagram, showing the structure of minimal enthalpy for a given value of D/d and P [Citation12, Citation29] (see Appendix A for details of how the simulations were conducted). Boundaries between phases can be continuous or discontinuous, indicating a smooth or abrupt change in the enthalpy, respectively.
For illustrative purposes we present a part of this phase diagram as a schematic in (see Figure 2 in [Citation29] for the full version). The various regions correspond to different lowest enthalpy structures. Their labelling, U or L concern their classification as uniform or line-slip structures, respectively. The regions are separated by phase boundaries at which the change of structure is either continuous (dashed lines) or discontinuous (solid lines).
Figure 3. A schematic version of a part of the full phase diagram presented in [Citation29], showing the structure of minimal enthalpy structure. The horizontal axis (i.e. the pressure p = 0 (hard-sphere) limit) corresponds to the shaded part of . The red diamond indicates the value of D/d at which the uniform packing is found in the hard sphere limit. The regions of the phase diagram indicates which packing – either uniform structures (
) or line-slip (
) has the lowest enthalpy.
![Figure 3. A schematic version of a part of the full phase diagram presented in [Citation29], showing the structure of minimal enthalpy structure. The horizontal axis (i.e. the pressure p = 0 (hard-sphere) limit) corresponds to the shaded part of Figure 2. The red diamond indicates the value of D/d at which the uniform packing (4,2,2) is found in the hard sphere limit. The regions of the phase diagram indicates which packing – either uniform structures (U0,U1,U2) or line-slip (L0,L1,L2) has the lowest enthalpy.](/cms/asset/60c7be5f-bf52-4df9-98ad-b46162121b7b/tphm_a_2208885_f0003_oc.jpg)
The nature of these boundaries can be deduced using the fact that the hard-sphere results (for the shaded region) in correspond to the horizontal axis (P = 0) in .
To illustrate the relationship between hard sphere results and the phase diagram for soft sphere packings we shall concentrate on the grey (shaded) region shown in . Note in particular that the uniform packing can be transformed into the line-slip
and this eventual becomes the uniform packing
. That is, in the hard sphere limit, as shown by the dotted line, the line-slip
connects the uniform packings
and
by a continuous transformation. Even if for part of the shaded region shown in the line-slip
has a lower density as compared to other packings, nevertheless it still provides a metastable solution. This is reflected in the soft-sphere results, as sketched in , whereby the line-slip
continues as a metastable solution (of higher enthalpy) between the two regions labelled
.
From the hard sphere results it can be seen that the uniform packing can be transformed continuously into the line slip structure
by the loss of a contact. This relationship extends into the soft-sphere results, as indicated by the dashed line between
and
. As expected, the enthalpy varies smoothly and continuously across the boundary [Citation12].
Similarly, it can be seen from hard sphere results that the uniform structure can be transformed into
by the loss of a contact, this is again reflected in the phase diagram, . In a similar manner, the correspondence between
and its associated line-slips (
&
) can also be easily deduced by comparing and .
At higher pressures the line-slip arrangements become unstable, vanishing at triple-points, leaving only uniform packings. As such the boundaries between these packings (at high pressures) are given by solid lines to indicate that the change is discontinuous. That is, the change in structure is abrupt and this can also be seen in the enthalpy, which upon crossing the boundary may involve a sudden change in the gradient and (or) a jump-discontinuity (see for example Figure 3 in [Citation12]).
Finally, there are the boundaries between adjacent line-slip packings in – such as the boundary between and
, or between
and
. These are discontinuous (as expected) since there exists no simple continuous transformations leading from one to the other.
3. Metastability and hysteresis
Given a phase diagram of the type shown in , one may ask the question what happens to a given equilibrium structure if the pressure or the diameter ratio is continuously varied? (Experimentally, the first such variation might be easier to realise.) Could the system remain in a metastable state, giving rise to hysteretic effects? Assuming the pressure is sufficiently low, is it possible to begin with the structure and gradually increase the diameter of the confining cylinder so that it transforms first into an intervening line-slip arrangement and then into
? Could this process be reversed?
The answer is yes, and we have demonstrated this in [Citation29] for the case which can be transformed into
(and back again). We summarised our results in the form of a stability diagram, which we will discuss in Section 5, as it is of relevance to all reversible transitions encountered for the range of D/d analysed here.
Below a critical pressure the transformations between uniform and line-slip structures is continuous and is accompanied by a smooth variation in the enthalpy, or at most a change in the derivative of the enthalpy when a new contact is formed (see Appendix A for details of how the simulations were conducted).
The situation is more complex at higher pressures where transitions between structures become discontinuous, leading to hysteresis. Nevertheless, a transformation between the two uniform structures and
is possible.
A change in D/d can potentially transform a uniform structure into a number of intermediate line-slip arrangements, each leading to a different uniform structure. In our numerical results we do not observe all of these potential transitions, only a subset, which we call favourable transitions. For a given uniform structure the favourable transition can easily be identified from our previous hard sphere results: it corresponds to the line-slip immediately adjacent to a given uniform structure; see Table 1 in [Citation27] for a list.
Table 1. Critical pressures for reversible transitions.
This table lists the densest sphere packing structures in sequence with increasing D/d, thus for example the uniform structure is listed as the 10th structure. Immediately adjacent to this in the table are two line-slip structures: the 9th structure
and the 11th structure
, which occur at slightly lower or higher values of D/d respectively. Starting with the uniform structure
and increasing D/d implies that it will transform into the line-slip
which eventually leads to the uniform structure
, while starting with
and decreasing D/d implies that it will transform into the line-slip
which eventually leads to the uniform structure
.
These are the favourable transitions leading away from a uniform structure, that is, the line-slip with the greatest density the uniform structure can transform into due to an infinitesimal change in D/d.
The favourable transitions (i.e. the line slips) can also be identified from . They occur via the line slips immediately adjacent to a local peak (i.e uniform packing) corresponding to the line-slips with the greatest (local) density. Thus for example, starting with the uniform structure an increase in D/d will transform it into the line slip
and eventually into the uniform structure
– that is we follow the dotted line in that leads from
to
via
. If the pressure is below
this transformation is continuous, while above this pressure there is hysteresis.
4. Network of structural transitions in the hard sphere limit
To summarise the structural transitions that are encountered upon a change of the ratio D/d of tube to sphere diameter we have developed a directed network graph which indicates a pattern for favourable transitions amongst all possible transitions. From this network graph, shown in , we identify two different transition types (reversible and irreversible), as described below. In addition to providing a new perspective on the previous hard sphere results, the network also predicts structural transitions yet to be realised experimentally.
Figure 4. Directed network displaying possible structural transitions between uniform structures, in the hard sphere limit. The structures are restricted to packings without internal spheres and are labelled using phyllotactic notation. The point represents a conceptual origin for the diagram, corresponding to
. Dashed lines are contours of constant D/d – a transition from one structure to another which involves moving along the diagram in a direction perpendicular to the contours implies a change in D/d. Favourable transitions are marked with blue arrows, unfavourable transitions with red arrows and all unstable cases are shown with black dashed arrows.
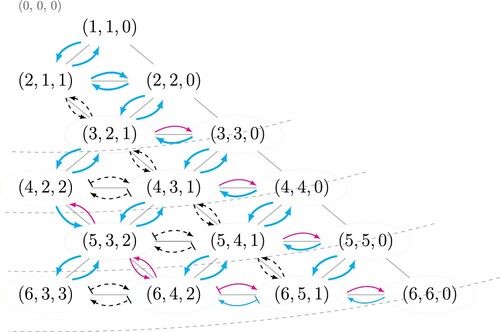
The network has as its nodes all uniform structures (specified by their respective phyllotactic notation), arranged so that their distance to some conceptual origin increases with their values of D/d. The different types of transitions, as detailed below, are indicated by different types of arrows. A transition from one uniform structure to another which requires moving along the diagram in the direction perpendicular to the contours of constant D/d (shown as dashed lines) implies a change in D/d.
Favourable transitions are indicated by bold blue arrows in . Also shown, by the red arrows, are the transitions identified from previous hard sphere results [Citation27] which are found to be unfavourable (i.e. intermediate line slip structures exist between these uniform packings but we do not observe these transitions in our numerical simulations). The black dashed arrows indicate line slip transitions that are mechanically unstable. These are of two types as described below.
The first type are rhombic arrangements. That is the transition between packings involves an affine shear of the entire packing (as opposed to a line-slip where the shear is restricted to single ‘line’) which we showed previously to be unstable [Citation33]. In these are transitions between adjacent packings with indices , i.e.
.
The other mechanically unstable transitions are due to so called re-entrant line slips [Citation26, Citation27, Citation33]. These are line-slips for which the cylinder diameter does not increase (or decrease) monotonically with the line-slip. See for example the line slip between and
in Figure 10 of [Citation27], where the line slip appears to ‘double back’.
Reversible transitions take place between structures connected via two blue arrows, for instance . When increasing D/d starting from
, the preferred transition (blue arrow) is into
; similarly upon decreasing D/d the favoured transition returns the system back to
structure.
An example of an irreversible transition is that from . Here, the
structure can not be transformed back into the
via decreasing D/d, instead it transforms (reversibly) into
.
Following the favourable transitions in the network, we can identify cyclic patterns that can only be followed counterclockwise, with the first cycle starting in the third row: . The transitions are achieved via increasing D/d until the
structure is reached, at which point decreasing D/d leads back to the original structure via
and
. Another potential cycle could start and end with the structures
(confirmation would require further simulations that we have not conducted here).
The structural transitions presented in the network of is broadly consistent with previous results for similar systems. The earliest detailed experimental work appears to be that by [Citation7] who dilated and compressed crystalline arrangements of equal volume soap bubbles that were confined in a cylinder, by the use of a piston. The observed cycles of structural transitions were interpreted by the authors with reference to the nucleation and motion of a dislocation on a triangular lattice [Citation6, Citation7]. More recently, transitions between assemblies of hard particles in cylinders were explored numerically using Monte Carlo simulations [Citation14]. By compressing the system it is possible to induce transitions between structures, again we find that the favourable transitions listed by Fu et al. [Citation14] are consistent with .
5. Stability diagrams for columnar structure with 
Having defined the two different transition types (reversible and irreversible) in the previous section, we now want to explore how these transitions change with increasing pressure p.
We do this by computing trajectories in the plane, and recording boundaries where a structure changes to one of a different character. With a sufficient number of trajectories, a stability diagram is built up, that is, a map of the location of structural transitions.
We will present schematic stability diagrams for both reversible and irreversible transitions, applicable to all the transitions between columnar structures with size ratio (without inner spheres). The corresponding critical pressures, which demarcate different transition routes, are presented in a table.
5.1. The reversible case
In [Citation29] we had presented, as an example of a reversible transition, the case . The corresponding stability diagram can be represented schematically, as in , so that it shows the topological features of any reversible transition between two uniform structures
and
.
Figure 5. Schematic displaying the topological features of a stability diagram for reversible transitions. The two uniform arrangements are labelled by and
and the intermediate line slip is labelled LS. Solid lines represent discontinuous transitions, continuous transition are marked as dashed lines and the arrows at the lines indicate the direction of the transition. For this type of transition
transforms reversibly into
, showing only hysteresis above a threshold pressure
. (Taken from previous publication [Citation29])
![Figure 5. Schematic displaying the topological features of a stability diagram for reversible transitions. The two uniform arrangements are labelled by U1 and U2 and the intermediate line slip is labelled LS. Solid lines represent discontinuous transitions, continuous transition are marked as dashed lines and the arrows at the lines indicate the direction of the transition. For this type of transition U1 transforms reversibly into U2, showing only hysteresis above a threshold pressure p3. (Taken from previous publication [Citation29])](/cms/asset/acfe8ce4-41a9-46ac-8747-a15f6a446a94/tphm_a_2208885_f0005_oc.jpg)
Below pressure the uniform structure
can be transformed by a continuous (i.e. reversible) transition into its associated line slip. A further increase in D/d leads to a second continuous transition, whereby the line-slip is transformed into the uniform structure
. For a fixed pressure, the transitions occur at the same value of D/d, independent whether taking the forward trajectory (i.e. increasing D/d) or backward trajectory (i.e. decreasing D/d). This is indicated by the use of double-headed arrows in .
For pressures p with the transition from the uniform structure
to the line-slip remains continuous on both the forward and reverse trajectories. However, the transitions between the line-slip and the uniform structure
are now discontinuous and no longer occur at the same value of D/d.
Increasing the pressure further (i.e. ) results in the transition from the uniform structure
to the line-slip becoming discontinuous; furthermore the line-slip is no longer observed on the reverse trajectory (instead the system makes a discontinuous jump from
to
). Finally, above
the line slip also disappears from the forward trajectory and instead there are only discontinuous transitions between the two uniform structures
and
.
To demonstrate the interpretation of we now give an example. Suppose we fix the pressure to be in the regime and start with the structure
to the left of the diagram (i.e. low D/d). Keeping p constant and increasing D/d allows us to move towards the right of the diagram and eventually brings us into region C in the diagram. At the dashed boundary the change in enthalpy in going from
to LS is continuous (as indicated by the dashed line). Increasing D/d (i.e. moving further towards the right) brings us into region B but the boundary can be ignored since the arrow points in the opposite direction. The final boundary (with an arrow pointing to the right) however is relevant and the solid line indicates a discontinuous change in the enthalpy, upon crossing the boundary the line-slip is transformed into the uniform packing
.
Reversing the trajectory we start with and decrease D/d (i.e. moving now towards the left), we first enter the region labelled B but the boundary can be ignored (since the arrow points in the opposite direction). Upon crossing from region B to C the solid boundary (with an arrow pointing to the left) is relevant and indicates a discontinuous transition from
to the line-slip. Further decreasing D/d results in a continuous transition from the line-slip and back to the the uniform packing
.
The critical pressures depend on the choice of the uniform structures
and
. and were determined from our simulations.
, together with containing the values for the critical pressure thus presents all the information required to characterise reversible transitions with (excluding structures with inner spheres).
5.2. The irreversible case – structural hysteresis
Irreversible transitions also lead from an initial to a final uniform structure (by a change of D/d), however, by definition the reverse path is not observed: it is unfavourable.
Within the range of cases discussed here we identify two types of irreversible transitions. The topological features of the first type, I, for which the initial uniform structure has the phyllotactic indices of the form
, is shown in (a). The second type, II, for which the initial uniform structure
has phyllotactic indices of the form
is shown in (b). Note that a common feature of both types of irreversible transitions is that the initial uniform structure is achiral.
Figure 6. Schematic stability diagrams for irreversible transitions. The uniform arrangements are labelled by ,
and
and the intervening line slip, in each case, is labelled LS. Solid lines represent discontinuous transitions, continuous transition are marked as dashed lines and the arrows at the lines indicate the direction of the transition. (a) Type I transition: Structure
is of the type
. (b) Type II transition: Structure
is of the type
.
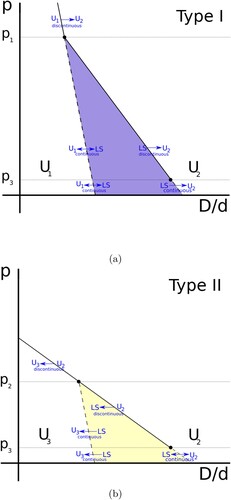
5.2.1. Irreversible transition of type I
Starting with a uniform structure of the type
we find that below
the structure can be transformed continuously (and reversibly) into its associated line-slip, as shown in (a) by the symbol
. A further increase in D/d leads to the formation of a new contact, resulting in the uniform structure
. While this second transition is continuous (since the enthalpy varies smoothly throughout) it is not reversible, as indicated by the symbol
The transition from to
is irreversible in the sense that beginning with
a decrease in D/d does not lead back to
. For example, increasing D/d leads from
to
but a decrease in D/d from
leads eventually to
(and not back to
). This is evident also from the directed network shown in ).
For higher pressures in the range the transformation from the line-slip to
becomes discontinuous (i.e. accompanied by a sudden change in the enthalpy). Finally, for pressures above
the intervening line-slip between the two uniform structures disappears completely and this leads to a discontinuous change from
to
.
5.2.2. Irreversible transition of type II
In the case of initial structures of the type the topological features of the transitions are similar, except that the transition is from the initial uniform structure
to the final uniform structure
and involves a decrease in D/d.
However, in the case of the structures a protracted difficulty was encountered in the regions indicated by ‘
’ in . We expect the transition from
to the line slip to be continuous below a critical pressure
, however we encountered pressures that were so low that we reached the limit of our numerical capabilities and were unable to obtain an estimates.
Table 2. Critical pressures for irreversible transitions.
A further decrease in D/d eventually leads to a continuous (and reversible) transition from the line-slip to . In the regime
the transition from
to the line-slip becomes discontinuous (as we have observed in simulations). Finally above
the line slip disappears completely and the transition form
to
is by a single discontinuous jump in enthalpy.
6. Conclusion
When equal-volume hard spheres, bubbles or other similar entities are confined in narrow cylinders, they form a fascinating variety of helical and non-helical structures.
Extensive numerical simulations of such columnar packings showed that for monodisperse hard spheres the ratio of the cylinder diameter to the sphere diameter is the key parameter which determines the type of arrangement. For soft spheres both applied pressure and size ratio play a role and we have provided a complete taxonomy of the competing structures.
Here we have completed the survey of the hysteretic effects predicted for soft spheres, as was anticipated in our earlier work [Citation29]. Transitions between packings, due to either changes in D/d or pressure P, are shown to be either reversible or irreversible. These relationships are summarised by a directed network and key parameters have been tabulated. Our results are found to be in broad agreement with other studies of transitions between columnar structures, either in the context of foams [Citation6, Citation7] or colloids packed into tubes [Citation14].
Our work is of relevance to the field of discrete or droplet microfluidics, in which ordered assemblies of bubbles or droplets are transported through channels [Citation34–36]. Our directed network offers guidance how particular structures may respond to changes in either channel diameter or pressure.
A further relevance of our work may be to the recent observations of helical packings that form during the clogging of spherical particles in cylindrical channels [Citation37].
Acknowledgments
We acknowledge inspiring discussions with M. Mungan.
Disclosure statement
No potential conflict of interest was reported by the author(s).
Additional information
Funding
References
- J. Winkelmann and H.-K. Chan, Columnar Structures of Spheres: Fundamentals and Applications, Jenny Stanford Publishing, New York, 2023.
- R. Erickson, Tubular packing of spheres in biological fine structure, Science 181(4101) (1973), pp. 705–716.
- W. Harris and R. Erickson, Tubular arrays of spheres: Geometry, continuous and discontinuous contraction, and the role of moving dislocations, J. Theoret. Biol. 83(2) (1980), pp. 215–246.
- A. Mughal and D. Weaire, Phyllotaxis, disk packing, and Fibonacci numbers, Phys. Rev. E 95(2) (2017), pp. 022401.
- W. Mann and R. Stephens, XIV. Bubble formation in glass tubes, The London, Edinburgh, and Dublin Philosophical Magazine and Journal of Science 15(96) (1933), pp. 143–146.
- N. Pittet, P. Boltenhagen, N. Rivier, and D. Weaire, Structural transitions in ordered, cylindrical foams, Europhys. Lett. EPL 35(7) (1996), pp. 547–552.
- P. Boltenhagen, N. Pittet, and N. Rivier, Giant deformations and topological hysteresis of an ordered foam, Europhys. Lett. EPL 43(6) (1998), pp. 690–694.
- P. Boltenhagen and N. Pittet, Structural transitions in crystalline foams, Europhys. Lett. EPL 41(5) (1998), pp. 571–576.
- M. Saadatfar, J. Barry, D. Weaire, and S. Hutzler, Ordered cylindrical foam structures with internal bubbles, Philos. Mag. Lett. 88(9-10) (2008), pp. 661–668.
- S. Tobin, J. Barry, A. Meagher, B. Bulfin, C. O'Rathaille, and S. Hutzler, Ordered polyhedral foams in tubes with circular, triangular and square cross-section, Colloids Surf. A: Physicochem. Eng. 382(1-3) (2011), pp. 24–31.
- A. Meagher, F. García-Moreno, J. Banhart, A. Mughal, and S. Hutzler, An experimental study of columnar crystals using monodisperse microbubbles, Colloids Surf. A: Physicochem. Eng. 473 (2015), pp. 55–59.
- J. Winkelmann, B. Haffner, D. Weaire, A. Mughal, and S. Hutzler, Corrected article: Simulation and observation of line-slip structures in columnar structures of soft spheres [Phys. rev. E 96, 012610 (2017)], Phys. Rev. E 97(5) (2018), pp. 059902.
- M. Lohr, A. Alsayed, B. Chen, Z. Zhang, R. Kamien, and A. Yodh, Helical packings and phase transformations of soft spheres in cylinders, Phys. Rev. E 81(4) (2010), pp. 040401.
- L. Fu, C. Bian, C. Shields, D. Cruz, G. López, and P. Charbonneau, Assembly of hard spheres in a cylinder: A computational and experimental study, Soft. Matter. 13(18) (2017), pp. 3296–3306.
- Y. Yin and Y. Xia, Self-assembly of spherical colloids into helical chains with well-controlled handedness, J. Amer. Chem. Soc. 125(8) (2003), pp. 2048–2049.
- G. Wu, H. Cho, D. Wood, A. Dinsmore, and S. Yang, Confined assemblies of colloidal particles with soft repulsive interactions, J. Amer. Chem. Soc. 139(14) (2017), pp. 5095–5101.
- J. Warner and M. Wilson, Elastic distortions of carbon nanotubes induced by chiral fullerene chains., ACS. Nano. 4(7) (2010), pp. 4011–4016.
- T. Yamazaki, K. Kuramochi, D. Takagi, Y. Homma, F. Nishimura, N. Hori, K. Watanabe, S. Suzuki, and Y. Kobayashi, Ordered fullerene nanocylinders in large-diameter carbon nanotubes, Nanotechnology 19(4) (2008), pp. 045702.
- K. Troche, V. Coluci, S. Braga, D. Chinellato, F. Sato, S. Legoas, R. Rurali, and D. Galvão, Prediction of ordered phases of encapsulated c60, c70, and c78 inside carbon nanotubes, Nano. Lett.5(2) (2005), pp. 349–355.
- S. Sanwaria, A. Horechyy, D. Wolf, C.Y. Chu, H.L. Chen, P. Formanek, M. Stamm, R. Srivastava, and B. Nandan, Helical packing of nanoparticles confined in cylindrical domains of a self-Assembled block copolymer structure, Angew. Chem., Int. Ed. Engl. 53(34) (2014), pp. 9090–9093.
- N. Tanjeem, W. Wilkin, D. Beller, C. Rycroft, and V. Manoharan, Geometrical frustration and defect formation in growth of colloidal nanoparticle crystals on a cylinder: Implications for assembly of chiral nanomaterials, ACS Appl. Nano Mater. 4(10) (2021), pp. 10682–10691.
- H. Ansell, A. Tomlinson, and N. Wilkin, Transitions between phyllotactic lattice states in curved geometries, Sci. Rep. 10(1) (2020), pp. 1–9.
- W. Jin, H.K. Chan, and Z. Zhong, Shape-anisotropy-induced ordered packings in cylindrical confinement, Phys. Rev. Lett. 124(24) (2020), pp. 248002.
- W. Jin, Y. Wang, H.K. Chan, and Z. Zhong, Confinement-induced columnar crystals of ellipses, Phys. Rev. Res. 3(1) (2021), pp. 013053.
- G. Pickett, M. Gross, and H. Okuyama, Spontaneous chirality in simple systems, Phys. Rev. Lett.85(17) (2000), pp. 3652–3655.
- A. Mughal, H.K. Chan, and D. Weaire, Phyllotactic description of hard sphere packing in cylindrical channels, Phys. Rev. Lett. 106(11) (2011), pp. 115704.
- A. Mughal, H.K. Chan, D. Weaire, and S. Hutzler, Dense packings of spheres in cylinders: Simulations, Phys. Rev. E 85(5) (2012), pp. 051305.
- L. Fu, W. Steinhardt, H. Zhao, J. Socolar, and P. Charbonneau, Hard sphere packings within cylinders, Soft. Matter. 12(9) (2016), pp. 2505–2514.
- A. Mughal, J. Winkelmann, D. Weaire, and S. Hutzler, Columnar structures of soft spheres: Metastability and hysteresis, Phys. Rev. E 98(4) (2018), pp. 043303.
- M. van Hecke, Jamming of soft particles: Geometry, mechanics, scaling and isostaticity, J. Phys. Condens. 22(3) (2009), pp. 033101.
- D. Weaire, S. Hutzler, and N. Pittet, Cylindrical packings of foam cells, Forma 7 (1992), pp. 259-–263.
- N. Pittet, N. Rivier, and D. Weaire, Cylindral packing of foam cells, Forma 10 (1995), pp. 65–73.
- A. Mughal and D. Weaire, Theory of cylindrical dense packings of disks, Phys. Rev. E 89(4) (2014), pp. 042307.
- W. Drenckhan, S. Cox, G. Delaney, H. Holste, D. Weaire, and N. Kern, Rheology of ordered foams–on the way to discrete microfluidics, Colloids Surf. A: Physicochem. Eng. 263(1-3) (2005), pp. 52–64.
- W. Drenckhan and D. Langevin, Monodisperse foams in one to three dimensions, COCIS 15 (2010), pp. 341–358.
- L. Shang, Y. Cheng, and Y. Zhao, Emerging droplet microfluidics, Chem. Rev. 117(12) (2017), pp. 7964–8040.
- D. López, D. Hernández-Delfin, R. Hidalgo, D. Maza, and I. Zuriguel, Clogging-jamming connection in narrow vertical pipes, Phys. Rev. E 102(1) (2020), pp. 010902.
- R. Byrd, P. Lu, J. Nocedal, and Z. C., A limited memory algorithm for bound constrained optimization, SIAM J. Sci. Comput. 16(5) (1995), pp. 1190–1208.
Appendix
Simulation model
We consider the same model as in our previous work [Citation29]. The interaction energy between spheres of diameter d is then given by,
(A1)
(A1) where
is the distance between the centres of the spheres. Note the interaction energy is zero when there is no overlap between the spheres.
The interaction energy between the ith sphere and the cylindrical boundary is given by,
where
. The spring constant k determines the softness of the spheres.
We conduct simulations using a unit cell of length L (volume ), containing N spheres. On the ends of the unit cell we impose twisted periodic boundary conditions. The periodic boundaries are implemented by placing image spheres above and below the unit cell, where each sphere of the unit cell is moved in the z-direction by L (and
) and twisted by an angle α (and
, respectively) in the xy-plane [Citation27].
Our simulations were run with 12 spheres in the unit cell, commensurable with the minimum number of spheres required for the previously identified hard-sphere packings in the investigated range of D/d (N = 1, 2, 3, 4, see in [Citation27]). For simulations of the structure or its adjacent line slips, which are the only structures with at least five spheres in the unit cell, N = 60 spheres was used.
Stable structures can be generated by minimising the enthalpy H = E + PV. Here is the internal energy due to overlaps with other spheres (
) and with the cylindrical boundary (
)) and P is the pressure. During the minimisation, the free parameters are the sphere centres
, the twist angle α, and the length of the unit cell L, while the pressure P is kept constant.
Enthalpy and pressure have to be rescaled accordingly to obtain non-dimensional quantities. We use the dimensionless enthalpy and dimensionless pressure
, where k is the spring constant and d is the sphere diameter.
From our previous results we are able to identify the minimal enthalpy structure for a given value of p and D/d. For this stable structure we ask how does it change when the pressure p and diameter ratio D/d are continuously varied (where in the latter case we only explore the change in D/d by varying D and not by varying d), while remaining in the local minimum of enthalpy? Thus, we will only be using the BFGS method [Citation38] here, which uses a conjugate gradient algorithm to search for the nearest local minimum.
With this procedure, structures of high symmetry, such as the or
, can get stuck on a saddle point, where the enthalpy is not minimal, but its gradient is zero. This can be avoided by applying a small random perturbation to the structure, which displaces it from the saddle point, followed by a local minimisation. Starting with a given uniform structure, a change in D/d may lead to a mechanically unstable structure which is identified as a structure that starts out as the expected line-slip arrangement but then collapses into a metastable structure.