
 ?Mathematical formulae have been encoded as MathML and are displayed in this HTML version using MathJax in order to improve their display. Uncheck the box to turn MathJax off. This feature requires Javascript. Click on a formula to zoom.
ABSTRACT
The present work is aimed at examining the effect of solid solution on the development of recrystallization microstructure and texture in FCC materials where SFE remains unchanged on alloying addition. To elucidate the mechanisms of texture formation during recrystallization, pure Ni and Ni-Fe (20 and 40 wt.% Fe) alloys were investigated. After recrystallization, pure Ni showed a cube and a non-uniform α-fibre texture, whereas the Ni-Fe alloys showed a texture characterised by the rotated cube component, brass recrystallization (BR) orientation, and a non-uniform α-fibre. Addition of Fe to pure Ni has led to some fine differences in the recrystallization texture that have been attributed to the role of highly heterogeneous deformed microstructure in the Ni-Fe system because of alloying. However, in all the cases Cu-oriented grains are prone to early recrystallization due to relatively more heterogeneously deformed regions, whereas deformed grains having orientation <110> || ND have shown slow recrystallization. In all cases, the entire stage of recrystallization is dominated by the formation of annealing twin (Σ3) boundary. The mobility of these twin boundaries plays an important role in the evolution of the recrystallization texture, which in turn, depends on its coherency, i.e. grain boundary plane (K1) of twin boundaries. The mechanism of evolution of recrystallization texture and the role of different deformation features during recrystallization is investigated. The cellular automata simulation technique was used to simulate the recrystallization behaviour of the alloys. The simulation results were used to discuss experimental observations.
1. Introduction
Most metallic materials are required to go through deformation processes before their application. These deformation processes lead to changes in the crystallographic orientation of grains (texture) [Citation1–3]. In most practical applications, annealing of the deformed material is required to restore its ductility. Upon annealing, metallic materials release stored energy by triggering the phenomena of recovery, recrystallization, and grain growth [Citation4]. The most important stage is recrystallization because the most prominent microstructure and texture changes take place during this stage [Citation5,Citation6].
The texture changes during recrystallization depend primarily upon the specific nucleation mechanisms and the growth selection. Several nucleation mechanisms have been proposed such as discontinuous subgrain coarsening [Citation6–8], annealing twinning [Citation9,Citation10], nucleation at prior grain boundaries [Citation11], nucleation at shear bands [Citation12–16], particle-stimulated nucleation [Citation17–20], and strain-induced grain boundary migration (SIBM) [Citation21,Citation22]. New texture components, which are characteristic of certain nucleation phenomena, in most cases already exist at least in minute quantities within the deformation microstructure. Thereby, the final recrystallization texture can be similar to or very different from the original deformation texture [Citation23,Citation24]. In general, high misorientation (high mobility) and high defect density correspond to fast growth of nuclei [Citation25]. However, there are certain special boundaries such as <111>/40° misoriented boundaries which have very high mobility compared to random HAGB, and also certain special boundaries that are relatively immobile such as <111>/60° misoriented (coherent twin) Σ3 boundaries [Citation25]. All these factors play an important role in determining the orientations of successful nuclei and thus the resulting texture of materials. Primarily, two mechanisms have been proposed to describe texture transformation during recrystallization: oriented nucleation, where preferential nucleation takes place, and growth selection, where few orientations grow very fast at the expense of deformation texture components due to the mobility advantage of a certain type of grain boundaries [Citation11]. These models give an insight into the recrystallization behaviour and the mechanisms of recrystallization texture formation. However, to date, there is no common theory or systematic understanding that can predict the evolution of recrystallization texture in various materials.
Furthermore, stacking fault energy (SFE) is the most critical parameter in the development of deformation texture and microstructure, and thereby it also plays a very important role in the evolution of recrystallization texture. In general, SFE can be varied by the addition of alloying elements [Citation26]. However, there are many examples where the normalised stacking fault energy does not change much despite alloying addition. Typical examples of this type of material are Ni-Fe alloys and Cu-Mn alloys [Citation25,Citation26]. In the Ni-Fe system, the addition of up to 40 wt. % of Fe does not lead to a change of the normalised stacking fault energy. In this system, the effect of alloying elements manifests in the form of solid solution hardening and influences the micro-mechanism of deformation, hence the evolution of microstructure and deformation texture and later in the development of recrystallization texture [Citation26]. There are four ways by which alloying elements may affect the recrystallization texture development: (i) twinning can provide new nuclei orientations; (ii) micro/shear band formation, may provide additional nucleation sites and new nuclei orientation; (iii) changes in the deformation texture may yield different conditions for growth of nuclei (oriented growth); and (iv) alloying elements in solid solution may strongly retard grain boundary mobility and it can eventually suppress growth selectivity [Citation6,Citation27].
The present study is aimed at examining the effect of solid solution on the development of recrystallization texture in FCC metals and alloys where SFE remains unchanged on alloying addition. Further, an effort has been made to correlate recrystallization texture with the deformed and recrystallized microstructural feature, at various stages of recrystallization. Ni-Fe alloys have been chosen for the present investigation for the following reasons: (i) solid solubility of iron in nickel without any transition in crystal structure up to 40 wt.% Fe, (ii) no significant change in the normalised SFE of the system, (iii) no deformation texture transition of the alloy system with iron addition. It has been reported that addition of iron to nickel does not alter the normalised stacking fault energy (γ/Gb) (where, G – shear modulus, b – Burgers vector) of pure Ni (120 mJ/m2 [Citation28]), which is a high SFE material. However, it results in a change in the deformation mechanisms and the formation of substantial amounts of micro and shear banding after deformation [Citation29]. There are very few studies available on the impact of solute atoms on the recrystallization texture development, which is independent of variation in stacking fault energy (SFE) of the system [Citation30–32]. Engler [Citation30] has done a such study in a series of Cu-Mn alloys and found that additional recrystallization texture components such as α-fibre orientations and {236}<385> (BR-orientation) started appearing along with cube orientation on increase in Mn-content in the alloy. It was attributed to gradual rolling texture with increasing Mn-content [Citation30]. In the Ni-Fe alloys system, there is no such rolling texture transition occurs with Fe addition and the rolling texture remains Cu-type (pure metal type) [Citation26,Citation31]. So, Ni-Fe alloy is the most ideal to study the independent effect of solutes on the evolution of recrystallization texture. Efforts have been made to systematically investigate the recrystallization texture evolution in Ni-Fe alloys and address the mechanism of nucleation. The role of different deformed orientations and deformation heterogeneities such as micro/shear bands in the process of nucleation is also discussed in detail. Efforts have been also done to simulate the phenomena using the cellular automata simulation technique supported by experimental findings.
2. Material and methods
2.1. Experimental
2.1.1. Alloy preparation and material processing
Pure Ni, and Ni-Fe alloys with nominal compositions Ni20wt.%Fe, and Ni40wt.%Fe (hence forward will be referred to as Ni, Ni-20Fe, and Ni-40Fe, respectively) were melted in a vacuum arc furnace using high purity nickel and iron granules. As-cast materials consist of solidification dendrites and strong textures. In order to avoid its effects on our recrystallization studies, the as-cast material was cross-rolled (∼50%) to break the dendritic features and followed by homogenisation annealing in vacuum for 12 h. It produces equiaxed strain-free grain with weak texture, which was used as starting material for further studies. The compositions of the alloys were measured using energy dispersive spectroscopy (EDS). The so-obtained materials were treated as the starting materials and were rolled at room temperature to 70% thickness reduction (a true strain of ∼−1.2). The rolled materials were cut into small pieces of size 12 × 10 mm and annealed isothermally in a muffle furnace at 700°C for different time intervals, namely 60, 65, 75, 90, 105, 120, 135, 150, 180, 240, 300, 360, 480 and 600 s.
2.1.2. Characterisation techniques
Microstructural characterisation of rolled and recrystallized samples was performed on the ND-RD plane using a scanning electron microscope (SEM), equipped with electron back-scattered diffraction (EBSD) system in the FEI Helios NanoLab system. Samples for EBSD scans were metallographically polished and then electro-polished using A2 solution (Struers). For the EBSD scans, SEM was operated at 25 kV. For deformed samples, a step size of 100 nm was used while for the fully recrystallized samples, it was 500 nm. Data analyses were performed using TSL OIM 8.5 software.
X-ray diffraction (XRD) and bulk texture measurements on all the samples were carried out using an X-ray texture goniometer with CoKα radiation (D8 Discover, Bruker AXS, Germany). The measurements were performed at the mid-thickness sections of the samples. Four incomplete pole figures (α = 0–75°) were measured from the 111, 200, 220, and 311 peaks on the rolling plane of the samples. Three-dimensional orientation distribution functions (ODFs) were calculated using the MTEX toolbox integrated with MATLAB software following the harmonic series expansion (L = 16) technique [Citation33,Citation34]. Also, while calculating the volume fraction of different texture components, overlapping of orientation was avoided and a 10° tolerance angle was used.
2.2. Simulations
The process of recrystallization is sensitive to multiple parameters such as composition, annealing temperature, grain-boundary mobility, impurity drag effects, crystallographic texture, microstructure inhomogeneity, etc. All these parameters interact with each other in a nonlinear fashion [Citation35–38]. All the past efforts in simulating recrystallization texture can be divided into two broad categories: statistical and spatially discrete models [Citation39,Citation40]. Under the statistical model, various statistical variants of the original JMAK approaches were suggested to predict recrystallization textures [Citation41,Citation42], e.g. Bunge–Köhler transformation model [Citation43] and the Gottstein kinetic model variants [Citation44]. In these models, growth of the newly formed nuclei is assumed to be isotropic, however, it ceases when the nuclei impinge with other new grains [Citation45–47]. Statistical JMAK-type neglects important local features of the microstructures such as grain topology, different interfaces, and the local curvature of an interface. In the spatially discrete models, the influence of local grain boundary characteristics (mobility, energy), the local driving forces, and local textures are of particular interest [Citation30,Citation48]. These models can be practically used to predict microstructural parameters such as grain size and crystallographic texture [Citation47,Citation48]. The most popular spatially discrete models are cellular automata [Citation49–52], Potts-type Monte Carlo multi-spin models [Citation53], and vertex (front-tracking) models [Citation54,Citation55].
The current study uses the cellular automata model to simulate recrystallization texture due to its many advantages over other models. Cellular automata are algorithms that describe the discrete spatial and temporal evolution of complex systems by applying local transformation rules to lattice cells that represent volume portions. For the recrystallization model, the state of each lattice site is characterised in terms of a set of internal state variables such as lattice defect quantities (stored energy) and crystal orientation [Citation56,Citation57].
For the simulations, the model P-CORe developed by Kühbach et al. was utilised [Citation58]. This CA model considers a front-tracking approach [Citation59], where recrystallization proceeds gradually by grain boundary migration. For the simulations, a synthetic microstructure was generated using the software MicroGen developed at the IMM of the RWTH-Aachen [Citation59]. This software utilises the experimentally determined grain size, texture, orientation-dependent dislocation densities, and information on the recrystallization nuclei to approximate the deformation microstructure before recrystallization. Upon completion of the synthesis process, the CA domain comprised a total of 10003 cells distributed into 20000 deformed grains. Each cell represented a volume of (1 µm)3 in each case. For generating the microstructures, the experimentally determined deformation texture was used as an input for the model. Furthermore, grain orientation spread (GOS) values obtained from TSL OIM 8.5 software were used to differentiate the stored energy corresponding to different orientations after deformation. The overall dislocation density of the materials after deformation was calculated using convolutional multiple whole profile fitting (CMWP) of the X-ray diffraction pattern [Citation60]. The CA model is essentially a pure growth model that requires a separate nucleation model. Here, modelling of the nucleation process was based on experimental observations during incipient recrystallization. In the present investigation, different nucleation mechanisms such as grain boundary nucleation, transition band nucleation, micro and shear band nucleation, and recrystallization twinning were studied. In the simulations, the orientations of the nuclei placed at grain boundaries deviated from that of the parent grain by a value randomly chosen between 5° and 10° [Citation57–59]. For nuclei inside the grains (a bulk mechanism), the orientations of nuclei were sampled from those determined experimentally. It should be noted that the simulation code does not incorporate the phenomena of twinning under annealing. The orientations of the grains that form because of annealing twinning were sampled from those determined experimentally during the initial stage of recrystallization. Afterward, simulations with different relative number densities of nuclei were performed [Citation61–63]. Based on the assumption that the nucleation rate scales with the dislocation density difference, we defined the parameter for nucleation efficiency ϵi with which the Ntotal nuclei were partitioned onto each grain boundary i:
(1)
(1) where Ai denotes the number of cells that construct a particular grain boundary face discretely. Ni defines the number of nuclei that are placed at a grain boundary i. The dislocation density difference is quantified by
(the indices Ga and Gb refer to neighbouring grains of i).
It is noted that the efficiency ϵi considers the number of cells associated with a specific grain boundary. Besides, homogeneous nucleation in the bulk and heterogeneous nucleation at grain boundaries, transition bands, and shear bands was considered. The nucleation was simplified in such a way that the distribution of nuclei on grain boundaries was derived from the mean dislocation densities of the neighbouring grains. The grain boundary mobility data was taken from different sources of literature and listed in [Citation64–69].
Table 1. The grain boundary mobility during nucleus growth used in the simulation [Citation64–69].
3. Experimental results
3.1. Starting material
(a–c) shows the EBSD IPF map of the starting materials, after the cross-rolling and homogenisation annealing, as mentioned in section 2.1.1. These micrographs show equiaxed grains with some annealing twins in each case. The average grain size for pure Ni, Ni-20Fe, and Ni-40Fe were 185 ± 16, 190 ± 12, and 180 ± 15 μm respectively.
Figure 1. IPF map of initial samples on ND plane for (a) Ni, (b) Ni-20Fe (c) Ni-40Fe, (d) X-ray diffraction patterns, and (111) pole figure of (e) Ni, (f) Ni-20Fe, (g) Ni-40Fe.
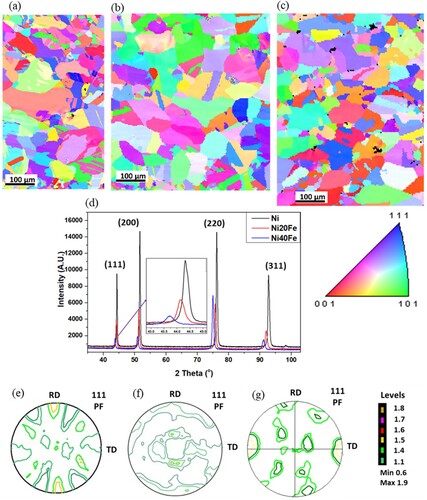
(d) shows the X-ray diffraction patterns of the starting materials. Analysis of the peaks confirms the face-centered cubic (FCC) structures Ni-20Fe and Ni-40Fe, similar to pure nickel. No extra peaks were observed for Ni-20Fe or Ni-40Fe alloys. However, there is a shift of peak position towards the left side can be seen on the addition of Fe to pure Ni. An enlarged view of the 111 peaks showed a shift of 0.6° towards the left for Ni-40Fe compared to pure Ni (d). It is because of a change in lattice parameter (d-spacing) of the alloy as a result of Fe-addition. (e–g) shows the (111) pole figures of Ni, Ni-20Fe, and Ni-40Fe, in the starting condition. The maximum intensity was found to be below 1.8 m.r.d. indicating weak textures.
3.2. Microstructure and texture of the deformed materials
shows the inverse pole figure (IPF) maps superimposed with image quality (IQ) map of the samples after 70% cold-rolling on ND–RD plane. The microstructure of pure Ni has a lamellar morphology consisting of large, elongated grains of different orientations aligned along the rolling direction with large intra-grain orientation gradients ((a)). A gradual development of misorientation is observed from the grain interior to the grain boundaries in most of the grains. Some micro-bands can be seen in Cu-oriented grains of pure nickel. The grains with Bs or Goss orientations are relatively homogeneously deformed. No deformation heterogeneities such as deformation twining, or shear banding are observed. The rolling deformation causes the grains ultimately converge towards the ideal pure metal rolling texture components, i.e. Cu, S, and <110> ∥ ND orientations ((a)).
Figure 2. IPF + IQ superimposed map of 70% cold rolled (a) pure nickel, (b) Ni-20Fe, (c) Ni-40Fe. Red circled region shows the appearance of shear banding in Ni-Fe alloys. The IPF colour coding refers to a direction parallel to ND, X-ray bulk texture showing constant φ2 = 0°, 45°, 65° sections of ODF of 70% cold rolled (d) pure nickel, (e) Ni-20Fe, (f) Ni-40Fe, (g) a key ODF showing ideal texture components. Orthotropic specimen symmetry has been assumed while plotting the ODFs from experimental pole figures.
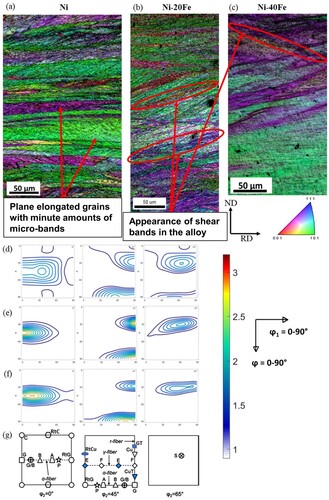
The microstructure of the 70% cold-rolled sample of the Ni-20Fe alloy displays elongated grains with a considerable number of bands within most of the grains (TBs, MBs) and also across the grains (SBs), marked by red circles in (b). The thickness of these bands is less than 1 μm which can be termed as confined shear bands. The microstructure of 70% cold-rolled Ni-40Fe sample also displays elongated grains along the rolling direction and substantial banding distributed in the overall microstructure ((c)). Here, the bands are thicker compared to Ni-20Fe and spread across the grains. The disposition of bands is quite different from the Ni-20Fe alloy.
Similar to pure Ni, both the Ni-Fe alloys show a gradual development of misorientation from the grain interior to the grain boundaries in most of the grains. Overall, both Ni-Fe alloys display a relatively heterogeneous deformation compared to pure Ni and produce a substantial amount of new interfaces (TBs, MBs, and SBs) [Citation29]. As mentioned earlier, the SFE of the Ni-Fe system does not change due to Fe and hence, the development of the recrystallization texture is likely to be independent of SFE but to be affected by solid solution strengthening and the presence of additional interfaces caused by deformation.
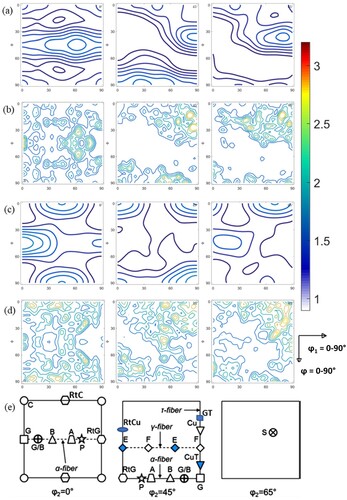
(d–f) shows the constant φ2 = 0°, 45°, 65° sections of orientation distribution function (ODF) for 70% cold rolled pure Ni, Ni-20Fe, and Ni-40Fe. In all the cases, the ODF shows the formation of similar deformation texture (Cu-type) components, as reported in [Citation29]. However, Ni-Fe alloys show relatively higher intensity levels. VPSC simulations have also predicted similar texture formation of Ni-Fe alloy [Citation29]. The results indicate the development of copper-type texture (Cu {1 1 2}<1 1 1>, Bs {1 1 0}<1 1 2> and S {1 2 3}<6 3 4> components) in all the cases, a characteristic of high SFE materials, however, with variation in the relative intensities of Cu, Bs, and S components. Pure Ni shows almost equal intensity of Cu and Bs components, whereas both the Ni-Fe alloys show a higher intensity of Bs compared to Cu component. Considerable amounts of near S orientation i.e. R {1 2 3}<4 1 2> and Taylor {4 4 11}<11 11 8> components are also present in each case. The texture of Ni-20Fe also consists of some amount of Goss orientation, while that of Ni-40Fe displays a weak spread of orientations along the α-fibre.
3.3. Evolution of recrystallization texture during annealing
3.3.1. Recrystallization texture of pure nickel
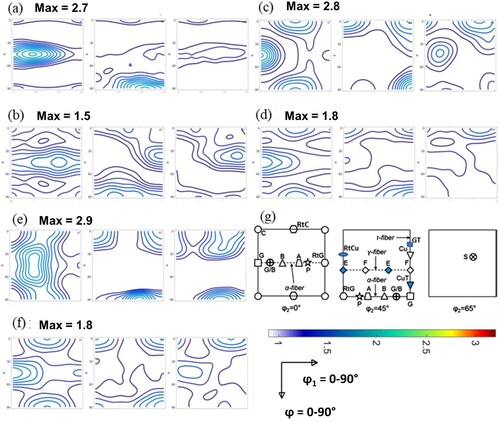
(a,b) shows the φ2 = 0°, 45° and 65° sections of ODFs of 20% recrystallized (20% RX) and full recrystallized (100% RX) samples for pure nickel. After 20% RX, the texture primarily consists of cube components, along with some intensities along α and γ fibres ((a)). The weakening of certain deformation texture components such as Cu and S can also be seen. After 100% RX, the texture consists of cube component, a complete α-fibre (0–90, 90, 45) with a peak at the location ‘A’ (35, 90, 45), a weak cube-fibre (0–90, 0, 0), and a minor component at (45, 0, 45). Most of the deformation texture components are also present albeit with a weaker intensity ((b)). Full recrystallization results in disappearance of γ-fibre (0–90, 55, 45) components which formed during the early stage of recrystallization. Overall, texture weakening occurs with the progress of recrystallization along with the formation of some new texture components and retention of some of the components of deformation texture. The weakening or disappearance of some texture components also involved those orientations, which formed during early stages (nucleation) of recrystallization. This implies that all the nuclei that formed during early stage of nucleation do not grow necessarily. Orientations that grow during the later stage of recrystallization, appear to have formed either as a result of formation of annealing twin (<111>/60° misorientation), or growth selectivity (<111>/40° misorientation), which favours some orientations to grow over other.
Figure 3. The constant φ2 = 0°, 45°, 65° sections of ODF of (a) Ni 20% recrystallized (75 s annealing), (b) Ni 100% recrystallized (120 s annealing), (c) Ni-20Fe 20% recrystallized (135 s annealing), (d) Ni-20Fe 100% recrystallized (180 s annealing), (e) Ni-40Fe 20% recrystallized (135 s annealing), (f) Ni-40Fe 100% recrystallized (180 s annealing), (g) a key ODF showing the location important texture components (C – cube, G – Goss, Cu – Copper, B – Brass). Orthotropic specimen symmetry was assumed while plotting the ODFs.
3.3.2. Recrystallization texture of Ni-Fe alloys
(c,d) displays the φ2 = 0°, 45° and 65° sections of ODFs of 20% recrystallized (20% RX) and full recrystallized (100% RX) samples for Ni-20Fe. As mentioned earlier, cold-rolled Ni-20Fe shows a copper-type rolling texture, like pure nickel. Some Goss orientation also develops during deformation ((e)). After 20% RX, weakening of all the deformation texture components such as Cu, Bs, S, and Goss can be seen, plus appearance of rotated cube (0, 45, 0), (30, 45, 65) and (75, 0, 65) orientations ((c)). The ODF also indicates an early sign of formation of α-fibre ((c)). Some new orientations such as A (35, 90, 45), P (30, 90, 45), E (0, 55, 45), F (30, 55, 45), rotated cube (RtC) (45, 0, 0), and brass recrystallization (BR) (78, 31, 33) also develop during the initial stage of recrystallization. These components were already present in very minute amounts after deformation. Formation of some of these components e.g. BR-orientation was also reported during recrystallization of Cu-Mn alloys, which was attributed to the presence of shear bands in the deformed microstructure [Citation30].
After complete recrystallization, a widespread rotated cube (45, 0, 0) component is observed (which has formed at early stages of recrystallization), formation of complete α-fibre (0–90, 90, 45) with a peak at the location of Goss component (90, 90, 45) ((d)). It also shows some orientation such as (30, 45, 65) and (75, 0, 65) which was noticed after 20% RX ((d)). Overall, a weakening of the texture was observed with retention of some of the deformation texture components along with the formation of some new orientations.
The recrystallization texture of Ni-40Fe is shown in (e,f). After 20% RX, a weakening of all the components of deformation texture and the start of formation of α-fibre during early stage of recrystallization ((e)) is clearly discernible. The texture of Ni-40Fe primarily consists of rotated cube (0, 45, 0), and (75, 0, 65) components, like Ni-20Fe ((e)). An additional peak at (75, 90, 65) location can be seen. Like Ni-20Fe, some new orientations such as A (35, 90, 45), E (0, 55, 45), F (30, 55, 45), rotated Goss (RtG) (0, 90, 45), rotated cube (RtC) (45, 0, 0), rotated Cu (RtCu) (0, 35, 45), Cu twin (CuT) (90, 74, 45), and brass recrystallization (BR) (78, 31, 33) do form during the initial stage of recrystallization of Ni-40Fe alloy. After complete recrystallization, a widespread rotated cube (45, 0, 0) component, and a complete α-fibre (0–90, 90, 45) with peaks at Goss (90, 90, 45) and rotated Goss (0, 90, 45) location are observed ((f)). Some other orientations such as (30, 45, 65) and (75, 0, 65) are also noticed. Overall recrystallization proceeds with texture weakening along with the formation of some new texture components such as rotated cube and retention of some of the deformed texture components, as in Ni-20Fe.
The main similarities in the recrystallization textures of pure Ni and Ni-Fe alloys are: (i) formation of a complete α-fibre texture with peak intensity at a different location in difference cases, and (ii) overall weakening of the deformation texture. The major differences are (i) the formation of some cube orientation (0, 0, 0) in pure Ni that was absent in Ni-Fe alloys, and formation of rotated cube (45, 0, 0) and BR (78, 31, 33) components in both the Ni-Fe alloys that are not there in the case of pure Ni. This indicates the role of micro and/or shear bands in the formation of recrystallization texture. presents a quantitative comparison of recrystallization texture of Ni and different Ni-Fe alloys, as a function of recrystallization.
Table 2. Comparison of Ni and Ni-Fe alloy for change in volume fraction of important texture components as a function of recrystallization.
3.4. Evolution of microstructure during annealing
The microstructure of cold-rolled pure Ni shows elongated grains along the rolling direction, with minute deformation heterogeneities, whereas deformation heterogeneities are quite prominent in the microstructure of cold-rolled Ni-Fe alloys. To understand the evolution of microstructure during nucleation and growth distinctly, EBSD was carried out at different stages of recrystallization. illustrates the IPF maps superimposed with IQ map of 70% cold-rolled Ni and Ni-Fe alloys annealed for different time periods. During the start of recrystallization, the presence of large numbers of micro-bands in Cu-oriented grains can be observed. The Bs-oriented grains are relatively homogeneously deformed with less intra-grain orientation gradient ((a,d,g).
Figure 4. IPF + IQ superimposed map of 70% cold-rolled, Ni after (a) 60 s, (b) 75 s, (c) 105 s, Ni-20Fe after (d) 120 s, (e) 150 s, (f) 480 s, Ni-40Fe after (g) 120 s, (h) 150 s, (i) 480 s, annealing at 700°C. Orange arrows indicate Gb nucleation, red circled regions indicate shear band nucleation and growth along it, yellow circle shows the formation of annealing twins. The IPF colour coding refers to a direction parallel to ND.
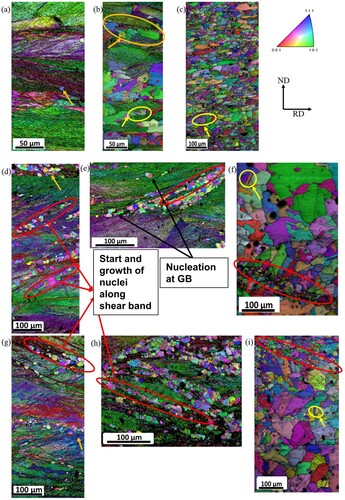
In all the cases, the nucleation begins at grain boundaries adjacent to the Cu-oriented grains, especially where microbands intersect with a grain boundary (indicated by orange arrow in (a)). The intersection points of bands and high-angle grain boundaries are the most energetically favourable interface for nucleation due to very high defect density at these locations. This also provides a growth advantage along the band. It can be noted that all the new grains lie either along the grain boundaries (orange arrow) or along the transition and/or micro-bands (shown by red circle) ((d)). Since the deformed microstructure of both the Ni-Fe alloys consists of a high fraction of micro and shear bands, nucleation in the Ni-Fe alloys predominantly occurs at these features, contrary to pure Ni where it predominantly at grain boundaries ((d,g)).
In pure Ni, the orientations of nuclei seem to stem from one of the neighbouring sub-grains. On the other hand, in Ni-Fe alloys, some of the nuclei within the band have the orientation similar to the grains adjacent to them, whereas other nuclei have completely different orientations. Since the thickness of shear bands is larger in Ni-40Fe than Ni-20Fe, the number of grains nucleating within a single shear band is higher compared to Ni-20Fe. Shear bands have more often random orientations. In 20%RX condition pure Ni displays new grains formed mostly along the grain boundaries ((b)). Both the Ni-Fe alloys show nuclei in the grain interior as well as along GBs and deformation bands. The orientations of these nuclei are completely different from their surrounding deformed matrix ((e,h)). Nuclei grow faster along the grain boundary and slower within the interior of the deformed grains. In this process, the formation of numerous annealing twin boundaries (shown by a yellow circle) ((b)) occurs, which is likely to influence the development of recrystallization texture.
The abundance of annealing twins can be seen during the later stages of recrystallization that further resulted in texture weakening. Growth of new grains is slower in grains oriented as <110> || ND due to homogeneous deformation within, thus these grains are the last ones to recrystallize. The IPF + IQ map of fully recrystallized Ni shows fine distribution of grains seemingly equiaxed but slightly elongated along the RD of many different orientations having a grain size in the range of 10–60 μm ((c)). The size of grains depends on their nucleation site. More grains nucleate in highly deformed regions (transition and micro-bands) resulting in small grain size. Fully recrystallized Ni-20Fe and Ni-40Fe alloys show a bimodal distribution of equiaxed grains of size ranges 5–20 and 50–100 μm, respectively. The bimodal distribution of grain size is due to the nature of nucleation sites ((f,i)).
3.5. Grain boundary character distribution
3.5.1. Misorientation angle distribution
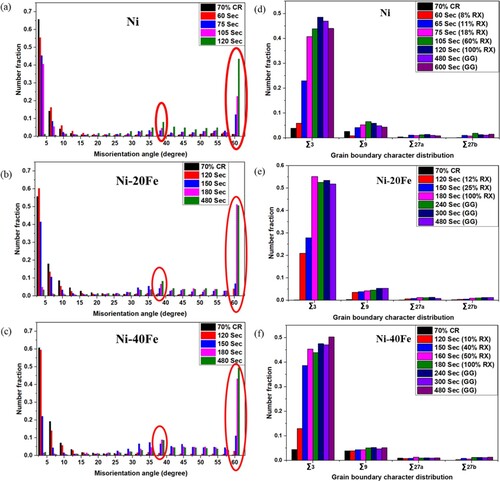
In the microstructures of all the recrystallized materials, numerous twin boundaries were present. The misorientation profile at different stages of recrystallization, displayed in (a–c) indicates that the fraction of low angle misorientation (<10°) is very high in the as-deformed state, and after annealing the fraction of HAGBs (>15°) starts increasing with annealing time. However, the increase in the fraction of HAGBs is not uniform along different misorientation angles. For all three alloys, there is a sharp increase in the fraction of HAGBs corresponding to 38–40° and 60° misorientations. After complete recrystallization, the number fraction of boundaries with a misorientation angle of 60° appears to be high, ∼ 40% in pure Ni and more than 50% in both the Ni-Fe alloys. It is well known that <111>/60° and <110>/38.9° misoriented boundaries are the Σ3 and Σ9 twin boundaries, respectively [Citation6]. Consequently, annealing twin boundaries seem to play a very important role during recrystallization of pure Ni, and Ni-Fe alloy. Since annealing twins produce grains of new orientations, the evolution of recrystallization texture is quite likely to be dictated by this phenomenon.
Figure 5. Grain boundaries misorientation profile of 70% cold-rolled material as a function of annealing time (a) pure Ni, (b) Ni-20Fe, and (c) Ni-40Fe, bar plot showing the grain boundaries character distribution (CSLs boundaries) of 70% cold-rolled material as a function of annealing time (d) pure Ni, (e) Ni-20Fe and (f) Ni-40Fe. It shows that all the stages of recrystallization are dominated by the formation of 1st and higher-order twin boundaries.
3.5.2. Grain boundaries character distribution
To further examine the role of special (CSLs) boundaries during recrystallization of pure Ni and Ni-Fe alloys, the fraction of different CSLs were plotted as a function of annealing time in (d–f). In the case of pure Ni, at the early stage of recrystallization (11% RX), the fraction of Σ3 (60°/<1 1 1>) and Σ9 (38.9°/<1 1 0>) boundaries were found to be almost 20% and 4%, respectively. After 20% recrystallization, this value increases to 40% and 6%, respectively. After 100% recrystallization, the fraction of Σ3 and Σ9 boundaries was 50% and 7%, respectively. This implies that during the initial stage of recrystallization the Σ3 and Σ9 boundaries form and grow at a very high rate, while these boundaries saturate at later stages. Both the Ni-Fe alloys respond like pure Ni in this regard with slightly less fraction of sigma boundary in the initial stages and a higher fraction during the last stage of recrystallization. This could be due to the presence of high amount of shear bands and other localised deformation features in the deformed microstructures of both the Ni-Fe alloy. Such features could act as the initial nucleation site and produce large numbers of nuclei, which are generally surrounded by mostly random HAGB initially. However, when it starts growing in the deformed matrix it also produces large numbers of annealing twin (Σ3) boundaries. After complete recrystallization in all the cases, the fraction of Σ boundaries is ∼50%.
(a–c) shows the distribution of the CSL boundaries superimposed on IQ maps of 25% recrystallized pure Ni, Ni-20Fe, and Ni-40Fe, respectively. In all cases, most of the Σ boundaries lie in the recrystallized region of the grains. This also implies that there is an abundance of Σ3 boundaries between new recrystallized grains. In Ni-Fe alloys, the network of Σ3 boundaries is more complex compared to pure Ni. For instance, pure Ni shows more numbers of a straight parallel type of twin boundary, whereas Ni-Fe alloy shows curved and complex networks of boundaries. (d) shows a schematic representation of different types of Σ3 boundaries based on their shape within a grain (type a-h).
Figure 6. CSLs distribution superimposed on IQ maps of 25% recrystallized, (a) Ni, (b) Ni-20Fe, (c) Ni-40Fe, (d) a schematic representation of different type of Σ3 based on their shape within a grain (a-h). For each type of boundary, a representative name has also been given.
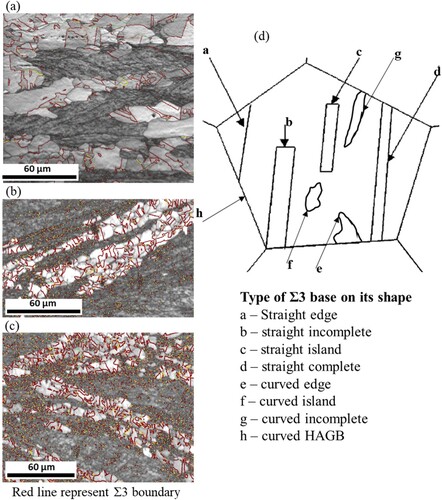
In the case of pure Ni, both straight and curved types of Σ3 boundaries are present. Out of straight type, mostly edge (a), incomplete (b), and complete (d), Σ3 boundaries are present ((a)). No straight island (c) type of Σ3 boundaries could be seen in the case of pure Ni. Out of curved type, edge (e), and incomplete (g) Σ3 boundaries are present. There are no curved island (f) and curved HAGB (h) type Σ3 boundaries. Contrary to pure Ni, the Ni-Fe alloys showed mostly curved type Σ3 boundaries, however, some of the straight boundaries are also present ((b)). These alloys showed the presence of type (e), and (g) in very high fractions whereas type (a), (d), and (h) were found at moderate fractions. Type b, c, and f were absent. This indicates that their different mechanisms are operating for the formation of Σ3 boundaries in pure Ni and Ni-Fe alloys. Alternatively, it can be perceived that the contributions from different mechanisms, which produce differently shaped Σ3 boundaries, are different for pure Ni and Ni-Fe alloys. However, in all cases the formation and mobility of the Σ3 boundary will have a substantial impact on the evolution of recrystallization texture. The reason behind more complex network and curved nature of Σ3 boundaries in the case of Ni-Fe alloy could be the presence of substantial shear-banding and other localised deformation heterogeneities in the deformed microstructure, which leads to formation of large numbers of nuclei in a certain localised region.
3.5.3. Grain boundary plane distribution associated with Σ3 boundary
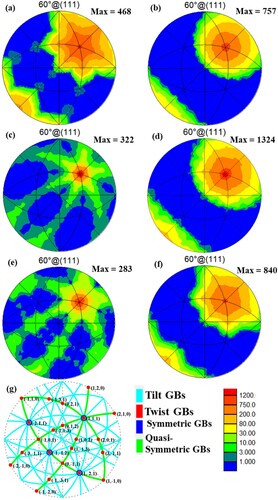
To further examine the role of special (Σ) boundary during recrystallization of pure Ni and Ni-Fe alloy, the coherency of the boundary was checked by plotting corresponding common grain boundary plane distribution (GBPD). GBPD corresponding to Σ3 i.e. <111>/60° misoriented boundary was plotted using TSL 8.2 software. Krzysztof Glowinski’s grain boundary toolbox (GB Toolbox) [Citation70] was used to generate geometrically characteristic boundaries of a fixed misorientation and compared them with grain boundary character distribution. The CSL model has proved itself as a useful description of boundaries allowing the study of their structure and energy [Citation71]. The CSL descriptor, incorporating the grain boundary plane normal, leads to a natural distinction between pure tilt boundaries and pure twist boundaries. (a,b) represents the grain boundary plane distribution (GBPD) associated with Σ3 (<111>/60°) misorientation in 70% cold-rolled pure Ni after 25% and full recrystallization, respectively. (g) shows the stereographic representation of calculated geometrically characteristic boundaries associated with Σ3 (<111>/60°) misorientation. During the initial stage of recrystallization (25% RX), most of the Σ3 CSLs with misorientation around <111>/ correspond to symmetric twist boundaries. It also correlates with other studies performed on Ni [Citation73,Citation74]. It denotes that a large fraction of Σ3 boundary produced during the initial stage of recrystallization corresponds to {111} plane, and it suggests the appearance of {111}/{111} coherent twin boundary of symmetric twist type. However, a large spread of intensity about {111} plane can be seen, which suggests that these are therefore not all {111} planes and are instead either vicinal-to-{111} or other ATGBs, or other symmetric boundaries. It could be formed by Σ3 regeneration, multiple twinning, or some other event during the growth of nuclei during recrystallization [Citation64]. The energy of all these boundaries is higher than the coherent twin boundary. However, their energy will be lesser compared to random grain boundaries due to the appearance of the local energy minima cusp. This is because they are near Σ3 boundaries and thus will have a similar structure. Differences in structure can be explained by the CSL model. Thereby, the Σ3 boundaries with boundary plane other than {111} form preferentially during the growth of nuclei, when it encounters a new deformed grain with favourable conditions (orientation near to one of the Σ3 variants). The mobility of all these types of Σ3 boundaries is higher than the coherent twin boundary [Citation72–74].
Figure 7. Grain boundary plane distribution associated with Σ3 (111/60°) misorientation in pure Ni (a) 25% RX, (b) 100% RX, in Ni-20Fe (c) 25% RX, (d) 100% RX, in Ni-40Fe (e) 25% RX, (f) 100% RX (g) stereographical representation of calculated geometrically characteristic boundaries associated with Σ3 (111/60°) misorientation.
It can be said that the formation of mostly immobile Σ3 coherent twin boundaries is most likely whereas either vicinal-to-{111} or other ATGBs Σ3 boundaries form less frequently. In terms of frequency, the formation of incoherent twin boundaries corresponding to a (1 1 2) boundary plane was third. Afterward, the formation of other symmetric twist boundaries, such as corresponding to (1 1 3) or (1 2 0) boundary planes having even higher energy and mobility but still preferable over random HAGB occurs. The least likely formation is that of normal random grain boundaries when there is no favourable condition for the formation of any kind of symmetric grain boundary. There will be exceptions when nuclei form and grow in highly localised deformed regions due to a very high driving force. As a result, the type of HAGB, the grain boundary misorientation, or the grain boundary plane will not matter in those cases.
In the present study, pure Ni and both Ni-Fe alloys, 25% recrystallized sample displays a high fraction of symmetric twist Σ3 boundary which corresponds to {111} plane. These boundaries are coherent twin boundaries (least mobility) ((a,c,e)). It also shows other vicinal-to-{111} boundary planes because of spread near {111} peak having peak intensity of about 300. However, in Ni-Fe alloys, this spread and peak intensity of the coherent boundary plane is lesser than in Ni. Apart from that all the samples also show other quasi symmetric Σ3 twist grain boundary planes such as {1 2 0}, {2 1 0}, {0 2 1}, {−2 −1 0}, {−1 −2 0}, {−1 3 1}, and {3 −1 1} ((a,c,e)). These boundary shows a local minimum of energy and is preferable over random boundaries. However, these boundaries are highly mobile compared to coherent Σ3 grain boundaries and play an important role during the growth of nuclei in the deformed microstructure [Citation72,Citation73]. Pure Ni also shows a minor peak at the (1 1 2) family of planes, which is an incoherent Σ3 boundary whose mobility is sufficiently high in deformed microstructure during the growth of nuclei ((a)) [Citation73,Citation74]. Ni-Fe alloys do not show a peak corresponding to the {112} plane (incoherent Σ3 boundary). Both the Ni-Fe alloys show a relatively intense peak compared to pure Ni, at the (1 1 0) family of planes, which is a quasi-symmetric Σ3 twist boundary. Its mobility is sufficiently high, and it can migrate in the deformed microstructure during the growth of nuclei ((c,e)). The reason behind the higher fraction of (110) boundary plane Σ3 boundary could be the formation and growth of nuclei in shear bands and other localised deformed regions. Since those deformation heterogeneities were not present in the case of pure Ni, the Σ3 boundary corresponding to the (110) grain boundary plane was scarce. In all the cases, large numbers of tilt-type Σ3 grain boundaries can also be seen whose mobility is below the random boundaries but preferable to form because of less energy and special character.
After complete recrystallization, an increase in the intensity (757) of the coherent Σ3 grain boundary plane occurs ((b)). For Ni-Fe alloys, this increase in intensity is higher and almost 1.2–1.6 times compared to pure Ni ((d)). Also, in the case of Ni, the spread around {111} decreased, which means that there was a reduction in the fraction of other symmetrical boundaries during the last stage of recrystallization because of the formation of large numbers of coherent boundaries ((b)); the peak corresponding to incoherent boundaries almost disappeared. In Ni-Fe alloys, the spread around {111} has not reduced, which means that there is an increase in the fraction of other Σ3 symmetrical boundaries also during the last stage of recrystallization ((d,f)). It is also reflected in the recrystallized microstructure as a large fraction of curved type of Σ3 boundaries.
4. Results of computer simulations
4.1. Recrystallization microstructure
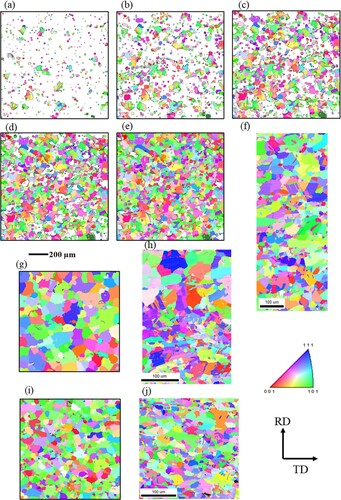
The evolution of simulated recrystallized microstructure through IPF maps of Ni, and both Ni-Fe alloys are shown in . After full recrystallization, it was compared with the experimental IPF map. The nucleation mechanism obtained through experiments was incorporated in the simulation, i.e. nucleation by subgrain coarsening at grain boundaries, nucleation at shear bands, and uniform distribution of experimental nuclei orientation in bulk nucleation. The initial grain size distribution, an accurate grain boundary mobility, and accurate selection of acting nucleation mechanisms are the key factors for the precise prediction of recrystallized microstructure and its kinetics. One difference between the simulations and experiments is that necklacing is more prominent in the experiments. This occurs because the probability of nucleation is very sensitive to the relative difference in dislocation density across a boundary. This seems to indicate that grain boundary nucleation is slightly underestimated in the model. To improve the quality of the simulations, a better estimation of the dislocation densities would be needed since nucleation at grain boundaries is a function of the difference in dislocation densities across the boundary. This can be done by CP-FEM simulations [Citation75] or a more accurate experimental determination [Citation76]. However, the simulated IPF matches quite well with the experimental one in all the cases in terms of grain size, shape, and orientation. This points out that the estimation of the dislocation density is accurate enough for making a reliable prediction of the main characteristics of the microstructure. The introduction of twinned orientation as nuclei orientations was done for a better prediction of complete crystallographic orientation since the current CA simulation has not incorporated explicitly twinning yet. Using this method, a good agreement with experimental microstructures and textures was obtained.
Figure 8. Simulated Inverse pole figure (IPF) map of 70% rolled pure Ni at different level of recrystallization at 700°C (a) 10%, (b) 30%, (c) 50%, (d) 80%, (e) 100% recrystallized, (f) experimental IPF map of 100% recrystallized pure Ni, for comparison, IPF map of Ni-20Fe after full recrystallization (g) simulated, (h) experimental, and simulated IPF map of Ni-40Fe after full recrystallization (i) simulated, (j) experimental, for comparison.
4.2. Recrystallization texture
shows the experimental and simulated constant φ2 = 0°, 45°, and 65° sections of ODF of 100% recrystallized pure Ni and Ni-40Fe. In all the cases, simulated ODFs match the experimental ones, with the former being stronger since the number of orientations used to compute the experimental ODF is larger than in simulations. Further, the simulated ODFs show some additional texture components with small intensities, which were not found experimentally. This is most likely caused by the nucleation at shear bands where random orientations are generated. Some of these orientations may not be present in the experimental texture. It is well known that nuclei originating within these regions tend to randomise the texture. It is to be mentioned here that no fitting parameters were used for the simulations. The volume fraction of most of the components matches quite well within 2% by volume.
Figure 9. Comparison of the constant φ2 = 0°, 45°, and 65° sections of ODF of 100% recrystallized pure Ni (a) experimental, (b) simulated, Ni-40Fe (c) experimental, (d) simulated, (e) a key ODF showing the location important texture components (G – Goss, Cu – Copper, Bs – Brass).
5. Discussion
5.1. Evolution of recrystallization texture with annealing time
To better understand the evolution of the microstructure, the volume fraction of most of the orientations found in the EBSD mappings (within 10° tolerance) was determined and compared in both the deformed and recrystallized state. shows all orientations appearing in the deformed and recrystallized states. Each orientation has been assigned a number called ‘orientation no.’ and will represent a particular orientation from thereon. As discussed earlier the deformed condition of the Ni and both the Ni-Fe alloys form a Cu-type texture. However, unlike Ni, the Ni-Fe alloys do not form cube orientation after recrystallization, rather it shows the rotated cube and the BR orientations. The volume fraction variation of all the orientations present (more than 2%) in the rolled and annealed sample of Ni and Ni-Fe alloys are represented in .
Figure 10. Variation of volume fraction of all the orientations present (more than 2%) in rolled and annealed pure Ni (a) 70% CR and 18% recrystallized, (b) 70% CR and 60% recrystallized, (c) 70% CR and 100% recrystallized, (d) 18% and 100% recrystallized, in Ni-20Fe (e) 70% CR and 12% recrystallized, (f) 70% CR and 25% recrystallized, (g) 70% CR and 100% recrystallized, (h) 25% and 100% recrystallized, in Ni-40Fe (i) 70% CR and 10% recrystallized, (j) 70% CR and 40% recrystallized, (k) 70% CR and 100% recrystallized, (l) 40% and 100% recrystallized, samples, respectively, calculated through TSL OIM8.2.
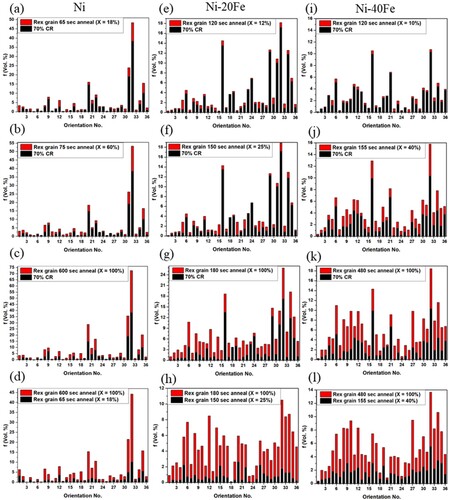
Table 3. All orientation components observed in deformed and recrystallized material along with their miller indices and Euler angle in Bunge notation.
A comparison of the as-rolled microstructure and the nuclei orientations indicates that recrystallized orientations already exist within the set of orientations in the deformed microstructure ((a)). The same deformed matrix orientation retainment has been observed during the initial recrystallization stage due to nucleation through recovery-based mechanisms such as subgrain coarsening and subgrain coalescence [Citation5,Citation13]. However, nuclei corresponding to a few deformed orientations are not present in the case of both Ni-Fe alloys ((e,i)) because in this case the initial stage of recrystallization is dominated by shear-band nucleation. Since Ni or the Ni-Fe alloys are high SFE material that promotes easy initial recovery, which leads to the formation of nuclei due to recovery-based nucleation mechanism in certain deformed regions where other conditions of nucleation (such as surrounded by high lattice curvature) were favourable [Citation25]. The volume fractions of different texture components are different in all cases. Ni shows that some of the orientations, such as orientation no. 1 (cube) and 12 (BR), have formed in large amounts compared to others. Whereas Ni-20Fe shows that orientation no. 5 (rotated cube), 6, 10, and 14 has formed in large amount and Ni-40Fe shows that orientation no. 5 (rotated cube), 12 (BR), 16, 23 (Goss twin), and 34 has formed in large amount compared to others. Some new orientations have also been formed in all the cases, which were not present after deformation. Ni shows the formation of orientation 14 (0°, 55°, 45°) and 17 (30°, 55°, 45°), Ni-20Fe shows the formation of orientation no. 7, and Ni-40Fe shows the formation of orientation no. 22 (G/B), 25 (Cu twin), and 26 (Goss). It indicated that other mechanisms like twinning have also been activated at some deformed regions, which produced new orientations.
From these findings, it can be said that multiple nucleation mechanisms are activated during the start of recrystallization itself, and the dominance of a particular mechanism depends on the site of nucleation in the deformed matrix. In the case of Ni-Fe alloys, it was observed that a large number of nuclei of different orientations formed at shear bands and highly localised deformed regions during the initial stage of recrystallization. This could have led to many new orientations. However, (e,i) show that although recrystallized grains of many orientations are present, most of those orientations were also in as-deformed condition, at least in small amounts. This indicates that nucleation in shear-band and highly localised deformed regions are not entirely random, and orientations within 10–12° deviation (tolerance limit used for different orientations) of one of the deformed orientations could form.
Further annealing resulted in the increase, stagnation, and decrease of the volume fraction of some orientations. The specific behaviour was found to depend on the chemical composition of materials. For instance, in the case of Ni, orientations no. 8 and 20 continued to grow, orientations 9, 16 remained constant, and orientations 17, 26, and 27 shrunk ((b)). In the case of Ni-20Fe, the volume fraction of orientations no. 5, 15, 20, 22, and 26 continued to grow, orientations 6 and 16 remained constant, and some orientations such as 24 shrinks ((f)). Similar behaviour is observed for the Ni-40Fe alloy ((j,k)).
This seems to indicate that some orientations achieve growth selectivity due to favourable neighbouring conditions (<111>/40° misorientation or very high deformed regions ahead of recrystallization front). Also, some orientation that forms initially does not grow because of low mobility boundary or the formation of twinned orientations when it meets other deformed grain. It has been observed that twin orientations (Σ3 misorientation) related to the orientation of the deformed grain have grown more over the others. As an example of it, the Σ3 related component of the deformed texture components 26 (Goss), 22 (G/B), and 20 (Bs) have been computed, which are P, 18 (A), and 15 (Rt Goss) orientations, respectively. These orientations (orientation no. 18 and 15) were seen to grow in the case of Ni ((c)). It also results in the formation of complete α-fibre since all these orientations belong to α-fibre orientation. Similar relations were also found in both Ni-Fe alloys ((g,k)). Few other orientations appeared as recrystallized nuclei during the later stage of recrystallization. As an example, orientation no. 27 in the case of Ni-20Fe and orientation no. 4 in the case of Ni-40Fe ((f,j)). Therefore, this orientation forms in the region of deformed microstructure which recrystallizes last, i.e. within moderated stored energy grains such as Goss or S orientation [Citation2,Citation6,Citation15]. This phenomenon was not seen in the case of pure Ni. It could be due to the lower fraction of preferential sites in pure Ni than Ni-Fe alloys.
All other comparisons, such as variation in volume fraction of different orientations at different recrystallization stages, have also been presented in all the cases ((d,h,l)). In the case of Ni, orientations no. 28 (15°, 90°, 65°) and 30 (30°, 75°, 65°) nucleated initially but could not grow during the latter part of recrystallization. In contrast, orientation no. 8 (0°, 30°, 15°) has grown substantially after complete recrystallization. In the case of Ni-20Fe, orientation no. 13 (rotated Cu) has nucleated initially but could not grow during the latter part of recrystallization. In contrast, orientation no. 17 (F) has not nucleated initially but formed substantially after complete recrystallization. Ni-40Fe shows that orientation no. 24 (Cu) has nucleated initially but could not grow at the end of recrystallization. However, orientation no. 18 (A) has not nucleated initially but formed substantially after full recrystallization. The reason behind this growth selectivity could be its dependence on the local mobility at the recrystallization front, which depends on the local misorientation and stored energy difference across the growing new grain.
5.2. Recrystallization mechanism based on site of nucleation
From the analysis of microstructure and texture, it was found that the site of nucleation is the most important factor in deciding the orientation of growing nuclei. Tracking of nuclei at different microstructural features can give a comprehensive understanding of the mechanism of its formation. Following this idea, an effort has been made to examine the mechanism of formation of nuclei, and its orientation selectivity in different microstructural regions. In the case of pure Ni, the most favourable site of nucleation was found to be the intersection point of a transition band and high-angle grain boundary (HAGB). It can also be referred to as a TB triple point, which has an even higher lattice curvature than a classical GB triple point.
5.2.1. Nucleation at GB and transition band intersection
Nucleation in the transition band region was observed after only 65 s of annealing in the case of 70% cold-rolled pure Ni. In (a,b), nuclei have been partitioned based on GOS value (GOS < 1.5 and Grain size >1 µm). Misorientation profiles across all of the nuclei at this stage surprisingly showed that most of the nuclei have a misorientation value of less than 10° with respect to one side of the deformed region (relatively homogeneously deformed grain). It indicates that those nuclei have been formed or started forming due to recovery in those deformed regions. The misorientation profile between nuclei and another side of the deformed region (transition band side) shows that the misorientation value is near either 40° or 60°. Most of the nuclei fall into one of these two categories. It is well known that a grain boundary with a <111>/40° misorientation has very high mobility [Citation6,Citation77], which helps the nuclei to grow and achieve a size advantage over other recovered sub-grains. It has also been reported that a grain boundary with a <111>/60° misorientation is stable and shows a global minimum in its energy [Citation40,Citation41], thus is favourable to form. Grain boundary planes other than (111) (coherent twin) with a <111>/60° inclination (such as (112), (113), (331), (115), etc.) also show local minima in the energy [Citation78]. Thereby, a <111>/60° misoriented boundary is preferentially formed and is stable compared to a random high-angle grain boundary. Boundaries vicinal to the <111>/60° misorientation within a 4° tolerance angle have also shown less energy than a random HAGB [Citation72]. So, both of these two cases (<111>/40° and <111>/60° misorientation) can provide a necessary condition for the formation of a nucleus. It should be noted that in both of these mechanisms, nuclei have formed through a recovery-based process via either sub-grain coarsening or coalescence. In such a case, nuclei orientations will be within 10° deviation from one of the neighbours deformed grain orientations.
Figure 11. Nucleation at GB and transition band intersection, (a) IPF map of Ni 70%CR 65 s anneal sample, (b) nuclei partitioned based on GOS value, (c) enlarged view of one of the nuclei and their neighbours showing two deformed grain (D1 and D2) in both sides of nuclei, and two sub-grain (S1 and S2), (d) (111) pole figure showing the orientation of D1, D2, S1, and S2, (e) enlarged view of other nuclei and their neighbours showing three deformed grain (D3, D4, and D5) in the neighbour of nuclei, and subgrain (S3) (probable nuclei), (f) (111) pole figure showing the orientation of D3, D4, D5, and S3. Based on misorientation profile sub-grain S1 and S3 were found to grow as successful nuclei N1 and N2, respectively.
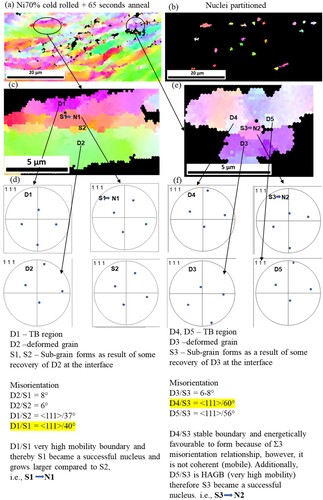
shows the nucleation at GB and transition band intersection region. A magnified view of one of the nucleation region and their neighbours shows two deformed grains (D1 and D2) and two sub-grain (S1 and S2) ((a–d)). The orientation of all these grains was shown by the (111) pole figure. Misorientation between deformed grain D2 and sub-grain S1 is 8° and between D2 and S2 is 6°, which shows that both these sub-grains have formed as a result of the recovery of a part of D2 grain. Misorientation between deformed grain D1 (in TB region) and S2 is <111>/37° and between D1 and S1 is <111> 40°. D1/S1 is a highly mobile boundary [Citation59,Citation79], which will help S1 grow further and achieve a size advantage for becoming a successful nucleus. The same has been seen in the IPF map after the partition of nuclei, where S1 qualifies the criteria of being a nucleus (N1). ((e,f)) shows the nucleation at GB and transition band intersection region, which qualify the second criteria explained above. A magnified view of one of the nucleation regions and their neighbours shows three deformed grains (D3, D4, and D5) and one sub-grain (S3). Misorientation between deformed grain D3 and sub-grain S3 is 6°, which shows that sub-grain S3 has formed due to the recovery of a part of D3 grain. Misorientation between deformed grain D4 (in TB region) and S3 is <111>/60°, which is low energy and relatively stable boundary, which is preferential to form [Citation25]. Misorientation between D5 and S3 is <111>56°, a high-angle boundary that is highly mobile.
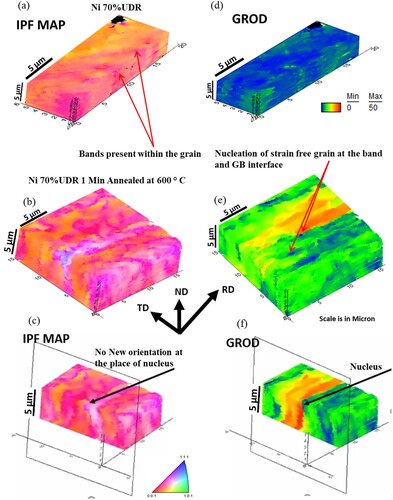
All these conditions favour for S3 to become a successful nucleus (N2) and grow further as also seen in the IPF map. To further analyse and verify the mechanism of nucleation proposed above, 3D-EBSD of the same sample was carried out. FIB milling was used to mill the sample surface with very high accuracy in a dual-beam FEI Helios system. A step size of 100 nm was used during the scan, and a thickness of 100 nm was milled on the transverse plane each time. The alternate process of EBSD scan and milling was repeated 500 times, and the obtained data were merged to get a 3-D microstructure using TSL 8.2. software and shown in . A sectioned view of 60 s anneals sample indicates the region of nucleation, i.e. the strain-free region shown by blue colour ((f)). The nuclei have started to form at the intersection point of band and grain boundary, which verify earlier observation of 2-D representation. It can also be seen that in other regions, the shape of recrystallized grain (blue colour in GROD map) is similar to the shape of the band, i.e. plate type across the thickness of the sample. It means that recrystallization starts from the TB triple point. It grows along the band with annealing time. Later, it thickens in the deformed matrix in the direction of the highest mobility. In the same region of nuclei, as seen in the 3-D GROD map, the 3-D IPF map does not show any new orientation, which indicates the recovery-based mechanism of formation of nuclei, and the orientation of nuclei was already present in the deformed matrix [Citation6]. Similar results were found through the analysis of a 2-D scan of a partial recrystallized sample. It should be noted that new orientation forms during the growth of nuclei in the deformed matrix when it meets different interfaces or features either due to annealing or growth selectivity of certain orientations.
Figure 12. Nucleation at GB and transition band intersection, 3D IPF map of (a) pure Ni 70%CR, (b) Ni 70% CR 60 s anneal, (c) sectioned view of 60 s anneal sample indicating the region of nucleation, 3D GROD map of (d) pure Ni 70%CR, (e) Ni 70% CR 60 s anneal, (f) sectioned view of 60 s anneal sample indicating the region of nucleation (blue colour).
5.2.2. Growth of nuclei in the deformed matrix
(a) shows the growth of nuclei at the grain boundary during the very initial stage of recrystallization. Initial nuclei at the grain boundary region were tracked in 70% cold-rolled pure Ni after 105 s of annealing. Each grain in the IPF map (deformed and recrystallized) was numbered (1–39). The black line shows the Σ3 (<111>/60°) boundary, and the white line shows the Σ9 (<110>/38.9) type of grain boundary. It can be seen that a very high fraction of Σ3 boundary has been formed during the growth of nuclei in the initial stage of recrystallization, and, thereby, it also results in the formation of lots of new orientations. It was discussed earlier in section 3.5 that the grain boundary plane (K1 plane) is a crucial parameter, which decides the mobility of a particular Σ3 boundary. To know the common grain boundary plane (k1 plane), twin plane trace analysis was done using TSL 8.5 software. The characteristic grain boundary character based on the calculated k1 plane was reported using GB toolbox software [Citation70]. It shows that quasi-symmetric twist type Σ3 boundaries form very frequently compared to others. It has already been explained in previous sections that those boundaries are preferential to form due to local minima in energy value and also have sufficient mobility to grow in the deformed microstructure.
Apart from that, lots of coherent boundaries have also been seen, which are relatively immobile. The grain boundary plane is not unique for the stepped and curved type of Σ3 boundary, and it differs from point to point along the boundary. However, we can say that those belong to different tilt types of grain boundary plane, which is obviously not coherent and thereby mobile in nature [Citation80]. (b–d) shows the twin (Σ3) plane trace analysis of the Σ3 boundary between grain 2 and 3 (2–3 Σ3 boundary). It is an ‘a’ type, i.e. straight edge Σ3 boundary based on its shape. The misorientation between grain 2 (recrystallized grain), which is growing towards grain 39 (deformed grain), is 54° which is close to the 60° misorientation. So, it can form a Σ3 boundary through slight rotation. A similar thing has been seen where a Σ3 boundary has been formed at the recrystallization front. Then it grows, leaving a Σ3 boundary at the interface between a part of grain 39 and the growing grain 2. In the process, a new recrystallized grain with a new orientation was formed, which was earlier not present in the deformed material.
Figure 13. Growth of nuclei at the grain boundary, (a) IPF map of Ni 70%CR 105 s anneal sample, each grain is numbered (1–39), the black line shows Σ3 (<111>/60°) boundary, and the white line shows Σ9 boundaries, twin (Σ3) plane trace analysis of Σ3 boundary between (b-d) grain 2 and 3 (2–3 Σ3 boundary), (e-g) grain 5 and 7 (5-6-7 Σ3 boundary).
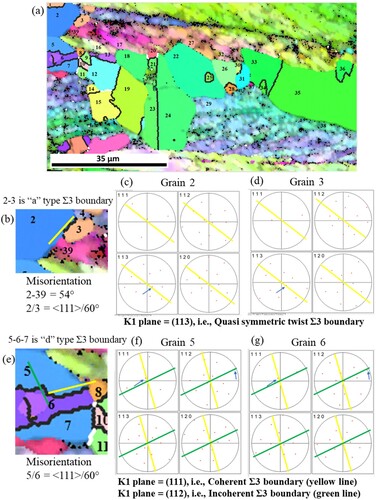
The nearest variant of the twin boundary has been formed in the process, which required minimum rotation of grain 2 at the recrystallization front. That is why the Σ3 boundary formed is not coherent, although it possesses the least energy. Nielsen, in 1967, also gave a similar argument for the formation of twins [Citation81]. He stated that to bridge the grain boundary energy gap, twin formation will occur only when the orientation of the deformed matrix is near the twin orientation of the growing grain [Citation81,Citation82]. In the current case, the grain boundary plane corresponding to it was found to be (113) plane shown through a plane trace analysis in (b–d). The nature of this boundary is quasi-symmetric twist type as indicated by the GB toolbox [Citation70].
Earlier studies done by Randle et al. on grain boundary engineered (GBE) pure Ni and Cu showed that because of GBE the majority of the newly generated Σ3 grain boundaries were not coherent twins with {111} grain boundary plane orientations [Citation64]. It was found that GBE increased the proportion of Σ3 boundary length that was vicinal-to-{111} and the proportion of asymmetrical <110> tilt boundaries. There was a clear propensity for the selection of particular planes or plane combinations which were associated with low energy. On further analysis, it was found that many of these boundaries were asymmetrical tilts boundaries comprising (or vicinal to) at least one low-index plane [Citation64]. It was also reported that the formation of new Σ3s through Σ3 regeneration mechanism (Σ3n + Σ3n + 1 = Σ3) are essentially not annealing twins and are therefore not on {111} interface planes. Rather, they could occupy a variety of boundary planes. Σ3 boundary planes other than {111} are highly mobile and would therefore promote further encounters with other Σ3s, hence perpetuating Σ3 regeneration [Citation64]. Some other studies suggest that special behaviour at grain boundaries is related to low-index planes rather than particular misorientations [Citation64,Citation72].
(e–g) shows the twin (Σ3) plane trace analysis of the Σ3 boundary between grain 5 and 7 (5-6-7 Σ3 boundary). It is a ‘d’ type, i.e. straight complete Σ3 boundary based on its shape. This boundary does not share any neighbour with deformed grain. It is a classical type of twin boundary that forms due to accidental growth at the [111] facets. In the process of stacking sequence changes at (111) plane changes, a detailed explanation is given in [Citation83,Citation84]. It produced a stepped type Σ3 boundary, and plane trace analysis shows the presence of (111) and (112) planes, which are coherent and incoherent, respectively ((f,g)). The mobility of this boundary will be significantly less in this case compared to all other boundaries. A similar analysis was done for the Σ3 boundary between grains 8 and 9 (8–9 Σ3 boundary). The misorientation between grain 8 (recrystallized grain), which is growing towards grain 16 (deformed grain), is 56° which is close to the 60° misorientation, and it could form Σ3 boundary through slight rotation. As in the case of Σ3 boundary 2–3, the same thing has been seen in this case, where a Σ3 boundary has been formed at the recrystallization front, then it grows, leaving a Σ3 boundary at the interface between a part of grain 16 and the growing grain 8. In the process, a new recrystallized grain (grain 9) having a new orientation was formed, which was earlier not present in the deformed material. In the process, the nearest variant of the twin boundary has been formed, which requires minimum rotation of grain 8 at the recrystallization front. In this case, the grain boundary plane corresponding to it was found to be a (120) plane, which was calculated through plane trace analysis. The nature of this boundary was quasi-symmetric twist type as indicated by the GB toolbox [Citation70].
As discussed in section 3.5, Σ3 boundaries of many different shapes can be seen. Schematic representation of different types of Σ3 based on their shape within a grain (a-h) was shown in , and for each type of boundary, a representative name has been given. Also, as seen that the grain boundary plane (K1 plane) is a crucial parameter, which decides the mobility of that particular Σ3 boundary. shows the type of different Σ3 (<111>/60°) and Σ9 boundaries present during the growth of nuclei in (a), their corresponding K1 plane, and the characteristics of grain boundary character. shows the frequency of occurrence of different types of Σ3 Boundary (<111>/60°) based on their shape, which was present in (a). It should be noted that the data shown here is for the growth of nuclei during the very initial stage of recrystallization. It was found that boundary types ‘e’ and ‘h’ form more frequently than others at the initial recrystallization stage.
Table 4. Type of different Σ3 (<111>/60°), and Σ9 (<110>/38.9°) boundary present during the growth of nuclei in , their corresponding K1 plane and the characteristics grain boundary character.
Table 5. Frequency of occurrence of different types of Σ3 Boundary (<111>/60°) based on their shape as presented in . The data shown here is for the growth of nuclei during the very initial stage of recrystallization.
6. Conclusions
The evolution of recrystallization texture in pure Ni and the alloys Ni-20Fe and Ni-40Fe has been investigated. The as-deformed microstructural features are a direct function of solid solution strengthening in Ni-Fe alloys irrespective of their SFE. The development of recrystallization texture has been explained based on rigorous evaluation and analysis of microstructural features, including grain boundary characteristics. The following are the key conclusions from this study:
The evolution of deformation texture in Pure Ni as well as in Ni-(20,40)Fe alloys is of Cu-type with the later having higher amount of Bs-component than the Cu-component. While the microstructure of pure Ni is mostly homogeneous with some micro-bands and transition bands in Cu-orientated grains, the Ni-Fe alloys exhibit shear banding.
The recrystallization texture of Pure Ni and Ni-Fe alloys consists of non-uniform α-fibre, with peaks at a different locations. For pure Ni, the peak occurs at near ‘A’ orientation for pure while the Ni-Fe alloys exhibit the Goss component. In addition, the texture of pure Ni consists of strong cube components while for Ni-Fe alloys, it consists of rotated cube and brass recrystallization (BR) components.
In pure Ni, nucleation occurs at grain boundaries, whereas in the Ni-Fe alloys, nucleation occurs in shear bands. In all the cases, Cu-oriented grains are prone to early recrystallization and the grains on the <110> || ND fibre are last to recrystallize. Recrystallization is dominated by the formation of annealing twins (Σ3).
With the progress of recrystallization, the fraction of Σ3 and Σ9 grain boundaries increase in all three cases, however, the nature of Σ3 boundaries is different. Pure Ni shows both straight and curved Σ3 boundaries, while the latter dominates in the Ni-Fe alloy.
The formation of new orientations takes place as a result of twinning and growth selectivity of certain orientations due to high mobile (<111>/40°) grain boundaries in all the cases, growth selectivity being more prominent in Ni-Fe alloys.
The intersection point of a band and high-angle grain boundary (HAGB) is the most potent nucleation site in Ni. If the orientation of a growing sub-grain is either <111>/40° related to the deformed grain across the boundary or its orientation is close to any Σ3 variants ahead of it, the sub-grain becomes a successful nucleus and grows further.
Cellular Automata simulations based on the experimental input parameters and relative contribution of activation of different nucleation mechanisms provide a good prediction of microstructure along with the evolution of different texture components.
Acknowledgements
The authors acknowledge the extensive use of microscopy facilities at the Advanced Facility for Microscopy and Microanalysis (AFMM), Supercomputer Education and Research Centre (SERC) for providing the computational facility at Indian Institute of Science, Bangalore. LABM acknowledges the support of the Indian Institute of Science through Hubert I. Aaronson Fellowship for visiting scientists.
Disclosure statement
No potential conflict of interest was reported by the author(s).
References
- J.G. Sevillano, P.V. Houtte, and E. Aernoudt, Large strain work hardening and textures. Prog. Mater. Sci. 25 (1980), pp. 69–134.
- S.P. Bellier and R.D. Doherty, The structure of deformed aluminium and its recrystallization—investigations with transmission Kossel diffraction. Acta Metall. 25 (1977), pp. 521–538.
- B. Bay, N. Hansen, D.A. Hughes, and W.D. Kuhlmann, Overview no. 96 evolution of f.c.c. deformation structures in polyslip. Acta Metall. Mater. 40 (1992), pp. 205–219.
- R. Doherty, D. Hughes, F. Humphreys, J. Jonas, D. Jensen, M. Kassner, W. King, T. McNelley, H. McQueen, and A. Rollett, Current issues in recrystallization: a review. Mater. Sci. Eng. A. 238 (1997), pp. 219–274.
- F.J. Humphreys and M. Hatherley, Recrystallization and Related Annealing Phenomena, 1st ed., Elsevier, United Kingdom, 1995.
- A. Rollett, F.J. Humphreys, M. Hatherly, and G.S. Rohrer, Recrystallization and Related Annealing Phenomena, 2nd ed., Elsevier Science Ltd., Netherlands, 2004.
- P. Faivre and R.D. Doherty, Nucleation of recrystallization in compressed aluminium: studies by electron microscopy and Kikuchi diffraction. J. Mater. Sci. 14 (1979), pp. 897–919.
- F.J. Humphreys, A unified theory of recovery, recrystallization and grain growth, based on the stability and growth of cellular microstructures—I. The basic model. Acta Mater. 45 (1997), pp. 4231–4240.
- A. Berger, P.J. Wilbrandt, F. Ernst, U. Klement, and P. Haasen, On the generation of new orientations during recrystallization: recent results on the recrystallization of tensile-deformed fcc single crystals. Prog. Mater. Sci. 32 (1988), pp. 1–95.
- A. Berger, P.J. Wilbrandt, and P. Haasen, Development of the recrystallization texture in tensile deformed aluminium single crystals—I. HVEM observations. Acta Metall. 31 (1983), pp. 1433–1443.
- H.J. Bunge, The basic concepts of texture investigation in polycrystalline materials. Steel Res. Int. 62 (1991), pp. 530–541.
- O. Engler, H.E. Vatne, and E. Nes, The roles of oriented nucleation and oriented growth on recrystallization textures in commercial purity aluminium. Mater. Sci. Eng., A. 205 (1996), pp. 187–198.
- O. Engler, Influence of particle stimulated nucleation on the recrystallization textures in cold deformed Al-alloys Part II-Modeling of recrystallization textures. Scr. Mater. 37 (1997), pp. 1675–1683.
- O. Engler and H.E. Vatne, Modeling the recrystallization textures of aluminum alloys after hot deformation. JOM. 50 (1998), pp. 23–27.
- J. Liu, M. Mato, and R.D. Doherty, Shear banding in rolled dispersion hardened AlMg2Si alloys. Scr. Metall. 23 (1989), pp. 1811–1816.
- A. Duckham, O. Engler, and R.D. Knutsen, Moderation of the recrystallization texture by nucleation at copper-type shear bands in Al-1Mg. Acta Mater. 50 (2002), pp. 2881–2893.
- F.J. Humphreys, Local lattice rotations at second phase particles in deformed metals. Acta Metall. 27 (1979), pp. 1801–1814.
- F.J. Humphreys and P.N. Kalu, Dislocation-particle interactions during high temperature deformation of two-phase aluminium alloys. Acta Metall. 35 (1987), pp. 2815–2829.
- F.J. Humphreys and M.G. Ardakani, The deformation of particle-containing aluminium single crystals. Acta Metall. 42 (1994), pp. 749–761.
- W.B. Hutchinson, Recrystallisation textures in iron resulting from nucleation at grain boundaries. Acta Metall. 37 (1989), pp. 1047–1056.
- D. Raabe and K. Lücke, Textures of ferritic stainless steels. Mater. Sci. Technol. 9 (1993), pp. 302–312.
- I. Samajdar and R.D. Doherty, Grain boundary misorientation in DC-cast aluminum alloy. Scr. Metall. et Mater. 31 (1994), pp. 527–530.
- R.D. Doherty and R.W. Cahn, Nucleation of new grains in recrystallization of cold-worked metals. J. Less-Common Met. 28 (1972), pp. 279–296.
- F.J. Humphreys and M. Ferry, Applications of electron backscattered diffraction to studies of annealing of deformed metals. Mater. Sci. Technol. 13 (1997), pp. 85–90.
- O. Engler, Deformation and texture of copper–manganese alloys. Acta Mater. 48 (2000), pp. 4827–4840.
- R.K. Ray, Rolling textures of pure nickel, nickel-iron and nickel-cobalt alloys. Acta Metall. et Mater. 43 (1995), pp. 3861–3872.
- R. Quey, G.H. Fan, Y. Zhang, and D.J. Jensen, Importance of deformation-induced local orientation distributions for nucleation of recrystallisation. Acta Mater. 210 (2021), p. 116808.
- C. Carter and S. Holmes, The stacking-fault energy of nickel. Philos. Mag. 35 (1977), pp. 1161–1172.
- G. Shankar, R. Madhavan, R. Kumar, B. Sahoo, R.K. Ray, and S. Suwas, Micro-mechanism of evolution of microstructure and texture in Ni-Fe alloys. Mater. 13 (2020), p. 100811.
- O. Engler, Recrystallisation textures in copper-manganese alloys. Acta Mater. 49 (2001), pp. 1237–1247.
- P.C.J. Gallagher, The influence of alloying, temperature, and related effects on the stacking fault energy. Metall. Mater. Trans. B. 1 (1970), pp. 2429–2461.
- D.P. Rodionov, I.V. Gervaseva, Y.V. Khlebnikova, V.A. Kazantsev, N.I. Vinogradova, and V.A. Sazonova, Effect of recrystallization annealing on the formation of a perfect cube texture in FCC nickel alloys. Phys. Met. Metallogr. 111 (2011), pp. 601–611.
- R. Hielscher and H. Schaeben, A novel pole figure inversion method: specification of the MTEX algorithm. J. Appl. Crystallogr. 41 (2008), pp. 1024–1037.
- F. Bachmann, R. Hielscher, and H. Schaeben, Texture analysis with MTEX – free and open source software toolbox. Solid State Phenom 160 (2010), pp. 63–68.
- D. Raabe and R.C. Becker, Coupling of a crystal plasticity finite-element model with a probabilistic cellular automaton for simulating primary static recrystallization in aluminium. Model. Simul. Mat. Sci. Eng. 8 (2000), pp. 445–462.
- F. Roters, P. Eisenlohr, L. Hantcherli, D.D. Tjahjanto, T.R. Bieler, and D. Raabe, Overview of constitutive laws, kinematics, homogenization and multiscale methods in crystal plasticity finite-element modeling: theory, experiments, applications. Acta Mater. 58 (2010), pp. 1152–1211.
- B. Radhakrishnan, G.B. Sharma, H. Weiland, and P. Baggethun, Simulations of deformation and recrystallization of single crystals of aluminium containing hard particles. Model. Simul. Mat. Sci. Eng. 8 (2000), pp. 737–750.
- M. Bernacki, R.E. Logé, and T. Coupez, Level set framework for the finite-element modelling of recrystallization and grain growth in polycrystalline materials. Scripta Mater. 64 (2011), pp. 525–528.
- P.J. Hurley and F.J. Humphreys, Modelling the recrystallization of single-phase aluminium. Acta Mater. 51 (2003), pp. 3779–3793.
- M. Bernacki, H. Resk, T. Coupez, and R.E. Logé, Finite element model of primary recrystallization in polycrystalline aggregates using a level set framework. Model. Simul. Mat. Sci. Eng. 17 (2009), pp. 1–22.
- F.J. Humphreys, Modelling mechanisms and microstructures of recrystallisation. Mater. Sci. Technol. 8 (1992a), pp. 135–144.
- G. Gottstein and L.S. Shvindlerman, Grain Boundary Migration in Metals, CRC Press, Boca Raton, 2009.
- H.J. Bunge and U. Köhler, Model calculations of primary recrystallization textures. Scr. Metall. et Mater. 27 (1992), pp. 1539–1543.
- M. Crumbach, M. Goerdeler, and G. Gottstein, Modelling of recrystallisation textures in aluminium alloys: I. Model set-up and integration. Acta Mater. 54 (2006), pp. 3275–3289.
- G. Ibe, W. Dietz, A.C. Fraker, and K. Lücke, Preferred orientations during recrystallization of strained single crystals of high purity aluminium. Int. J. Mater. Res. 61 (1970), pp. 498–507.
- D.A. Molodov, in G. Gottstein and D.A. Molodov, eds., Recrystallization and Grain Growth, Vol. 1, Springer Verlag, Aachen, 2001, p. 21.
- G. Gottstein, L.S. Shvindlerman, D.A. Molodov, and U. Czubayko, in P.M. Duxbury and T.J. Pence, eds., Plenum Press, New York, 1997, p. 109.
- A.D. Rollett, Overview of modeling and simulation of recrystallization. Prog. Mater. Sci. 42 (1997), pp. 79–99.
- D. Raabe, F. Roters, F. Barlat, and L.Q. Chen, Continuum Scale Simulation of Engineering Materials, WILEY-VCH, Weinheim, 2004b.
- V. Marx, D. Raabe, O. Engler, and G. Gottstein, Simulation of the texture evolution during annealing of cold rolled BCC and FCC metals using a cellular automation approach. Textures Microstruct. 28 (1997), pp. 211–218.
- D. Raabe, Mesoscale simulation of recrystallization textures and microstructures. Adv. Eng. Mater. 3 (2001), pp. 745–752.
- K.G.F. Janssens, Random grid, three-dimensional, space-time coupled cellular automata for the simulation of recrystallization and grain growth. Model. Simul. Mat. Sci. Eng. 11 (2003), pp. 157–171.
- A.D. Rollett, M.J. Luton, and D.J. Srolovitz, Microstructural simulation of dynamic recrystallization. Acta Metall. 40 (1992), pp. 43–55.
- F.J. Humphreys, Network model for recovery and recrystallization. Scr. Metall. 27 (1992b), pp. 1557–1562.
- D. Kinderlehrer, I. Livshits, G.S. Rohrer, S. Taasan, and P. Yu, Mesoscale simulation of the evolution of the grain boundary character distribution. Mater. Sci. Forum. 467-470 (2004), pp. 1063–1068.
- P. Mukhopadhyay, M. Loeck, and G. Gottstein, A cellular operator model for the simulation of static recrystallization. Acta Mater. 55 (2007), pp. 551–564.
- M. Kühbach, L.A. Barrales-Mora, and G. Gottstein, A massively parallel cellular automaton for the simulation of recrystallization. Model. Simul. Mat. Sci. Eng. 22 (2014), p. 075016.
- L.A. Barrales-Mora, V. Mohles, P.J. Konijnenberg, and D.A. Molodov, A novel implementation for the simulation of 2-D grain growth with consideration to external energetic fields. Comput. Mater. Sci. 39 (2007), pp. 160–165.
- C. Haase, M. Kühbach, L.A. Barrales-Mora, S.L. Wong, F. Roters, D.A. Molodov, and G. Gottstein, Recrystallization behavior of a high-manganese steel: experiments and simulations. Acta Mater. 100 (2015), pp. 155–168.
- T. Seymour, P. Frankel, L. Balogh, T. Ungár, S.P. Thompson, D. Jädernäs, J. Romero, L. Hallstadius, M.R. Daymond, G. Ribárikch, and M. Preuss, Evolution of dislocation structure in neutron irradiated Zircaloy-2 studied by synchrotron x-ray diffraction peak profile analysis. Acta Mater. 126 (2017), pp. 102–113.
- L.A. Barrales-Mora, Y. Lü, and D.A. Molodov, Experimental determination and simulation of annealing textures in cold rolled TWIP and TRIP steels. Steel Res. Int. 82 (2011), pp. 119–126.
- C. Haase and L.A. Barrales-Mora, Influence of deformation and annealing twinning on the microstructure and texture evolution of face-centered cubic high-entropy alloys. Acta Mater. 150 (2018), pp. 88–103.
- G. Shankar, S. Raguraman, L.A. Barrales-Mora, and S. Suwas, Development of recrystallization texture in commercially pure titanium: experiments and simulation. JOM. 72 (2020), pp. 4559–4573.
- V. Randle, G.S. Rohrer, H.M. Miller, M. Coleman, and G.T. Owen, Five-parameter grain boundary distribution of commercially grain boundary engineered nickel and copper. Acta mater. 56 (2008), pp. 2363–2373.
- P. Davies and V. Randle, Grain boundary engineering and the role of the interfacial plane. Mater. Sci. Technol. 17 (2001), pp. 615–626.
- D.L. Olmsted, S.M. Foiles, and E.A. Holm, Survey of computed grain boundary properties in face-centered cubic metals: I. Grain boundary energy. Acta Mater. 57 (2009), pp. 3694–3703.
- G. Gottstein, D.A. Molodov, L.S. Shvindlerman, D.J. Srolovitz, and M. Winning, Grain boundary migration: misorientation dependence. Curr. Opin. Solid. State. Mater. Sci. 5 (2001), pp. 9–14.
- D. Prokoshkina, V.A. Esin, G. Wilde, and S.V. Divinski, Grain boundary width, energy and self-diffusion in nickel: effect of material purity. Acta Mater. 61 (2013), pp. 5188–5197.
- J. Li, S.J. Dillon, and G.S. Rohrer, Relative grain boundary area and energy distributions in nickel. Acta Mater. 57 (2009), pp. 4304–4311.
- G.S. Rohrer, Grain boundary energy anisotropy: a review. J. Mater. Sci. 46 (2011), pp. 5881–5895.
- P. Davies and V. Randle, Grain boundary engineering and the role of the interfacial plane. Mater. Sci. Technol. 17 (2001), pp. 615–626.
- G.J. Wang and V. Vitek, Relationships between grain boundary structure and energy. Acta Metall. 34 (1986), pp. 951–960.
- V. Randle, An investigation of grain-boundary plane crystallography in polycrystalline nickel. J. Mater. Sci. 30 (1995), pp. 3983–3988.
- K.S. Jyotheender, A. Gupta, and C. Srivastava, Grain boundary engineering in Ni-carbon nanotube composite coatings and its effect on the corrosion behaviour of the coatings. Mater. 9 (2020), p. 100617.
- A. Ma and F. Roters, A constitutive model for FCC single crystals based on dislocation densities and its application to uniaxial compression of aluminium single crystals. Acta Mater. 52 (2004), pp. 3603–3612.
- B. Peeters, M. Seefeldt, S.R. Kalidindi, P.V. Houtte, and E. Aernoudt, The incorporation of dislocation sheets into a model for plastic deformation of B.C.C. polycrystals and its influence on r-values. Mater. Sci. Eng. A. 319-321 (2001), pp. 188–191.
- P.A. Beck and P.R. Sperry, Strain induced grain boundary migration in high purity aluminum. Appl. Phys. 21 (1950), pp. 150–152.
- D. Wolf, Structure and energy of general grain boundaries in bcc metals. Appl. Phys. 69 (1991), pp. 185–196.
- A.P. Sutton and R.W. Balluffi (eds.), Interfaces in Crystalline Materials, Clarendon Oxford, 1995.
- D.G. Bandon, The structure of high-angle grain boundaries. Acta Metall. 14 (1966), pp. 1479–1484.
- H. Paul, J.H. Driver, C. Maurice, and A. Piatkowski, Recrystallization mechanisms of low stacking fault energy metals as characterized on model silver single crystals. Acta Mater. 55 (2007), pp. 833–847.
- J. Hirsch, K. Lücke, and M. Hatherly, Overview No, 76: mechanism of deformation and development of rolling textures in polycrystalline F.C.C. Metals-III. The influence of slip inhomogeneities and twinning. Acta Metall. 36 (1988), pp. 2905–2927.
- H.C.H. Carpenter and S. Tamura, The formation of twinned metallic crystals. Proc. R. Soc. Lond. 113A (1926), pp. 161–182.
- H. Gleiter, The formation of annealing twins. Acta Metall. 17 (1969), pp. 1421–1428.