
ABSTRACT
Molybdenum is one of the major alloying elements in TiAl-based alloys for high-temperature structural applications developed over the last decades. This is due to its stabilising effect on the (βTi) phase at high-temperatures, which crucially improves the hot-workability of such alloys. For further alloy development, an exact knowledge of the phase equilibria in the Ti–Al–Mo system is essential. However, there are still uncertainties and inconsistencies related to the ternary phase diagram. In this study, a series of ternary alloys was produced and heat-treated between 700 and 1300 °C. Composition, structure, and thermal stability of the phases were analysed and the resulting phase equilibria were established by applying a combination of scanning electron microscopy (SEM), electron probe microanalysis (EPMA), differential scanning calorimetry (DSC), and high-energy X-ray diffraction (HEXRD). From these results, a series of partial isothermal sections is obtained illustrating the phase equilibria in the Ti-rich part of the Ti–Al–Mo system.
1. Introduction
Back in the 1950s, the interest in phase equilibria of the Ti–Al–Mo system started to grow as it was found that when Ti is alloyed with Al and Mo, the properties and stability of the low- and high-temperature allotropes αTi and βTi can be controlled [Citation1–3]. The lightweight potential of TiAl-based Ti–Al–Mo alloys as structural material in aerospace and automotive applications was realised in the 1980s, and a lot of research activities were focused on making these alloys more suitable for such applications. Since Mo shows a strong (βTi)-stabilising effect (see, e.g. [Citation4–6]), it became an equally important alloying element as Nb, which is the most common alloying element in TiAl-based alloys. For example, the TNM alloy, which is a 3rd generation alloy and is already used in aircraft engines today, contains Mo as an essential alloying element along with Nb [Citation5, Citation7–9]. For the urgently needed further improvement of this class of alloys, an exact knowledge of the phase relations is an indispensable key prerequisite. Several studies were already performed on phase equilibria in the ternary Ti–Al–Mo system (e.g. [Citation10–13]; for an overview on the literature, see [Citation14]), but the results partially do not fit together and several aspects of the phase diagram relevant to materials development were not studied in detail. This includes, for example, the solubility of Mo in the different Ti-Al phases, the positions of the three-phase equilibria in the Mo-poor region of the system and their variation with temperature (especially the equilibria between (αTi)/Ti3Al, (βTi,Mo)/(βTi,Mo)o and TiAl), and the compositional range of the ordered (βTi,Mo)o phase in dependence on temperature.
The (βTi,Mo)o phase is one of the two ternary intermetallic phases of the system. It is the B2-ordered version of the disordered (βTi,Mo) solid solution (the two bcc phases βTi and Mo are completely miscible above 850 °C [Citation15], which is why this phase is designated as ‘(βTi,Mo)’ here and in the following). Due to its high solubility for Al, which increases with temperature, the phase field of the (βTi,Mo) solid solution extends far into the ternary system (even reaching the Al-Mo binary boundary at temperatures >1470 °C, where it connects with the A2 high-temperature phase MoAl [Citation14, Citation16, Citation17]). The ordered (βTi,Mo)o phase was first detected by Böhm and Löhberg [Citation18], who investigated a series of alloys with compositions along and around the section TiAl-TiMo after heat treatment at 1000 °C. Alloys containing between 15 and 35 at.% Mo along this section were found to be surprisingly brittle, and XRD analyses revealed a B2-ordered cubic structure for this single-phase material. The intensity of the B2 superstructure reflections was found to be maximum between about 25 and 30 at.% Mo, indicating that the ordering is strongest in this composition range [Citation18]. Ab initio calculations of Holec et al. [Citation19–21] indicate that a minimum of about 8-9 at.% Mo is needed to stabilise the B2-ordered state along this TiAl-TiMo section and – in agreement with the results of Böhm and Löhberg – that the order/disorder transition temperature increases with replacing Al by Mo. However, a maximum stability (minimum in energy of formation) is expected at a composition of 18 at.% Mo according to the calculations [Citation19]. B2-ordering as the stable ground state for the stoichiometric composition Ti2AlMo was also confirmed by ab initio calculations of Alonso and Rubiolo [Citation22], and differential thermal analysis yielded a (βTi,Mo)o/(βTi,Mo) order/disorder temperature of 1418 °C for a sample with this composition [Citation23].
The second ternary intermetallic phase is a σ-type phase with a tetragonal crystal structure (see ), which was observed for the first time by Hansen and Raman [Citation24] in a narrow composition range around the composition Ti3Mo3Al4. The presence of this phase has been confirmed later on in several studies [Citation10, Citation12, Citation13]. It is only stable up to a temperature of 1166 °C, where it decomposes in a peritectoid-type solid state reaction into (βTi,Mo)o and Mo3Al [Citation13]. Regarding its phase equilibria with the phases (βTi,Mo)/(βTi,Mo)o, TiAl, and TiAl3, contradicting results are reported in the literature. According to Huang et al. [Citation12], a two-phase field between the σ-phase and TiAl exists at 800 and 900 °C (i.e. there are the two three-phase equilibria σ + TiAl + (βTi,Mo)o and σ + TiAl + TiAl3), while no equilibrium between σ and TiAl is possible according to Witusiewicz et al. [Citation13], who instead report the two three-phase equilibria σ + (βTi,Mo)o + TiAl3 and TiAl + (βTi,Mo)o + TiAl3.
Table 1. Crystallographic information (crystal system, Pearson symbol, space group, and Strukturbericht designation) of the phases observed in the microstructure and relevant for the presented partial isothermal sections of the Ti–Al–Mo system.
In the present work, the phase equilibria in the Ti-rich corner of the Ti–Al–Mo system were investigated with a series of heat-treated alloys between 700 and 1300 °C. The relevant phases occurring in the compositional range studied here are well known and are listed in along with their crystal structure. Microstructures of the heat-treated samples and type, composition, and thermal stability of all phases were characterised by means of scanning electron microscopy (SEM), electron probe microanalysis (EPMA), differential scanning calorimetry (DSC), and high-energy X-ray diffraction (HEXRD). Partial isothermal sections between 800 and 1300 °C were established based on the measured data. The results of this work aim to provide an improved and more comprehensive picture of the application-relevant Mo-poor part of the Ti–Al–Mo system focusing on the solubility of Mo in the different Ti-Al phases, the extension of the homogeneity ranges of the phases, the two- and three-phase equilibria, and the ordering behaviour of the (βTi,Mo) phase.
2. Experimental
For the investigation of the phase equilibria between 700 and 1300 °C, a series of 13 ternary alloys were synthesised ( and ) using an arc-melter with a tiltable crucible and a crucible-free levitation-melting device, both operated in Ar inert atmosphere. The Ar gas was additionally dried to remove remaining moisture and oxygen (ZPure M™ 3800cc, Chromatography research supplies) to ensure that the impurity levels are as low as possible. High-purity metals Ti (99.995 wt.%), Al (99.999 wt.%), and Mo (99.9 wt.%) (HMW Hauner GmbH & Co. KG) were used for alloy synthesis. The rod-shaped ingots had a diameter of 15 mm and a length of up to 160 mm weighing between 200–300 g each. For selected as-cast alloys, the overall composition and impurity levels were analysed by inductively coupled plasma atomic emission spectroscopy (ICP-AES, Optima 8300, Perkin Elmer) and inert gas fusion analyses (Fusion Master ONH, NCS Germany) to ensure that no preferential evaporation or contamination has occurred during synthesis. The results are summarised in .
Figure 1. Positions of the compositions of the investigated alloys in the ternary composition triangle.
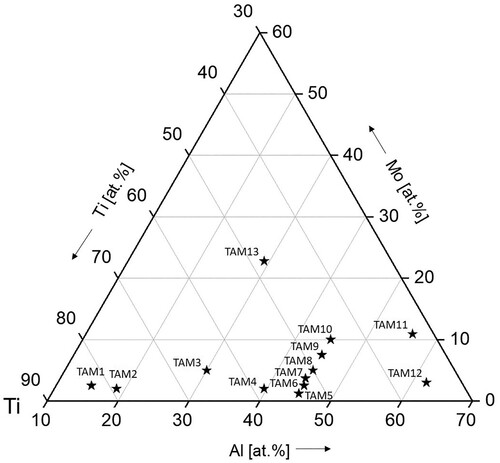
Table 2. Synthesised ternary Ti-Al-Mo alloys with their nominal and measured compositions (ICP-AES) as well as their contents of impurity elements O, N and C (LM = levitation melting; AM = arc melting, n.d. = not determined).
To minimise the uptake of impurities during the heat treatments, two different setups were used depending on the heat treatment temperature: For heat treatments at 700–1100 °C (in 100 °C steps), cylindrical samples of 10 mm length were encapsulated in fused silica ampules backfilled with Ar gas. For higher temperatures a so-called ‘double crucible technique’ [Citation29] is used, because fused silica is no longer gas-tight and the devitrification process begins. For this technique the sample is wrapped with Ta foil and placed in an alumina crucible, which in turn is placed upside down in a larger crucible. The leftover space is filled with Ti filings which act as oxygen-getter material (for illustration of setups c.f. Figure 4 in Ref. [Citation30]). The Ta foil prevents contact between filings and the sample. The reaction between Ta and the sample is very sluggish, so Ta was not found in any of the samples. After the heat treatments, all samples were quenched in brine by breaking the ampules/crucibles. summarises the heat treatment temperatures and times for the Ti–Al–Mo alloys. After the heat treatments, compositions (measured by EPMA) and impurity levels (O and N) of selected alloys were checked again. The change in overall composition lies within the measurement uncertainty of ±1% (relative) [Citation31] for the EPMA measurement. The oxygen content only increased slightly by less than 100 wt. ppm, while the nitrogen content remained below the detection limit of 50 wt. ppm.
Table 3. Overview of the heat-treated Ti–Al–Mo alloys showing heat treatment temperature and time.
After metallographic preparation, the microstructures were characterised by SEM and the overall and phase compositions were determined by means of EPMA (JEOL JXY-8100) operated at an acceleration voltage of 15 kV and a probe current of 20 nA. Pure elements were used as standards. The overall compositions of the heat-treated samples were determined by grid measurements. At least three representative areas of the microstructure were measured with grids (usual step size 20 µm), each consisting of at least 196 point measurements. These measurements also proved that no preferential evaporation of Al had occurred during the heat treatments. The chemical composition of the phases was determined by averaging the results of at least 12 point measurements, which were performed in different parts of the sample’s cross section. In a few cases where a phase in a three-phase sample was too small for direct point measurements (diameters < 1 µm), the phase composition was estimated from an extrapolation in a plot of the compositions obtained from the grid measurements which were done for the determination of the overall compositions. The several hundred data points obtained by grid measurements of such a sample all lie on the corners, or boundary, or within a triangle whose corners correspond to the equilibrium compositions of the three phases. By fitting an appropriate triangle to such a collection of data points, the approximate position of a corner can often be well estimated, even if there are no measurement points on that corner (as is the case with fine precipitates). The composition of fine-scaled phase mixtures was measured by using a widened beam yielding the average composition of this area. Phase fractions were determined by applying the lever rule for two- and three-phase alloys to the measured values of the overall and phase compositions.
The phases were identified by HEXRD experiments. The measurements were performed at the High-Energy Materials Science (HEMS) beamline [Citation32] operated by Helmholtz-Zentrum Hereon at the synchrotron storage ring PETRA III at DESY, Hamburg, Germany. Details of the experimental setup and data analysis are described in Ref. [Citation33].
To investigate the ordering behaviour of the (βTi,Mo) phase and the occurrence of any other kind of solid state phase transformations, complementing DSC measurements were performed using a Netzsch DSC 404C Pegasus thermal analyzer. Calibration was done with certified Al, Au, and Ni standards. For the measurements, cuboid samples with dimensions of approximately 3 × 3 × 2 mm3 were cut, cleaned with ethanol, and measured with a heating rate of 10 °C/min.
3. Results
The phase and alloy compositions obtained by EPMA measurements of the ternary alloys after the heat treatments at temperatures from 700 to 1300 °C are summarised in along with the phase fractions determined from these measurements. Since the investigations of the alloys TAM5 to TAM10 revealed that most of these alloys show the same type of (βTi,Mo) + TiAl two-phase microstructure, not all of these alloys were investigated at all heat treatment temperatures. The composition values given together with the alloy designations in the following description and discussion of the results are always those measured in the as-cast condition (). The actual overall compositions of the heat-treated samples are listed in the respective and may slightly deviate from the as-cast values.
Table 4. EPMA results on phase contents, alloy and phase compositions, and phase fractions of alloys heat-treated at 700 °C for 1500 h (n.d.: not determined).
Table 5. EPMA results on phase contents, alloy and phase compositions, and phase fractions of alloys heat-treated at 800 °C for 1000 h (n.d.: not determined).
Table 6. EPMA results on phase contents, alloy and phase compositions, and phase fractions of alloys heat-treated at 900 °C for 650 h (n.d.: not determined).
Table 7. EPMA results on phase contents, alloy and phase compositions, and phase fractions of alloys heat-treated at 1000 °C for 400 h (n.d.: not determined).
Table 8. EPMA results on phase contents, alloy and phase compositions, and phase fractions of alloys heat-treated at 1100 °C for 200 h (n.d.: not determined).
Table 9. EPMA results on phase contents, alloy and phase compositions and phase fractions of alloys heat-treated at 1200 °C for 30 h (n.d.: not determined).
Table 10. EPMA results on phase contents, alloy and phase compositions and phase fractions of alloys heat-treated at 1300 °C for 20 h (n.d.: not determined).
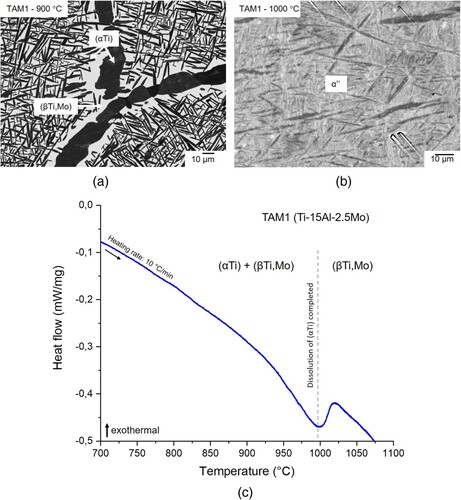
Alloy TAM1 (Ti-15Al-2.5Mo) was heat-treated at 800, 900, and 1000 °C. The samples quenched from 800 and 900 °C show a two-phase microstructure consisting of plate-like (αTi) precipitates inside large (βTi,Mo) grains. In addition, (αTi) is also found at the grain boundaries (a). Quenching from 1000 °C results in a martensitic looking microstructure (b). EPMA shows that the compositions in the dark and light appearing regions are identical within ±0.1 at.%, i.e. the sample is single-phase. HEXRD measurements reveal that this is α’’ martensite, which has formed from (βTi,Mo) during quenching without changing the composition. From these results it is concluded that the sample was single-phase (βTi,Mo) at 1000 °C. This is also in agreement with DSC measurements (c), which show that the dissolution of (αTi) is completed just below 1000 °C.
Figure 2. BSE image of alloy TAM1 (Ti-15Al-2.5Mo) heat-treated at (a) 900 °C showing a two-phase microstructure composed of (αTi) (dark) and (βTi,Mo) (bright) and (b) 1000 °C showing α’’ martensite that formed from (βTi,Mo) during quenching; (c) DSC heat flow curve of alloy TAM1 heat-treated at 1000 °C showing that dissolution of (αTi) is completed just below 1000 °C.
a shows the three-phase microstructure of alloy TAM2 (Ti-18.8Al-2.0Mo) quenched from 1000 °C. A similar microstructure consisting of (αTi), (βTi,Mo)o, and Ti3Al was also observed in the sample heat-treated at 900 °C, while after heat treatment at 800 °C only the two phases (βTi,Mo)o and Ti3Al were detected. Since no experiments were carried out for this alloy to determine whether the β-phase is ordered or not, we follow the calculations of Witusiewicz et al. [Citation13], according to which the β-phase should be ordered for this composition (this also applies for all other alloys, if not indicated otherwise).
Figure 3. BSE image of (a) alloy TAM2 (Ti-18.8Al-2.0Mo) quenched from 1000 °C showing a three-phase microstructure (αTi) (grey) + (βTi,Mo)o (bright) + Ti3Al (dark) and (b) alloy TAM3 (Ti-30.0Al-5.0Mo) quenched from 900 °C showing big (βTi,Mo)o (bright) grains with fine Ti3Al (dark) precipitates and Ti3Al at the grain boundaries.
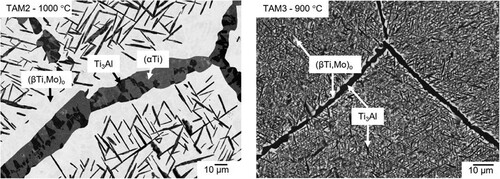
Between 800 and 1000 °C, (βTi,Mo)o and Ti3Al were identified as the constituents of the two-phase microstructure of alloy TAM3 (Ti-30.0Al-5.0Mo). At 800 and 900 °C, the microstructure consists of large (βTi,Mo)o grains with fine-scaled precipitates of Ti3Al. Similar to TAM2 (a), Ti3Al is also found at the grain boundaries (b). Measurements with a widened beam (Ø 10 µm) inside the grains yield compositions that are located on the tie-line determined by the compositions measured at the grain boundary. This proves that (βTi,Mo)o and Ti3Al are the only microstructure constituents. At 1000 °C, a similar but coarser microstructure is observed. EPMA measurements show that the compositions of Ti3Al and (βTi,Mo)o inside the grains are the same as at the grain boundaries, proving that the sample is in equilibrium and no concentration gradient is present.
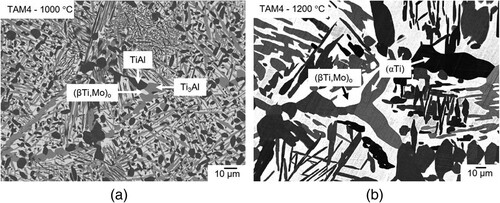
Alloy TAM4 (Ti-39.6Al-2.0Mo) was heat-treated between 800 and 1300 °C. Up to 1100 °C, this alloy clearly is three-phase (a). HEXRD measurements show that the phases present are (βTi,Mo)o, Ti3Al, and TiAl. At 1200 °C, Ti3Al and TiAl have transformed to (αTi) leaving (αTi) and (βTi,Mo)o as the equilibrium phases (b), and after quenching from 1300 °C, a single-phase (αTi) microstructure remains (which in some parts of the sample shows indications of the occurrence of a martensitic transformation during quenching).
Figure 4. BSE image of alloy TAM4 (Ti-39.6Al-2.0Mo) (a) heat-treated at 1000 °C showing a three-phase microstructure consisting of (βTi,Mo)o (bright), Ti3Al (grey), and TiAl (dark) and (b) heat-treated at 1200 °C showing a two-phase microstructure composed of (αTi) (dark) and (βTi,Mo)o (bright) (although there appear to be different dark contrasts, the measured compositions were found to be identical).
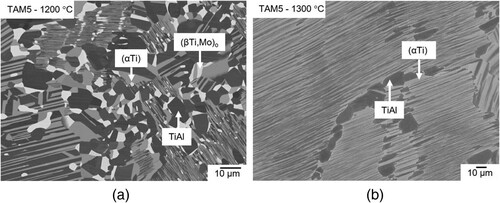
Alloy TAM5 (Ti-44.9Al-1.2Mo) was investigated at 1000, 1200 and 1300 °C. At 1000 °C the microstructure consists of the three phases (βTi,Mo)o, Ti3Al, and TiAl. At 1200 °C (a), three phases are still present, but Ti3Al has transformed to (αTi). The difference to TAM4 is the higher phase fraction of TiAl, which is due to a higher overall Al content of the alloy (44.9 instead of 39.6 at.% Al). The sample quenched from 1300 °C shows large grains with a lamellar two-phase microstructure of (αTi) and TiAl (b). This type of microstructure is characteristic for Ti-Al alloys in this composition range.
Figure 5. BSE image of alloy TAM5 (Ti-44.9Al-1.2Mo) (a) heat-treated at 1200 °C showing a three-phase microstructure consisting of (αTi) (grey), (βTi,Mo)o (bright), and TiAl (dark) and (b) heat-treated at 1300 °C showing a two-phase microstructure between (αTi) (bright) and TiAl (dark).
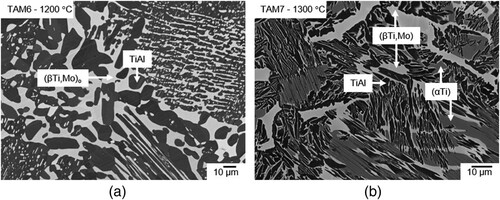
Alloy TAM6 (Ti-45.0Al-2.5Mo) shows a similar microstructure as alloy TAM5 at 1300 °C. At 1200 °C and below, the alloy composition is located in the two-phase field (βTi,Mo)o + TiAl (a). Similar observations were made for alloy TAM7 (Ti-44.6Al-3.7Mo) between 800 and 1200 °C. At 1300 °C, the composition of this alloy is located in the tie-triangle (αTi) + (βTi,Mo) + TiAl (b).
Figure 6. BSE image of (a) alloy TAM6 (Ti-45.0Al-2.5Mo) heat-treated at 1200 °C showing a two-phase microstructure composed of (βTi,Mo)o (bright) and TiAl (dark) and (b) alloy TAM7 (Ti-44.6Al-3.7Mo) showing a three-phase microstructure consisting of (αTi) (grey), (βTi,Mo) (bright), and TiAl (dark) after heat treatment at 1300 °C.
The microstructure of alloys TAM8 (Ti-45.0Al-5.0Mo), TAM9 (Ti-45.0Al-7.5Mo), and TAM10 (Ti-45.0Al-10.0Mo) is composed of the two phases (βTi,Mo)o and TiAl in the temperature range between 800 and 1200 °C (a–d). Between 1200 and 1300 °C, (βTi,Mo)o disorders in these three alloys, which is confirmed by DSC measurements (). Based on these results, the two phases present in the microstructure at 1300 °C are identified as disordered (βTi,Mo) and TiAl (for a discussion of the ordering behaviour of the (βTi,Mo) phase, see also Section 4.3).
Figure 7. BSE images of (a) alloy TAM8 (Ti-45.0Al-5.0Mo) heat-treated at 1000 °C, (b), (c) alloy TAM9 (Ti-45.0Al-7.5Mo) heat-treated at 900 and 1300 °C, respectively; (d) alloy TAM10 (Ti-45.0Al-10.0Mo) heat-treated at 1200 °C all showing a two-phase microstructure consisting of (βTi.Mo)/(βTi,Mo)o (bright) and TiAl (dark).
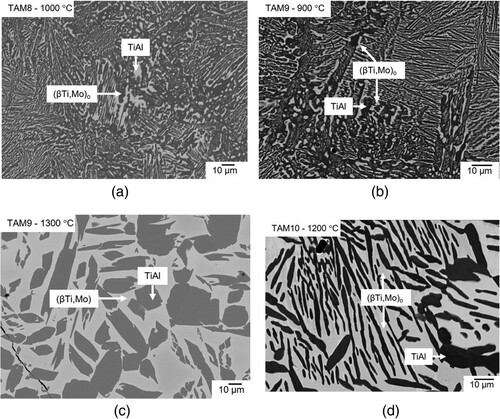
Table 11. Composition (from EPMA) and respective disordering temperature (determined by DSC) of the (βTi,Mo)o phase. The composition values are taken from the samples quenched from 1300 °C (). For the single-phase alloy TAM13, the analysed as-cast composition is given.
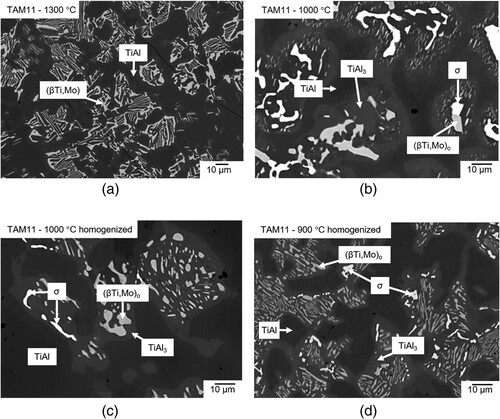
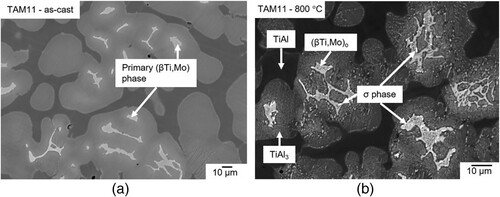
A two-phase equilibrium is observed in the microstructure of alloy TAM11 (Ti-56.1Al-10.9Mo) after heat-treatments between 1100 and 1300 °C (a). Based on HEXRD measurements, these two phases are identified as (βTi,Mo)/(βTi,Mo)o and TiAl. At temperatures below 1100 °C, the microstructure is more complex. b shows a BSE image of alloy TAM11 quenched from 1000 °C revealing four different contrasts. (βTi,Mo)o (light grey) and σ phase (bright) particles are surrounded by TiAl3 regions (dark grey), which in turn are surrounded by a TiAl matrix (dark). The presence of these four phases indicates that the sample is not in equilibrium (since in a three-component system, a maximum of three phases can be in equilibrium). Therefore, the sample was homogenised at 1300 °C for 48 h, as the alloy is in equilibrium at this temperature, as shown in a. However, after the subsequent heat treatment at 1000 °C, a microstructure similar to the non-homogenised alloy was observed (c). Similar observations were also made in samples heat-treated at 900 °C (d) and 800 °C. A detailed discussion about the phases which should be in equilibrium follows in Section 4.4.
Figure 8. BSE images of alloy TAM11 (Ti-56.1Al-10.9Mo) (a) heat-treated at 1300 °C showing a two-phase microstructure composed of (βTi,Mo) (bright) and TiAl (dark); (b) heat-treated at 1000 °C; (c) homogenised at 1300 °C for 48 h and subsequently heat-treated at 1000 °C; and (d) homogenised at 1300 °C for 48 h and subsequently heat-treated at 900 °C showing (βTi,Mo)o (grey), TiAl (dark), TiAl3 (light grey), and σ phase (bright) in their respective microstructures.
Alloy TAM12 (Ti-62.0Al-3.0Mo) is single-phase TiAl after heat treatment at 1200 and 1300 °C.
The results presented here and listed in are used to determine the isothermal sections, which are presented and discussed in the next section.
4. Discussion
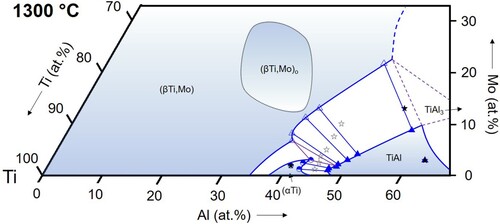
Based on the above presented experimental results, partial isothermal sections between 800 and 1300 °C () were determined. The isothermal section at 700 °C is not drawn due to the few own experimental data available. Data for the binary boundary systems Ti–Al and Ti–Mo were taken from the assessed phase diagrams reported in Refs. [Citation34–36], respectively. The dashed phase boundaries and three-phase fields are taken from our earlier review work [Citation14], which evaluated the literature available at that time on phase equilibria in the Ti–Al–Mo system. In the following four sections, the solubility limits of the ternary elements in the binary boundary phases, the position of the application-relevant (αTi)/Ti3Al + (βTi,Mo)/(βTi,Mo)o + TiAl three-phase field, the ordering behaviour of (βTi,Mo) in the ternary composition range, and the phase equilibria regarding the σ phase are discussed.
4.1. Solubility of ternary elements in the boundary phases (αTi), Ti3Al, (βTi,Nb), and TiAl
(αTi): From the binary Ti–Al phase diagram [Citation34, Citation35] it is known that the (αTi) solid solution exists in two separated phase fields, which are separated by the Ti3Al phase. This is also observed in the ternary Ti–Al–Mo system (). In the range of investigated temperatures between 800 and 1100 °C, (αTi) exists in a narrow composition range along the Al–Ti boundary with maximum Al contents increasing to >20 at.% and low Mo solubility (∼0.5 at.% in alloys TAM1 and TAM2). This is consistent with the equally low solubility values reported by Huang et al. [Citation12], who found a maximum Mo content of ∼1 at.%. At 1200 and 1300 °C, another phase field of (αTi) appears at higher Al contents, which extends further into the ternary composition triangle with increasing temperature ( and ). The maximum Mo content in this (αTi) phase field is reached in the three-phase equilibrium with (βTi,Mo) and TiAl. At 1300 °C this value lies around ∼3 at.% Mo (at a corresponding Al content of about 43 at.%). The values measured at 1200 and 1300 °C ( and ) are in agreement with those reported in the literature [Citation11, Citation12, Citation37].
Figure 9. Partial isothermal section of the Ti–Al–Mo system at 800 °C based on the experimental results listed in . The measured overall compositions of the samples are indicated by black stars (unfilled stars: as-cast or nominal alloy composition), the purple lines show the three-phase equilibria, and blue symbols and lines mark the analysed phase compositions and the resulting phase boundaries. The position of the dotted line, which marks the boundary between the disordered (βTi,Mo) and the ordered (βTi,Mo)o phase, is based on the modelling work of Witusiewicz et al. [Citation13] and the assessment by Distl et al. [Citation14].
![Figure 9. Partial isothermal section of the Ti–Al–Mo system at 800 °C based on the experimental results listed in Table 5. The measured overall compositions of the samples are indicated by black stars (unfilled stars: as-cast or nominal alloy composition), the purple lines show the three-phase equilibria, and blue symbols and lines mark the analysed phase compositions and the resulting phase boundaries. The position of the dotted line, which marks the boundary between the disordered (βTi,Mo) and the ordered (βTi,Mo)o phase, is based on the modelling work of Witusiewicz et al. [Citation13] and the assessment by Distl et al. [Citation14].](/cms/asset/361286c7-ff2e-4a79-bc2b-49f3e92c7ad1/tphm_a_2279575_f0009_oc.jpg)
Figure 10. Partial isothermal section of the Ti–Al–Mo system at 900 °C based on the experimental results listed in (symbols as in ).
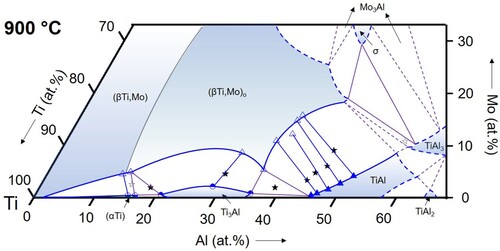
Figure 11. Partial isothermal section of the Ti–Al–Mo system at 1000 °C based on the experimental results listed in (symbols as in ).
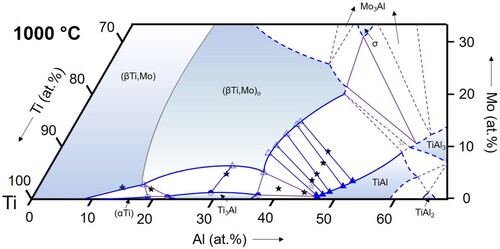
Figure 12. Partial isothermal section of the Ti–Al–Mo system at 1100 °C based on the experimental results listed in (symbols as in ).
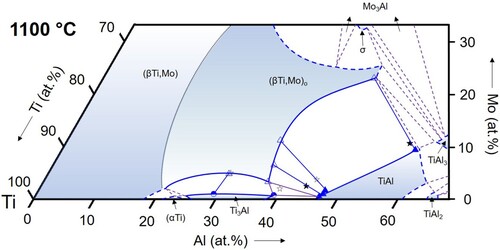
Figure 13. Partial isothermal section of the Ti–Al–Mo system at 1200 °C based on the experimental results listed in (symbols as in ).
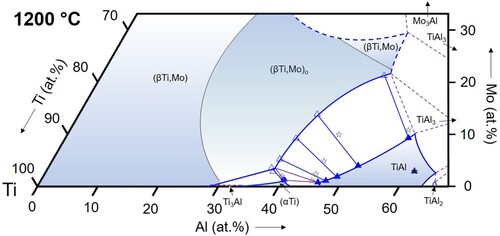
Figure 14. Partial isothermal section of the Ti–Al–Mo system at 1300 °C based on the experimental results listed in (symbols as in ).
Ti3Al: Ti3Al shows a similar low solubility for Mo as (αTi). The solubility reaches a maximum of about 2 at.% (alloy TAM3 at 900 °C, see ). These observations are in agreement with Huang et al. [Citation12]. Since the Mo solubility in alloys TAM1 ((αTi) + (βTi,Mo) + Ti3Al) and TAM4/TAM6 ((βTi,Mo) + Ti3Al + TiAl) is always lower than in alloy TAM3, this leads to a curved phase boundary, showing a shallow solubility maximum around 30 at.% Al, which is observable in all sections from 800 to 1100 °C ().
(βTi,Mo): The (βTi,Mo) solid solution extends far into the ternary composition triangle and its phase field even connects to the binary A2-disordered MoAl phase at temperatures above 1470°C [Citation16], which is special to the Ti–Al–Mo system. In the temperature range investigated here, the solubility for Al reaches a maximum value at 1300°C of about 48 at.% () and decreases with decreasing temperature to about 42.5 at.% at 800 °C (). The Mo content at these maximum solubility compositions also decreases with decreasing temperature from values of roughly about 30 at.% (not measured in the present study) at 1200 °C () to <20 at.% at 900 and 800 °C ( and 10). The evolution of the phase field of the B2-ordered (βTi,Mo)o phase is discussed below in Section 4.3.
TiAl: The maximum solubility of Mo in the TiAl phase was not measured here, but can be roughly estimated from the present investigations to increase slightly with temperature in the range from about 8 to 10 at.%, with the respective Al contents shifting from about 52 to 58 at.%. These data are in good agreement with those published by Huang et al. [Citation12], who reports a solubility of ∼9 at.% Mo for TiAl.
4.2. The three-phase field (αTi)/Ti3Al + (βTi,Mo)/(βTi,Mo)o + TiAl
Using the series of the six alloys TAM5-10 with 45 at.% Al and 1.25 to 10 at.% Mo (and alloy TAM4 with 40 at.% Al and 2 at.% Mo), the position of the three-phase field (αTi)/Ti3Al + (βTi,Mo)/(βTi,Mo)o + TiAl could be studied as a function of temperature. This three-phase field is of central importance for the development of Mo-containing TiAl-alloys and contradicting information about its position and/or the surrounding two-phase fields are reported in the literature [Citation4, Citation11, Citation37–43].
For the temperature range from 800 to 1100 °C, the present results show that the Ti3Al-TiAl boundary of the three-phase triangle is located very near to the Ti-Al binary system (below 1 at.% Mo for all temperatures, cf. ), and the (βTi,Mo)o corner shifts slightly to lower Mo contents with increasing temperature from ∼5 to ∼3 at.% Mo (see ). At higher temperatures of 1200 and 1300 °C, Ti3Al is replaced by (αTi). At 1300 °C, all phase compositions become enriched in Mo, shifting the entire three-phase field into the ternary system (see and ).
In the literature, experimental values for the phase compositions of the three-phase equilibrium are rarely reported and in most cases only special temperatures were studied. An exception is the work of Kainuma et al. [Citation37], who report phase compositions of the three-phase equilibrium at 1000, 1200, and 1300 °C. The resulting positions of the three-phase field agree well with the present study. While at 1000 °C there is excellent agreement (Ti-36.8Al-0.8Mo, Ti-35.5Al-5.5Mo, and Ti-46.3Al-0.6Mo reported by Kainuma et al. [Citation37], and Ti-37.0Al-0.8Mo, Ti-35.8Al-5.1Mo, and Ti-46.9Al-0.5Mo obtained in the present work for Ti3Al, (βTi,Mo)o, and TiAl, respectively), there is a small shift in the reported Al contents by about 1-2 at.% to higher values [Citation37]. Kimura et al. [Citation4, Citation11] reported an alloy of composition Ti-45.6Al-3.0Mo that is three-phase at 1200 and 1300 °C. This composition indeed falls into the three-phase field at 1300 °C presented in , while the isothermal section in indicates that this alloy should be two-phase (βTi,Mo)o + TiAl at 1200 °C. At lower temperatures of 1100, 1000, and 800 °C, the alloy was found to be two-phase (βTi,Mo)o + TiAl, which again is in perfect agreement with the present results. Li and Loretto [Citation38] studied an alloy of nominal composition Ti-44Al-2Mo after heat treatment at 1200 °C and observed a three-phase microstructure. Compared to the present isothermal section at 1200 °C, this alloy composition is located just outside of the three-phase field in the adjacent (βTi,Mo)o + TiAl two-phase field, but a slight shift in composition would be sufficient to bring the results into agreement. Das et al. [Citation39] performed heat treatments at 1240 and 1175 °C on a Ti-50Al-5Mo alloy. The obtained microstructure was found to be two-phase (βTi,Mo)o + TiAl in agreement with the present results (1200 °C isothermal section). In the studies of Singh et al. [Citation40] and Azad et al. [Citation41], no phase compositions were given and the times chosen for the heat treatments were very short (1 or 2 h at 1300 °C, 4 h at 1200 °C, and 6 h at 1100 °C), which – as even mentioned by the authors themselves, see [Citation40] – is not sufficient to reach equilibrium and does not allow a comparison with the present results. The only work in which results are presented that clearly do not seem to match the present ones are reported in Refs. [Citation42, Citation43]. The authors studied a series of alloys Ti-44Al-xMo with x = 1, 3, 5, and 7. According to their work, the 1300 °C equilibrium phases are (αTi) for x = 1 and (αTi) + (βTi,Mo) for x = 3-7, whereas according to our 1300 °C isothermal section () this instead should be (αTi) + TiAl for x = 1 (cf. also TAM5, and b), (αTi) + (βTi,Mo) + TiAl for x = 3, and (βTi,Mo) + TiAl for x = 5 and 7. While for x = 1 and 3, the difference might be explained by small shifts in chemical composition, the discrepancy is most striking for the high Mo contents, where (αTi) is reported instead of TiAl. Unfortunately, the phase compositions were not analysed in Refs. [Citation42, Citation43]. It is also worth mentioning that all the alloys studied in [Citation42, Citation43] contained a small amount of B (∼0.1 at.%). However, it is very questionable whether this can explain the surprising discrepancy.
4.3. Ordering bevaviour of (βTi,Mo)
As indicated by the dashed lines in the isothermal sections (), there are temperature-dependent composition ranges in the Ti–Al–Mo system where ordering occurs in the bcc (βTi,Mo) phase. Even though the extension of the phase field of this B2-type (βTi,Mo)o phase was not studied here in detail, the present results give some respective information. This refers in particular to the ordering state at the Al-rich boundary, where this phase can be in equilibrium with (αTi), Ti3Al, and/or TiAl.
A contour plot showing an overlay of the (βTi,Mo)o (and (βTi,Mo)) isothermal phase fields at 800–1400 °C is shown in . The disordering temperature of the (βTi,Mo)o phase depends on composition and reaches maximum values >1400°C (e.g. an order/disorder transition temperature of 1418 °C was measured for an alloy Ti-25Al-25Mo [Citation23]). The maximum stability is reached at a not exactly known composition in the range of Ti-25Al-25Mo. Room-temperature XRD investigations on a series of 1000 °C heat-treated samples had revealed that the stability is highest along the section TiAl-TiMo with an estimated maximum between about 25 and 30 at.% Mo [Citation18]. However, more recent ab initio calculations along this section indicate that maximum stability of the ordered state should be expected at about 18 at.% Mo [Citation19]. This maximum is marked by the black cross in , and the shape of the 1400 °C stability range, which is a rough estimate, was drawn to account for (i) this maximum, (ii) the finding that highest stability is along the section TiAl-TiMo, and (iii) the measured values of 1418 °C for Ti-25Al-25Mo from [Citation23] and 1394 °C for Ti-26.3Al-20.5Mo (TAM13, ).
Figure 15. Overlay of the stability ranges of B2-ordered (βTi,Mo)o (filled areas) from 800 to 1400 °C with the dashed lines showing the phase boundaries of the single-phase A2-(βTi,Mo) phase fields (the respective 1400 °C line of A2-(βTi,Mo) was taken from [Citation14] as this temperature was not investigated here). The Al-poor side of the filled areas corresponds to the A2/B2 transition lines shown as dotted lines in the isothermal sections in .
![Figure 15. Overlay of the stability ranges of B2-ordered (βTi,Mo)o (filled areas) from 800 to 1400 °C with the dashed lines showing the phase boundaries of the single-phase A2-(βTi,Mo) phase fields (the respective 1400 °C line of A2-(βTi,Mo) was taken from [Citation14] as this temperature was not investigated here). The Al-poor side of the filled areas corresponds to the A2/B2 transition lines shown as dotted lines in the isothermal sections in Figures 9–14.](/cms/asset/383a870d-2ec5-4b74-9653-653ae89a82e0/tphm_a_2279575_f0015_oc.jpg)
Of particular importance for the development of novel, Mo-containing TiAl-based alloys is the ordering state of the (βTi,Mo) phase at the Al-rich boundary, because for the processing of such alloys it is important to know if they contain the ductile (βTi,Mo) phase or the brittle ordered variant (βTi,Mo)o. The isothermal sections in show that up to 1200 °C this will be the ordered (βTi,Mo)o phase, while disordering takes place between 1200 and 1300 °C along the Al-rich boundary. This is confirmed by the DSC results on the three alloys TAM8-10 (), which are included in . The highest order/disorder temperature was measured for the middle alloy, which has a composition close to the TiAl-TiMo section (50.5 at.% Ti). This fits exactly to the assumption that stability of the ordered state is highest along this section, and in addition helps for a rough estimation of the 1300 °C stability range that is completely surrounded by disordered (βTi,Mo) (see also ).
4.4. Phase equilibria with the σ phase
The σ phase only exists up to a maximum temperature of 1166 °C. With respect to its phase equilibria with the three Mo-poorer phases (βTi,Mo)o, TiAl, and TiAl3, contradictory variants are reported in the literature [Citation10, Citation12, Citation13]. According to the work of Eremenko et al. [Citation10], who studied equilibria at 1000 °C, the four phases form the two three-phase equilibria (βTi,Mo)o + TiAl3 + σ and (βTi,Mo)o + TiAl + TiAl3. This was confirmed by the more recent investigations of Huang et al. [Citation12], while these authors reported a change of the equilibria at lower temperature to TiAl + TiAl3 + σ and (βTi,Mo)o + TiAl + σ at 800 and 900 °C. This means that the two-phase equilibrium in the middle between the two three-phase equilibria switches from (βTi,Mo)o + TiAl3 to TiAl + σ, i.e. a respective invariant transition-type reaction must take place between 900 and 1000 °C. In contrast to that, Witusiewicz et al. [Citation13] present isothermal sections at 800, 900, 1000, and 1100 °C where the equilibria given above for 1000 °C remain unchanged in the entire temperature range. In the present work, one alloy with a composition in the relevant composition range was investigated (TAM11, as-cast composition Ti-56.1Al-10.9Mo). As already described in Section 3 (‘Results’), no final thermodynamic equilibrium was reached for this Mo-rich alloy after the heat treatments at 800–1000 °C, so no direct conclusion can be drawn on the true equilibria. However, as will be discussed now, the results are in favour of the version of Witusiewicz et al. [Citation13] according to which the phase equilibria do not change in this temperature range.
As mentioned above, four different phases are present in the microstructure of alloy TAM11 heat-treated at 1000 °C and below (b–d). Attempts to establish equilibrium by prolonging the heat treatment times and by an additional preceding homogenisation at 1300 °C were unsuccessful, most likely related to the very slow diffusion of Mo. However, the microstructure of samples in the as-cast state and after heat treatment at 1300 °C, which both were used as starting materials for the heat treatments at 800–1000°C, gives important hints on the phases in equilibrium. As a shows, the as-cast microstructure consists of a Mo-rich primary solidified phase (Ti-45.3Al-19.5Mo), which is (βTi,Mo) as can be seen on the liquidus projection presented in Ref. [Citation14]. This phase is enclosed by a region of grey contrast (Ti-54.7Al-11.3Mo) and the rest of the microstructure shows a dark contrast (Ti-60.2Al-7.2Mo). A bright contrast, corresponding to the σ phase, as observed in the heat-treated alloys (b–d and b), is not visible in the as-cast microstructure, meaning that the σ phase has formed as a result of the heat treatment and must be one of the equilibrium phases. Moreover, the microstructure of this alloy after heat treatment at 1300 °C is two-phase (βTi,Mo) + TiAl (a). Since this material was also used as a starting material for heat treatments at 900–1100 °C, the two phases TiAl3 and σ that occur in the samples heat-treated at 900 and 1000 °C, must both be equilibrium phases at these temperatures.
Figure 16. BSE image of alloy TAM11 (Ti-56.1Al-10.9Mo) (a) in the as-cast condition showing solidification of primary (βTi,Mo) completely surrounded by a grey contrast and a dark contrast filling the left over space; (b) the heat-treated sample quenched from 800 °C showing first indications of formation of σ (bright).
In addition, when looking at the four-phase microstructures in Figures 8b–d and 16b, it is remarkable that TiAl (the dark matrix) is completely separated from the σ phase and (βTi,Mo) and is in contact only with TiAl3, while there are extended regions with three-phase mixtures (βTi,Mo) + TiAl3 + σ phase. It is this three-phase mixture that has been consistently identified as three-phase equilibrium at 1000 °C in Refs. [Citation10, Citation12, Citation13]. Since the four-phase non-equilibrium microstructures observed in TAM11 at 800, 900, and 1000 °C are qualitatively very similar to each other regarding the arrangement and morphology of the phases, and since there are no indications of an invariant reaction that may have occurred, it is cautiously concluded that the expected equilibrium phases at 800 and 900 °C do not change but are the same as those at 1000 °C (which is then consistent with [Citation10, Citation13]). The isothermal sections at 800–1100 °C () were drawn based on this assumption of a non-changing type of equilibria.
5. Conclusions
Based on the presented experimental results, seven partial isothermal sections of the Ti-Al-Mo system between 800 and 1300 °C were established focusing on the role of Mo additions to the Ti-Al-based phases (αTi), (βTi), Ti3Al, and TiAl.
The solubility of the ternary elements in Ti3Al and in the Ti-rich, low-temperature (αTi) phase is low (below about 2 and 1 at.% Mo, respectively). The Mo-solubility in the Ti-rich (αTi) phase increases with temperature and reaches 3 at.% at 1300 °C. For the TiAl phase, a maximum solubility in the range of 8–10 at.% can be estimated from the present experiments.
The (βTi) phase forms a continuous solid solution with Mo, and this (βTi,Mo) solid solution can dissolve up to 48 at.% Al (at 1300 °C) in the temperature range studied here. Within a temperature-dependent composition range, B2-type ordering occurs in the (βTi,Mo) phase. The maximum order/disorder transition temperature and the respective composition are not precisely known (but this temperature exceeds 1400 °C and the composition most probably lies on the section TiAl-TiMo, as indicated in the literature). The shrinkage of the phase field of the ordered (βTi,Mo)o phase is shown as a function of temperature in . The order/disorder temperature of the (βTi,Mo) phase occurring as equilibrium phase in alloys in the application-relevant composition range is in the range 1200–1300 °C. Along a series of alloys with 45 at.% Al and increasing amounts of Mo, it reaches its maximum value of 1287 °C for an addition of ∼7 at.% Mo.
The position of the three-phase triangle (αTi)/Ti3Al + (βTi,Mo)/(βTi,Mo)o + TiAl is very near to the Ti-Al boundary at temperatures up to 1100 °C and then slightly shifts into the ternary system at 1200 and 1300 °C due to the increasing solubility of Mo in (αTi).
As Mo is a very slowly diffusing element in Ti-Al-based alloys, thermodynamic equilibria with the σ phase (∼Ti-40Al-30Mo) were not reached in the present study within the applied heat treatment times. Nevertheless, the present results and a comparison with the partially contradicting information from the literature indicate that TiAl does not form equilibria with the σ phase, but instead there is a three-phase equilibrium (βTi,Mo) + TiAl3 + σ phase.
While the equilibria involving the σ phase still need to be studied in more detail, the Mo-poor part of the ternary system with compositions most relevant for the development of improved TiAl-based alloys has been well determined by the present investigations.
Acknowledgments
The authors gratefully acknowledge funding from the Clean Sky 2 Joint Undertaking under the European Union’s Horizon 2020 research and innovation program under grant agreement No. 820647. The authors are also grateful for the HEXRD measurements, which were performed and evaluated by Dr. Katja Hauschildt and Prof. Florian Pyczak from Helmholtz-Zentrum Hereon.
Disclosure statement
No potential conflict of interest was reported by the author(s).
Additional information
Funding
References
- H.D. Kessler and M. Hansen, Transformation kinetics and mechanical properties of titanium-aluminum-molybdenum alloys. Trans. Amer. Soc. Met. 46 (1954), pp. 587–608.
- F.A. Crossley, W.F. Carew and D.W. Levinson. Development of Titanium-Base Alloys for Elevated Temperature Application, WADC-TR 54-278, Armour Research Foundation of Illinois Inst. of Tech., Chicago, Wright-Patterson Air Force Base, Ohio, Pt. 1&2 (1954), Pt. 3 (1956), Pt. 4 (1957).
- W. Knorr, Properties and heat treatment of the titanium alloy TiAl7Mo4 (in German). Techn. Mitt. Krupp 17 (1959), pp. 111–123.
- M. Kimura, K. Hashimoto and H. Morikawa, Study on phase stability in Ti-Al-X systems at high temperatures. Mater. Sci. Eng. A 152 (1992), pp. 54–59.
- S. Mayer, P. Erdely, F.D. Fischer, D. Holec, M. Kastenhuber, T. Klein and H. Clemens, Intermetallic β-solidifying γ-TiAl based alloys − from fundamental research to application. Adv. Eng. Mater 19 (2017), pp. 1600735.
- N. Abdoshahi, M. Dehghani, L. Hatzenbichler, P. Spoerk-Erdely, A.V. Ruban, M. Musi, S. Mayer, J. Spitaler and D. Holec, Structural stability and mechanical properties of TiAl + Mo alloys: a comprehensive ab initio study. Acta Mater. 221 (2021), pp. 117427.
- S. Djanarthany, J. Viala and J. Bouix, An overview of monolithic titanium aluminides based on Ti3Al and TiAl. Mater. Chem. Phys 72 (2001), pp. 301–319.
- H. Clemens and S. Mayer, Design, processing, microstructure, properties, and applications of advanced intermetallic TiAl alloys. Adv. Eng. Mater 15 (2013), pp. 191–215.
- B.P. Bewlay, M. Weimer, T. Kelly, A. Suzuki and P.R. Subramanian, The science, technology, and implementation of TiAl alloys in commercial aircraft engines. MRS Proc 1516 (2013), pp. 49–58.
- V.N. Eremenko, L.A. Tretyachenko, S.A. Sukhaya, and V.M. Petukh, Investigation of the Structure of Alloys of the Ti-Mo-Al System (in Russian), Physico-Chemical Investigation of Binary and Ternary Systems of Transition Metals of IV-VIII Groups of the Periodic System and Development of Principles for Control of Mechanical Properties of Alloys on Their Base, Final Report, Theme 2.26.30, State Regist. No. 01 86 0 060682, Akad. Nauk Ukr. SSR, Frantsevich Institute for Problems of Materials Science, Kyiv, Ukraine (1990), pp. 83–135, 141–143.
- M. Kimura and K. Hashimoto, High-temperature phase equilibria in Ti-Al-Mo system. J. Phase Equilib 20 (1999), pp. 224–230.
- X.M. Huang, L.L. Zhu, G.M. Cai, H.S. Liu and Z.P. Jin, Experimental investigation of phase equilibria in the Ti–Al–Mo ternary system. J. Mater. Sci. 52 (2017), pp. 2270–2284.
- V. Witusiewicz, A. Bondar, U. Hecht, O. Stryzhyboroda, N. Tsyganenko, V. Voblikov, V. Petyukh and T.Y. Velikanova, Thermodynamic re-modelling of the ternary Al-Mo-Ti system based on novel experimental data. J. Alloys Compd 749 (2018), pp. 1071–1091.
- B. Distl, A. Walnsch, R.F.L. Mellor, L. Gomell, M. Noori, A. Gedsun, and F. Stein, Al-Mo-Ti ternary phase diagram evaluation, MSI Eureka, Ternary Evaluations, Watson, A. (Ed.), MSI, Materials Science International Services GmbH, Stuttgart Doc-ID: 10.17143.3.2 (2021).
- T.B. Massalski, Binary Alloy Phase Diagrams, 2nd ed., ASM International, Metals Park, OH, USA, 1990.
- R. Nino, J. Fujinaka, H. Shimamura, S. Miura and T. Mohri, Phase equilibria and microstructure evolution of Al-Mo-Ti ternary alloys. Intermetallics 11 (2003), pp. 611–623.
- D.M. Cupid, O. Fabrichnaya, F. Ebrahimi and H.J. Seifert, Thermodynamic assessment of the Al–Mo system and of the Ti–Al–Mo system from 0 to 20at.% Ti. Intermetallics 18 (2010), pp. 1185–1196.
- H. Böhm and K. Löhberg, A superlattice of the CsCl-type in the system Ti-Mo-Al (in German). Z. Metallkd 49 (1958), pp. 173–178.
- D. Holec, D. Legut, L. Isaeva, P. Souvatzis, H. Clemens and S. Mayer, Interplay between effect of Mo and chemical disorder on the stability of β/βo-TiAl phase. Intermetallics 61 (2015), pp. 85–90.
- N. Abdoshahi, P. Spoerk-Erdely, M. Friák, S. Mayer, M. Šob and D. Holec, Ab initio study of chemical disorder as an effective stabilizing mechanism of bcc-based TiAl + Mo. Phys. Rev. Mater 4 (2020), pp. 103604.
- M. Dehghani, A.V. Ruban, N. Abdoshahi, D. Holec and J. Spitaler, Stability and ordering of bcc and hcp TiAl + Mo phases: an ab initio study. Comput. Mater. Sci. 205 (2022), pp. 111163.
- P. Alonso and G. Rubiolo, Relative stability of bcc structures in ternary alloys with Ti50Al25Mo25 composition. Phys. Rev. B 62 (2000), pp. 237–242.
- K. Das and S. Das, Order-disorder transformation of the body centered cubic phase in the Ti-Al-X (X = Ta, Nb, or Mo) system. J. Mater. Sci. 38 (2003), pp. 3995–4002.
- R. Hansen and A. Raman, Alloy chemistry of σ (β-U)-related phases. III. σ-Phases with non-transition elements. Z. Metallkd 61 (1970), pp. 115–120.
- J. Braun and M. Ellner, On the partial atomic volume of aluminium in the titanium-rich phases of the binary system Ti-Al. Z. Metallkd 91 (2000), pp. 389–392.
- J. Braun, M. Ellner and B. Predel, Experimental investigations of the structure and stability of the TiAl phases (in German). Z. Metallkd 86 (1995), pp. 870–876.
- J. Braun and M. Ellner, X-ray high-temperature in situ investigation of the aluminide TiAl2 (HfGa2 type). J. Alloys Compd. 309 (2000), pp. 118–122.
- J. Braun and M. Ellner, Phase equilibria investigations on the aluminium-rich part of the binary system Ti-Al. Metal. Mater. Trans. A 32 (2001), pp. 1037–1047.
- R. Kainuma, M. Palm and G. Inden, Solid-phase equilibria in the Ti-rich part of the Ti–Al system. Intermetallics 2 (1994), pp. 321–332.
- B. Distl, K. Hauschildt, F. Pyczak and F. Stein, Phase equilibria in the Ti-rich part of the Ti–Al–Nb system Part II. High-temperature phase equilibria between 1000 and 1300 °C. J. Phase Equilib. Diffus 43 (2022), pp. 554–575.
- X. Llovet, A. Moy, P.T. Pinard and J.H. Fournelle, Electron probe microanalysis: a review of recent developments and applications in materials science and engineering. Prog. Mater. Sci 116 (2021), pp. 100673.
- N. Schell, A. King, F. Beckmann, T. Fischer, M. Müller and A. Schreyer, The high energy materials science beamline (HEMS) at PETRA III. Mater. Sci. Forum 772 (2013), pp. 57–61.
- B. Distl, K. Hauschildt, B. Rashkova, F. Pyczak and F. Stein, Phase equilibria in the Ti-rich part of the Ti–Al–Nb system Part I. Low-temperature phase equilibria between 700 and 900 °C. J. Phase Equilib. Diffus 43 (2022), pp. 355–381.
- J.C. Schuster and M. Palm, Reassessment of the binary aluminium-titanium phase diagramm. J. Phase Equilib. Diffus 27 (2006), pp. 255–277.
- M. Palm, Al-Ti binary phase diagram evaluation, MSI Eureka, Binary Evaluations, Effenberg, G. (Ed.), MSI, Materials Science International Services GmbH, Stuttgart Doc-ID: 20.15634.2.4 (2020).
- J. Murray, The Mo-Ti (Molybdenum-Titanium) System, in Phase Diagrams of Binary Titanium Alloys, ASM International, Materials Park, OH, USA, 1987. pp. 169–175.
- R. Kainuma, Y. Fujita, H. Mitsui and K. Ishida, Phase Equilibria among α (hcp), β (bcc) and γ (L10) phases in Ti–Al base ternary alloys. Intermetallics 8 (2000), pp. 855–867.
- Y.G. Li and M.H. Loretto, Microstructure and fracture behaviour of Ti-44Al-xM derivatives. Acta Metall. Mater 42 (1994), pp. 2913–2919.
- S. Das, J.C. Mishurda, W.P. Allen, J.H. Perepezko and L.S. Chumbley, Development of a (γ+βo) lamellar microstructure in a Ti45Al50Mo5 alloy. Scr. Metal. Mater 28 (1993), pp. 489–494.
- A.K. Singh and D. Banerjee, Transformations in α2+γ titanium aluminide alloys containing molybdenum: Part II. Heat treatment. Metall. Mater. Trans. A 28 (1997), pp. 1745–1753.
- S. Azad, R.K. Mandal and A.K. Singh, Effect of Mo addition on transformation behavior of (α2+γ) based Ti–Al alloys. Mater. Sci. Eng. A 429 (2006), pp. 219–224.
- T. Schmoelzer, S. Mayer, C. Sailer, F. Haupt, V. Güther, P. Staron, K.-D. Liss and H. Clemens, In situ diffraction experiments for the investigation of phase fractions and ordering temperatures in Ti-44 at% Al-(3-7) at% Mo alloys. Adv. Eng. Mater. 13 (2011), pp. 306–311.
- M. Musi, H. Clemens, A. Stark, P. Staron and P. Spoerk-Erdely, Phase transformations and phase stability in the Ti–44 at.%Al–(0–7 at.%)Mo system. Intermetallics 143 (2022), pp. 107484.