
 ?Mathematical formulae have been encoded as MathML and are displayed in this HTML version using MathJax in order to improve their display. Uncheck the box to turn MathJax off. This feature requires Javascript. Click on a formula to zoom.
ABSTRACT
The photovoltaic-thermal (PV/T) hybrid collector is the most generative technology solar energy, which has been invented to utilise electrical energy and heat from the solar system. This paper presents a numerical analysis and experimental validation of the thermal and electrical behaviour of the air PV/T collector based on the geometric design and the Tunisia climate conditions. PV/T system has lower thermal efficiency and higher electrical efficiency (14%) at high wind speeds. To improve the thermal efficiency, a sensitivity analysis studied across a range of the air channel depth (0.01–0.08 m) with different air mass flow rate. It was concluded that the thermal energy for a PV/T air system depends on the optimal depth and variations in mass flow rate.
1. Introduction
In a photovoltaic panel, converting light into energy releases heat in the collector and increases the temperature of photovoltaic cells. This increase in temperature brought down the electrical efficiency of the collector. The operating temperature is an important parameter in the behaviour of photovoltaic cells and modules due to their exposure to a solar energy flow of up to 1 kW/m2. Around 20% of the incident solar flux is converted into electricity (Armstrong and Hurley Citation2010) and 80% of the energy not converted into electricity is mainly dissipated into heat (Bhubaneswari, Iniyan, and Ranko Citation2011). Therefore, in the absence of adequate ventilation, the temperature of the photovoltaic cell can reach more than 70°C at noon. In this case, there is a slight increase in current due to the decrease in band gap width and a significant decrease in voltage (−0.4%/K) due to a large increase in direct diode current (Coventry Citation2005; Najafi, Najafi, and Hoseinpoori Citation2011; Babu and Ponnambalam Citation2017). To summarise, the increase in temperature results in a decrease in power (−0.35%/K) and especially in a displacement of the maximum power point (MPP) (IMPP, VMPP), which requires an adaptation of the load value. The photovoltaic-thermal hybrid collector PV/T can turn this disadvantage into an advantage.
Photovoltaic-thermal (PV/T) solar technologies are better known as a co-generation process, which can simultaneously generate thermal and electrical energy. The heat released by the conversion is used to produce hot air, or to heat the home or in other application such as drying.
With this type of hybrid photovoltaic-thermal system, the overall efficiency of the installation is thus clearly higher than that of a conventional panel (an increase of 13–20% thanks to cooling) (Coventry Citation2005; Armstrong and Hurley Citation2010; Bhubaneswari, Iniyan, and Ranko Citation2011; Najafi, Najafi, and Hoseinpoori Citation2011; Michael, Iniyan, and Goic Citation2015; Babu and Ponnambalam Citation2017). To cool the photovoltaic cells and increase their electrical efficiency, Khelifa et al. (Citation2016) developed a mathematical model of the PV/T system, which models the production of electricity and thermal energy for heating water. Also, Ni et al. (Citation2018) studied the effect of Nanofluid-based Spectral Splitting on the PV/T system in combined heating and power application. Shan, Cao, and Fang (Citation2013) have developed a digital model to predict the performance transients of building PV thermal collectors with water heating for environmental conditions in Jiangsu, China. A study of the performance and a comparative economic analysis of different designs of PV/T sheet – tube collectors, with thermal solar collector and PV module under Monastir (Tunisia) climatic conditions have been investigated by Rejeb, Dhaou, and Jemni (Citation2015). A recent study experimentally investigated was firstly conducted to study PV/T and PV/T-PCM systems with Yang et al. (Citation2018). A hybrid PV/T-PCM system was established for studying performance comparison of PV/T-PCM system and PV/T system. The results proved that the PV/T-PCM system gave better solar electrical efficiencies and higher thermal efficiency than a PV/T system. A study of a concentrated PV/T system using linear Fresnel lens has been studied with Karimi et al. (Citation2017), where they did evaluates the performance of pure thermal and integrated PV/T solar system under a concentrated linear Fresnel lens (5.85 Sun). With an experimental parameter study to optimise the basic configuration of the system, the thermal and electrical efficiency of the system reached 27.7 and 13% respectively, for a study by Assoa et al. (Citation2017). A dynamic model for a hybrid Photovoltaic Thermal Collector-Solar Air Heater (PV/T SAH) with longitudinal fins has been developed by Fan et al. (Citation2017). To provide high-temperature outlet air (60–90°C), an experimental investigation on performance analysis of air type photovoltaic thermal collector system integrates a cooling fins design was done by Mojumder et al. (Citation2016). The maximum thermal and electrical efficiencies were about 56.19 and 13.75%, respectively, for 4 fins with 0.14 kg/s of mass flow rate and 700 W/m2 of solar radiation. H. Mortezapour et al. (Citation2012) presented analytically and experimentally the performance evaluation of a thermal hybrid photovoltaic collector with two air passages, a PV/T glass-to glass and a PV/T glass Tedlar. The results showed that the PV/T glass - glass has a higher air outlet temperature; the cell also has a higher thermal efficiency than a PV/T glass PV/T glass Tedlar. K. Touafek, Haddadi, and Malek (Citation2013) presented a new design of a hybrid collector where it has two absorbent plates, one below the photovoltaic cells and the other above the insulating layer in order to increase the overall performance of the hybrid collector.
The performance between four solar device configurations of photovoltaic-thermal air collector has been studied theoretically and experimental from many researchers (Hegazy Citation2000; Chin, Salam, and Ishaque Citation2015; Slimani et al. Citation2017; Yazdanifard and Ameri Citation2018) based on the energy balance concept. In these designs, the air flows: above the absorber, below the absorber, on both sides of the absorber as single pass and a double-pass hybrid solar air collector. To estimate electrical and thermal efficiency for the PV/T system, two types of air PV/T designs were realised and practiced by Mojumder et al. (Citation2017) using the Extreme Learning Machine (ELM) into the air type PV/T technology for cooling with fin design in the collector. Gagliano et al. (Citation2019) compared the performance of each of the PV/T systems and the system of conventional solar power plants for a residential unit located in different geographical areas: Catania (IT), Split (HR), and Freiburg (D). Hwi et al (Choi et al. Citation2020) have studied the performance of a water heating system by using a heat pump in a PV/T air collector. Sarhaddi et al. (Citation2010, Citation2010) have optimised two air PV/T systems, one on the thermal and electrical performance evaluation of a solar PV/T air and the other on the exergy analysis. They analysed the variation in system output as a function of air velocity. The results of their work indicated that the overall exergy efficiency increases from 10 to 11.1% for an optimal air velocity of 4.5 m/s. Furthermore, there are studies by Farshchimonfared, Bilbao, and Sproul (Citation2016). for the optimisation and sensitivity analysis of a photovoltaic-thermal (PV/T) air system related to a typical residential building in Australia. They found that the design of the air PV/T system with a smaller depth proved to offer good performance at a higher air temperature rise, but this design is very sensitive to changes in air mass flow.
These studies show the growing research attention on the technologies of PV/T collectors. It was observed that he has much application that has been conducted for the development of renewable energy and especially solar energy. Various technological solutions have been introduced, such as hybrid PV/T solar collectors. They make it possible to improve the efficiency of the photovoltaic panels by recovering the thermal energies that they dissipate using a coolant.
The main objective of this article gave an idea about the best circumstances to install a PV/T system in a country. This work mainly aims at numerical analyses and experimentally evaluating the performances of hybrid PV/T collector, the use of new thermal insulation (Bakelite plate) has been performed to obtain good cooling of the solar PV cells to minimise their operating temperature and maximise the overall efficiency of the collector.
2. Methodology
2.1. Design and material
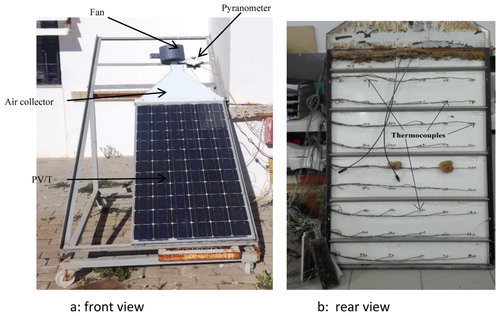
The schematic diagram of the hybrid-studied collector is shown in describing its design and mode of operation. The designed PV/T system was placed on a metal support with the possibility to change the angle of inclination (). The airflow entering the channel formed by the PV module and the rear insulating plate, which has been made in a sealed manner to prevent air leakage, has the main role of lowering the temperature of the cells PV to improve their yields. The experimental device contains a 5W air suction fan placed at the top of the collector, allowing the evacuation of the air entering for different flow rates. In addition, this system provides us thermal energy that will be exploited in different applications.
Figure 1. The cross-sectional view of a PV/T air collector.
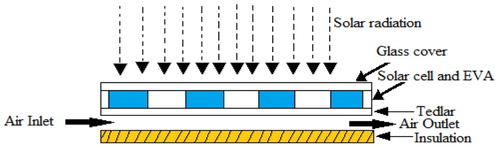
Figure 2. Air PV/T experimental device.
The PV module and PV/T collector specifications used in this work are given in , and , respectively.
Table 1. Specifications of PV panel.
Table 2. Specifications of PV/T collectors.
Table 3. Uncertainty of measured variables.
2.2. Experimental system
An experimental study of the PV/T system was carried out to evaluate these electrical, thermal and combined performances. The PV module of the hybrid collector studied is composed of 60 monocrystalline silicon solar cells, whose nominal power is 250 Watts, a pyranometer for the measurement of solar radiation and an anemometer at the outlet for measuring the airflow.
In the temperature measurement system, a data logger with the infrared thermometer was used with 28 thermocouples (type J) to measure the average temperature at different points of the top and rear surface of the PV/T collector, input air temperature and output air temperature.
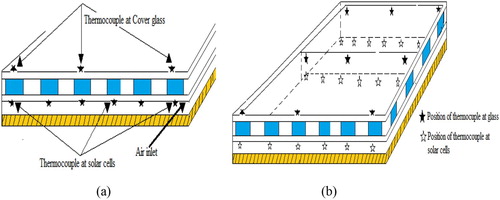
The thermocouple distributions in the temperature measurement system are as follows:
The thermocouple for ambient temperature is located outdoors in a well-ventilated area, about 1 m from the ground, away from sunlight.
6 thermocouples are used to measure the average temperatures of the first six solar cells of the photovoltaic panel, (a).
6 thermocouples are used to measure the average temperatures of the six solar cells located at the centre of the photovoltaic panel, (a).
6 thermocouples are used to measure the average temperatures of the last six solar cells of the photovoltaic panel, (a).
9 thermocouples placed on the surface of the glass placed as 3 in front, 3 in the middle and 3 at the top as shown in (b).
Figure 3. Details the thermocouple positions in the PV/T collector.
3. The thermoelectric models of a PV/T system
3.1. Electrical circuit models of PV cells
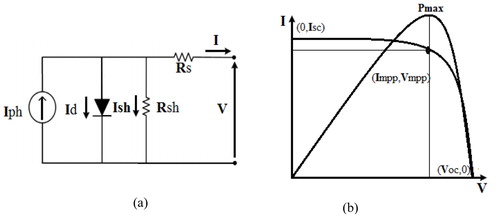
Many models of photovoltaic cells have been used as a model of references to describe their behaviour. The model most used to predict energy production in photovoltaic cell modelling is the single diode circuit model (Chin, Salam, and Ishaque Citation2015; Mojumder et al. Citation2017; Yazdanifard and Ameri Citation2018; Chouder et al. Citation2012; Salas et al. Citation2006), as shown in . In this model, there is a current source Iph, which depends on the cell temperature and solar radiation, a diode whose reverse saturation current I0 is mainly dependent on the operating temperature, a series resistor Rs and a shunt resistor Rsh, taking resistive losses into account. The current-to-voltage characteristic of a PV model can be expressed by:
(1)
(1) where Iph is the light current, I0 the diode reverse saturation current, the modified idealist factor is
, the idealist factor n (equal to 1 for an ideal diode), Boltzmann’s constant
, q the electronic charge
and
is the PV module temperature (K).
Figure 4. (a) Equivalent circuit of the single diode model of PV cell; (b) Theoretical I-V Characteristic of a PV cell.
3.2. The reference parameters
The above-described model parameters depend on the cell temperature, background solar radiation and their reference values of the specified operating conditions. The most convenient approach is to estimate them using the information available in the PV module manufacturer’s data sheet. For the energy irradiance 1 kW/m2 and the cell temperature 25°C, are called STC (Standard Test Conditions). Photovoltaic module conditions to the initial equations: (ISC, STC, 0); (0, VOC, STC); the MPP (IMPP,STC, VMPP,STC), reciprocal of slope at short circuit point () and reciprocal of slope at open circuit point (
). The parameters of the model are explicitly calculated as follows (Chin, Salam, and Ishaque Citation2015; Gagliano et al. Citation2019; Chouder et al. Citation2012; Salas et al. Citation2006):
The short-circuit current density , determined for V = 0, is directly proportional to the solar irradiance:
(2)
(2) We deduce the open-circuit voltage
by cancelling the current
:
(3)
(3)
(4)
(4)
(5)
(5)
(6)
(6)
3.3. Dependence of the parameters on operating conditions
The parameters of the operating conditions depending on temperature and solar irradiance can be found using the following equations (Sarhaddi et al. Citation2010; Mortezapour et al. Citation2012; Yazdanifard and Ameri Citation2018; Chouder et al. Citation2012; Salas et al. Citation2006).
(7)
(7)
(8)
(8)
(9)
(9)
(10)
(10)
(11)
(11)
(12)
(12)
(13)
(13)
(14)
(14)
(15)
(15)
(16)
(16)
(17)
(17)
(18)
(18) where
the energy of the band gap, G is the solar radiation absorbed,
are the temperature coefficients and
the static coefficients.
The power output by the PV model is P = IV, and at the maximum operating point:
(19)
(19) The filling factor FF is defined by the ratio:
(20)
(20) The efficiency of the photovoltaic conversion
is calculated from the measurement of the maximum power Pmax deviated by the product of the solar irradiance G (W/m2) and panel area
as defined by the following equation:
(21)
(21)
3.4. Thermal models
The thermal modelling of the studied system is based on the heat balance equations of each component of the studied device resulting from the different heat transfer that occur during the operation of the system. The following schematic () shows the electrical analogy of thermal transfers in the hybrid collector. Heat exchanges at the collector level are carried out according to the three known heat exchange modes: conduction, convection and radiation.
Figure 5. Schematic representation of thermal resistances in a hybrid air collector.
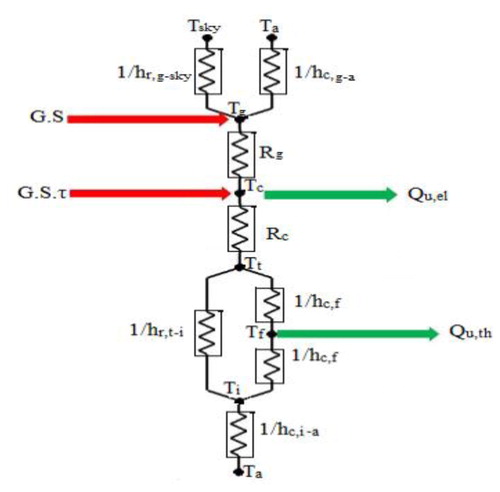
Where ,
and R the thermal resistances by radiation, convection and conduction between the different components of the system respectively:
Qu,el: Electric power produced by PV cells
Qu,th: Thermal power produced by the PV module
For the glass cover:
(22)
(22) The equivalent temperature of sky is given by the relation (Shan, Cao, and Fang Citation2013; Khelifa et al. Citation2016)
(23)
(23) The radiative heat transfer coefficient
(24)
(24) The convective heat coefficient due to the wind is described by the following relation (Sarhaddi et al. Citation2010; Farshchimonfared, Bilbao, and Sproul Citation2016):
(25)
(25) The conductive heat transfer is made through the adjacent components of the solar device. The heat transfer coefficient in this case is expressed between two neighbouring components n and m by the following relation (Rejeb, Dhaou, and Jemni Citation2015):
(26)
(26) For the PV solar cells:
(27)
(27)
The electric power produced by the hybrid collector is given by the following equation (Touafek, Haddadi, and Malek Citation2013; Slimani et al. Citation2017):
(28)
(28) where
(29)
(29) For the Tedlar layer:
(30)
(30) The radiative heat transfer coefficient between Tedlar and insulation is determined by the following equation (Touafek, Haddadi, and Malek Citation2013; Khelifa et al. Citation2016).
(31)
(31) For the air flowing in the duct:
(32)
(32) The following linear differential equation is obtained:
(33)
(33) Form Equation (33), the distance-dependent temperature of air flow is:
(34)
(34) where
(35)
(35) The outlet temperature of airflow is:
(36)
(36) The rate of useful thermal energy obtained from the PV/T air collector is:
(37)
(37) For the thermal insulator:
(38)
(38) where hp the overall heat loss coefficient to the atmosphere (Touafek, Haddadi, and Malek Citation2013; Slimani et al. Citation2017):
(39)
(39) The Nusselt number that is defined by calculates the convective heat transfer coefficient in enclosed spaces (Slimani et al. Citation2017):
(40)
(40) where k the thermal conductivity and
the equivalence diameter of the channel
(41)
(41) The Nusselt number to calculate the heat transfer coefficient inside the cannel formed by the back surface of the absorber plate of the collector for turbulent flow regime (Ni et al. Citation2018):
Turbulent flow regime (Re > 2300):
(42)
(42) Prandtl number is defined by the following relationship:
(43)
(43)
: is the dynamic viscosity of the coolant, Cp indicates the specific heat capacity at constant pressure and
designates the thermal conductivity of the fluid.
The dimensionless Reynolds number is the significant parameter that describes the fluid flow characteristics. For fluid flow through a pipe, the Reynolds number can be defined as:
(44)
(44)
: is the mean fluid velocity, vc kinematic viscosity coefficient and D the equivalence diameter of channel.
4. Results and discussion
4.1. Experimental validation
Experimental results for the PV/T air collector are compared with those obtained by simulation. The measured data are the short circuit current, the open circuit voltage, the cell temperature, the outlet air temperature and the solar radiation. The simulated results were compared to the experimental measurements using the following equation (Karimi et al. Citation2017; Yazdanifard and Ameri Citation2018), which evaluates the percentage mean square deviation (RMSD):
(45)
(45) where N is the number of the experiments carried out.
The experimental and simulated values of the short-circuit current and open-circuit voltage during the test day are shown in and , respectively.
Figure 6. The simulated and experimental values of short-circuit current during the test day.
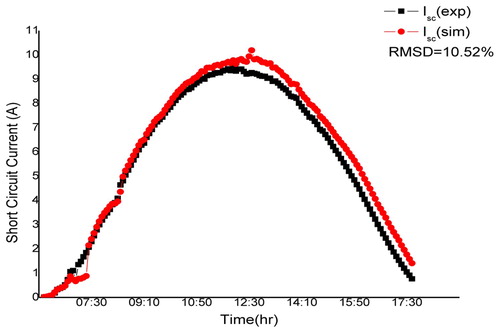
Figure 7. The simulated and experimental values of open-circuit voltage during the test day.
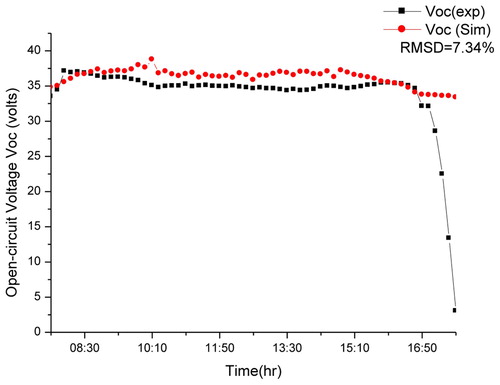
The mean square root values are 7.34% for the open-circuit voltage and 10.52% for the short-circuit current. It can be seen that there is a good agreement between the simulated values and the experimental values for these two parameters.
The simulated values of the air temperature at the collector outlet, the temperature of the solar cells, and the correspondence of the experimental data measured during the test day are shown in and .
Figure 8. The simulated and predicted values of outlet air temperature and the corresponding experimentally measured data during the test day.
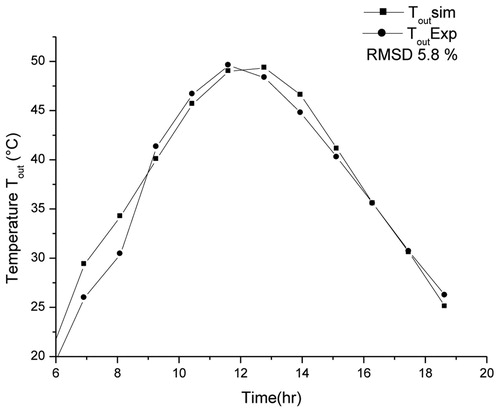
Figure 9. The simulated and predicted values of solar cell temperature and the corresponding experimentally measured data during the test day.
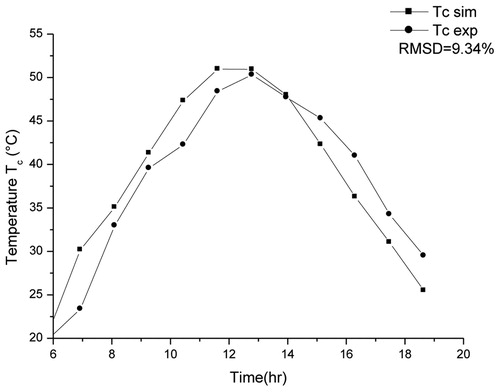
In these figures, there is a fairly good agreement between the experimental values and the simulated values of these parameters. In addition, the percentage of the average square root is 5.8% for the outlet temperature, 9.34% for the cell temperature.
On the figures giving comparisons of experimental data and simulated data, the theoretical values are sometimes higher and sometimes lower than the experimental values. These differences could probably be justified by the assumptions proposed in the theoretical model. Nevertheless, through these figures and according to the relative error between these values (not exceeding a maximum of 10%). There is a good agreement between the experimental results and those from the proposed numerical model.
4.2. Parametric studies
4.2.1. Study PV energy
The solar radiation and the temperature of photovoltaic cell are two parameterised important in the PV module. In this part, we have studied their impact on the short-circuit current, the open-circuit voltage and the variation of the MPP tracker (IMPP, VMPP).
According to , when the temperature increases for a constant radiation, the open-circuit voltage Voc decreases strongly and the short-circuit current Isc increases slightly. It can be seen that the short-circuit current Isc varies in proportion to the radiation. Likewise, the open circuit voltage Voc varies proportionally with the amount of radiation but very little.
Figure 10. Variation short-circuit current and open -circuit voltage as a function of cell temperature and solar radiation.
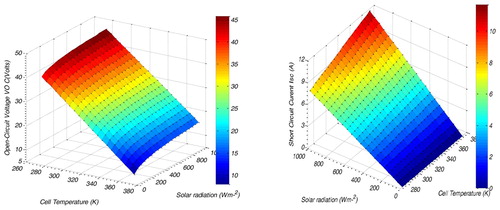
The temperature is the most influential factor on the behaviour of the photovoltaic cell.
The reason for the temperature increase includes the increase of the energy drain, the reduction of the p–n junction capacity and the increase of the mobility of the load carrier.
In , the relationship between solar cell temperature and electrical energy is illustrated. The vertical axis is the maximum output power and the horizontal axes represent the cell temperature and solar radiation.
Figure 11. Variation maximum power as a function of cell temperature and solar radiation.
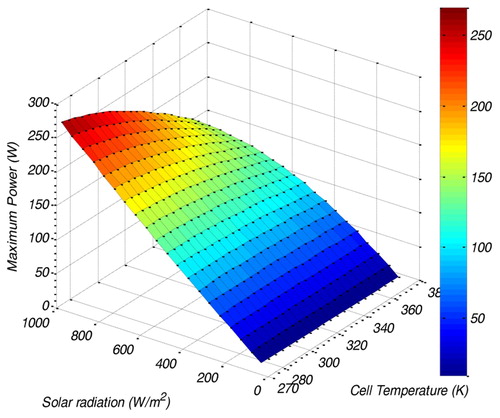
The electrical power of the solar cells obviously decreases as the operating temperature of the solar cells increases. The results illustrated in clearly show the variation of the maximum power of the photovoltaic module as a function of temperature and radiation.
We can also see on the graph, the existence of maximum on the power curves. These points correspond to the MPPs when the radiation varies for a given temperature. It is noted that the power varies in proportion to the radiation.
4.2.2. Performance thermal of system PV/T
shows the changes in overall energy efficiency, thermal efficiency, and electrical efficiency as a function of mass flow variation. These yields increase from 43% to 96% and from 8% to 59%, respectively, as the mass flow increases. For against, the electrical efficiency has a slight change from the variation of the mass flow.
Figure 12. Evolution of thermal, electrical and overall efficiency, as a function of mass flow.
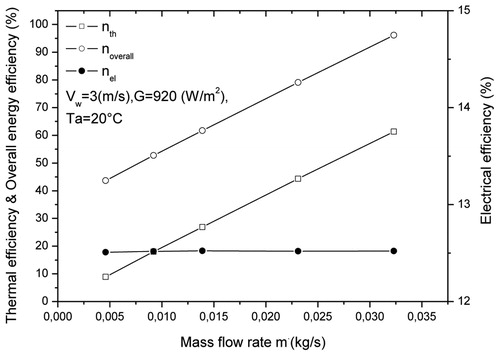
It should be noted that overall thermal efficiency behaves in the same way as thermal efficiency. The latter increases with increasing mass flow. As mass flow increases, heat extraction increases with reduced heat loss at the sides of the collector, resulting in increased thermal efficiency.
We can note that for all the cases studied, the thermal efficiency undergoes significant variations for a flow rate that varies between (low cooling) and
(high cooling) and reaches its maximum (about 58%) for the value of 0.03230 kg/s.
The system’s overall energy efficiency varies according to the relationship (Fan et al. Citation2017)
(46)
(46) where
(47)
(47)
(48)
(48) where Cf is the thermal conversion factor
This efficiency gives very high values with the highest flow rates (96% for a mass flow rate of 0.0323 kg/s). So, the more the flow rate increases, the more the overall efficiency increases. 51% of combined energy is saved for electrical and thermal energy. This increase corresponds to a flow rate increase from 0.0046 to 0.0323 kg/s. This means that the increase in mass flow promotes thermal transfer between the photovoltaic module and the heat transfer fluid.
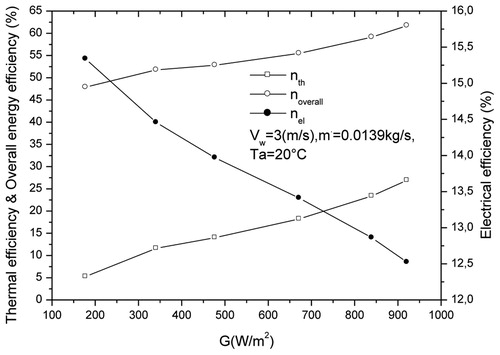
and show the effect of solar radiation intensity on the overall energy efficiency, thermal efficiency and electrical efficiency. According to this figures, it is observed that the overall energy efficiency and thermal efficiency increase with the increase of solar radiation, On the other hand, the electrical efficiency decreases with respect to solar radiation variations. Both figures show that solar radiation has obvious importance on the overall efficiency of the PV/T collector (electrical efficiency + thermal efficiency), but it is related to both mass flow and wind speed.
Figure 13. Evolution efficiencies as a function of time.
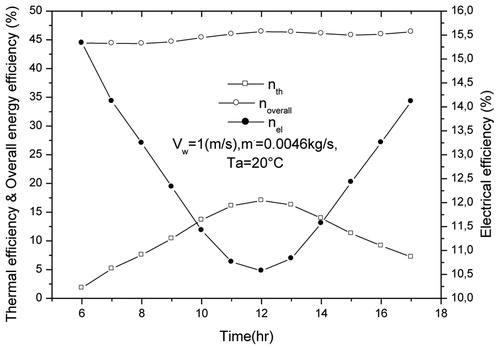
Figure 14. Evolution of thermal efficiency as a function of solar radiation.
When the solar radiation varies from 100 to 920 W/m², the global and thermal efficiency increases (∼2–15%), while the electrical efficiency decreases by 5%, around 12h00 as shown in . (Vw = 1 m / s and ).
This result is improved by the increase in mass flow and wind speed (Vw = 3 m/s and ), where the overall and thermal efficiency is increased (∼15 at 20%) with the increase as shown in .
We can observe that there is proportionality between the electrical efficiency of the hybrid PV/T system and the mass flow, which is logical because, with the increase of the mass flow, the rate of heat extraction increases, so the power electric increases which leads to increased electrical efficiency. The electrical efficiency increases up to 12.58% from 12.00 for a mass flow is equal to 0.0323 kg/s. This increase makes it possible to optimise the electrical efficiency of 4% obtained with a mass flow rate of 0.0046 kg/s.
The increase of the wind speed increases the overall heat loss coefficient, so that the temperature of the solar cells decreases. As a result, overall energy efficiency decreases less than thermal efficiency.
This is illustrated in , which illustrates the evolution of overall energy efficiency, thermal efficiency, and electrical efficiency as a function of changes in wind speed.
Figure 15. Evolution of thermal efficiency in wind speed.
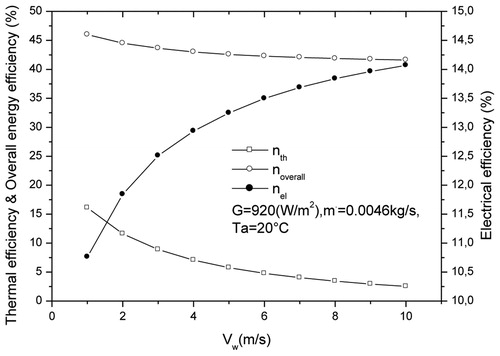
When electric efficiency increases from 10.75% to 14.1% with increasing wind speed, overall energy efficiency and thermal efficiency decrease from 46.5% to 42.5% and from 16.25% to 3% when the wind speed increases to 10 m/s.
We can observe that there is a proportionality between the electrical efficiency of the hybrid PV/T system and the wind speed, which is logical, because with the increase of the wind speed, the elimination of the heat increases as well as electric power, which leads to an increase in electrical efficiency.
The electrical efficiency increases up to 14.1% from 12h00 for a low mass flow equal to 0.0046 kg/s, this increase makes it possible to optimise the electrical efficiency of 3.6% compared to a wind speed equal to 1 m/s.
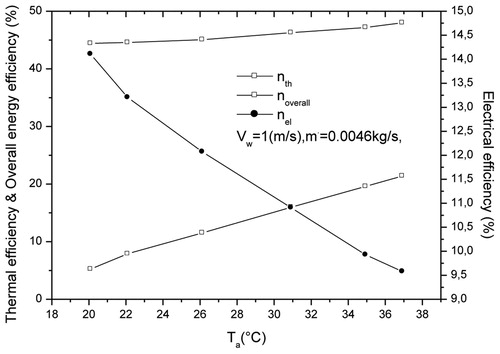
The evolution of overall energy efficiency, thermal efficiency and electrical efficiency with respect to the ambient temperature are illustrated in . Increasing the ambient temperature from 20°C to 37°C. results in a significant reduction in the electrical efficiency of 14% to 9.5%.
Figure 16. Evolution of thermal efficiency as a function of ambient temperature.
The results developed in this study are compared with previous results (Sarhaddi et al. Citation2010) with the same variations in mass flow rate presented in .
Table 4. The efficiencies of PV/T system for Tamb = 300 K, Vw = 1 m/s and G = 700 w/m2.
These results show the importance of this work for the obtained values of thermal, electrical and overall efficiency.
4.3. Sensitivity analysis
Sensitivity analysis is a methodology initially developed for optimisation methods, to identify the uncertainties in any assessment that aims to characterise a system’s response through variations in its output parameters following changes imposed on the system’s input parameters. It is used for optimal design studies to understand the relationships and study the impact on the specific parameters of any numerical analysis.
For the PV/T air collector, the sensitivity to the optimum value of the duct depth (Dopt) was investigated, together with the sensitivity rate of useful thermal energy output flow rate Qu, for different values of mass flow rate (), the results are shown in .
Figure 17. Sensitivity analysis of the rate of thermal energy output of the PV/T air system for different channel depth.
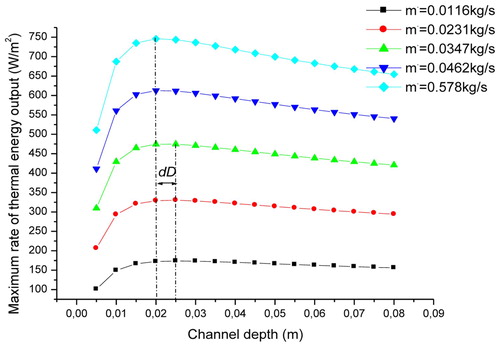
It can be seen that for fixed values of (), the depth of channel (D) increases from its minimum value and the rate of thermal energy production gradually increases until it reaches a peak.
The uncertainty () decreases as the mass flow rate increases and the optimal depth can generally be written on the following formula:
(49)
(49) With
for
4.4. Economic analysis
This part analyses the cost of an air PV/T system compared to the two solar module, photovoltaic and thermal. The cost of the air PV/T collector, consisting of a PV module and a rear insulating plate, the structural costs of the three PV, Solar thermal (ST) and PV/T collectors are calculated in .
Table 5. Cost of the system components.
The following economic analysis has been developed for solar systems considered using electricity and natural gas prices in Tunisia. The price of electricity and natural gas varies from 0.078 US $/kWh to 0.112 US $/kWh, while the price of gas varies from 0.089 US $/kWh to 0.120 US $/kWh (STEG: Tunisian company of electricity and gas, 2020), the equations used to study the economic analysis are (Gagliano et al. Citation2019):
The annual money savings, Ry, as well as their discounted sum:
(50)
(50) R (revenues):
(51)
(51) where
(52)
(52) Eth is the energy-saving, provided by the solar systems, r is the funding rate which has been set at 3%, and n is the life cycle assumed to be 20 years.
As illustrated in , an economic study has been carried out comparing the three solar panels PV, ST and PVT.
Figure 18. Costs and revenues.
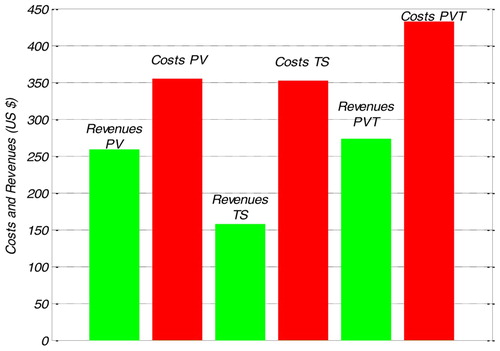
shows that cost is higher than revenues in all cases, and this is due to the high cost of solar system and the price of electricity in Tunisia. According to this analysis, both the cost of solar installation and electricity price are two factors that mainly affect the yield. Nevertheless, it should be pointed out that PV/T installations give the highest yields.
5. Conclusion
In this work, a parametric study of a PV/T solar collector in order to analyse the various parameters that influence its functioning has been presented.
The results developed in this paper show that this type of collector does indeed have interesting characteristics, particularly in terms of its overall performance, with much higher efficiency than that of a standard photovoltaic module or that of a conventional air-only solar collector.
The thermal efficiency reaches 58% for a mass flow rate 0.0323 kg/s and ambient wind speed 3 m/s while the electrical efficiency reaches 12.6%.
The electrical efficiency is improved (14%) for high ambient wind speeds (10 m/s) and ambient temperature around 20°C.
This study also has the significant advantage of saving space compared to separate systems and we can say that hybrid collectors are true cogeneration systems, thus allowing the simultaneous production of electrical energy and heat energy. They can be integrated into various applications such as industrial drying or space heating.
In future work, optimising the performance of PV/T air collector can be studied by different manner, such as: modification of the geometry of the PV/T air collector by adding fins or PCM nodules, application of numerical optimisation techniques based on artificial intelligence and application of advanced control techniques.
Disclosure statement
No potential conflict of interest was reported by the author(s).
References
- Armstrong, S., and W. G. Hurley. 2010. “A Thermal Model for Photovoltaic Panels Under Varying Atmospheric Conditions.” Applied Thermal Engineering 30: 1488–1495. doi: https://doi.org/10.1016/j.applthermaleng.2010.03.012
- Assoa, Y. B., F. Sauzedde, B. Boillot, and S. Boddaert. 2017. “Development of a Building Integrated Solar Photovoltaic/Thermal Hybrid Drying System.” Energy 128: 755–767. doi: https://doi.org/10.1016/j.energy.2017.04.062
- Babu, C., and P. Ponnambalam. 2017. “The Role of Thermoelectric Generators in the Hybrid PV/T Systems: A Review.” Energy Conversion and Management 151: 368–385. doi: https://doi.org/10.1016/j.enconman.2017.08.060
- Bhubaneswari, P., S. Iniyan, and G. Ranko. 2011. “A Review of Solar Photovoltaic Technologies.” Renewable and Sustainable Energy Reviews 15: 1625–1636. doi: https://doi.org/10.1016/j.rser.2010.11.032
- Chin, V. J., Z. Salam, and K. Ishaque. 2015. “Cell Modelling and Model Parameters Estimation Techniques for Photovoltaic Simulator Application: A Review.” Applied Energy 154: 500–519. doi: https://doi.org/10.1016/j.apenergy.2015.05.035
- Choi, H., Y. Kim, C. Son, J. Yoon, and K. Choi. 2020. “Experimental Study on the Performance of Heat Pump Water Heating System Coupled with Air Type PV/T Collector.” Applied Thermal Engineering 178: 115427. doi: https://doi.org/10.1016/j.applthermaleng.2020.115427
- Chouder, A., S. Silvestre, N. Sadaoui, and L. Rahmani. 2012. “Modeling and Simulation of a Grid Connected PV System Based on the Evaluation of Main PV Module Parameters.” Simulation Modelling Practice and Theory 20: 46–58. doi: https://doi.org/10.1016/j.simpat.2011.08.011
- Coventry, J. S. 2005. “Performance of a Concentrating Photovoltaic/Thermal Solar Collector.” Solar Energy 78: 211–222. doi: https://doi.org/10.1016/j.solener.2004.03.014
- Fan, W., G. Kokogiannakis, Z. Ma, and P. Cooper. 2017. “Development of a Dynamic Model for a Hybrid Photovoltaic Thermal Collector – Solar Air Heater with Fins.” Renewable Energy 101: 816–834. doi: https://doi.org/10.1016/j.renene.2016.09.039
- Farshchimonfared, M., J. I. Bilbao, and A. B. Sproul. 2016. “Full Optimisation and Sensitivity Analysis of a Photovoltaic–Thermal (PV/T) air System Linked to a Typical Residential Building.” Solar Energy 136: 15–22. doi: https://doi.org/10.1016/j.solener.2016.06.048
- Gagliano, A., G. M. Tina, S. Aneli, and S. Nižetić. 2019. “Comparative Assessments of the Performances of PV/T and Conventional Solar Plants.” Journal of Cleaner Production 219: 304–315. doi: https://doi.org/10.1016/j.jclepro.2019.02.038
- Hegazy, A. A. 2000. “Comparative Study of the Performances of Four Photovoltaic/Thermal Solar Air Collectors.” Energy Conversion and Management 41: 861–881. doi: https://doi.org/10.1016/S0196-8904(99)00136-3
- Karimi, F., H. Xu, Z. Wang, J. Chen, and M. Yang. 2017. “Experimental Study of a Concentrated PV/T System Using Linear Fresnel Lens.” Energy 123: 402–412. doi: https://doi.org/10.1016/j.energy.2017.02.028
- Khelifa, A., K. Touafek, H. Ben Moussa, and I. Tabet. 2016. “Modeling and Detailed Study of Hybrid Photovoltaic Thermal (PV/T) Solar Collector.” Solar Energy 135: 169–176. doi: https://doi.org/10.1016/j.solener.2016.05.048
- Michael, J. J., S. Iniyan, and R. Goic. 2015. “Flat Plate Solar Photovoltaic–Thermal (PV/T) Systems: A Reference Guide.” Renewable and Sustainable Energy Reviews 51: 62–88. doi: https://doi.org/10.1016/j.rser.2015.06.022
- Mojumder, J. C., W. T. Chong, H. C. Ong, K. Y. Leong, and A. Al-Mamoon. 2016. “An Experimental Investigation on Performance Analysis of Air Type Photovoltaic Thermal Collector System Integrated with Cooling Fins Design.” Energy and Buildings 130: 272–285. doi: https://doi.org/10.1016/j.enbuild.2016.08.040
- Mojumder, J. C., H. C. Ong, W. T. Chong, and N. Izadyar. 2017. “The Intelligent Forecasting of the Performances in PV/T Collectors Based on Soft Computing Method.” Renewable and Sustainable Energy Reviews 72: 1366–1378. doi: https://doi.org/10.1016/j.rser.2016.11.225
- Mortezapour, H., B. Ghobadian, M. H. Khoshtaghaza, and S. Minaei. 2012. “Performance Analysis of a Two-way Hybrid Photovoltaic/Thermal Solar Collector.” J. Agr. Sci. Tech 14: 767–780.
- Najafi, H., B. Najafi and P. Hoseinpoori. 2011. “Energy and Cost Optimization of a Plate and Fin Heat Exchanger Using Genetic Algorithm.” Applied Thermal Engineering 31: 1839–1847. doi: https://doi.org/10.1016/j.applthermaleng.2011.02.031
- Ni, J., J. Li, W. An, T. Zhu, and Tong Zhu. 2018. “Performance Analysis of Nanofluid-Based Spectral Splitting PV/T System in Combined Heating and Power Application.” Applied Thermal Engineering 129: 1160–1170. doi: https://doi.org/10.1016/j.applthermaleng.2017.10.119
- Rejeb, O., H. Dhaou, and A. Jemni. 2015. “A Numerical Investigation of a Photovoltaic Thermal (PV/T) Collector.” Renewable Energy 77: 43–50. doi: https://doi.org/10.1016/j.renene.2014.12.012
- Salas, V., E. Olıas, A. Barrado, and A. Lazaro. 2006. “Review of the Maximum Power Point Tracking Algorithms for Stand-alone Photovoltaic Systems.” Solar Energy Materials and Solar Cells 90: 1555–1578. doi: https://doi.org/10.1016/j.solmat.2005.10.023
- Sarhaddi, F., S. Farahat, H. Ajam, and A. Behzadmehr. 2010. “Exergetic Performance Assessment of a Solar Photovoltaic Thermal (PV/T) Air Collector.” Energy and Buildings 42: 2184–2199. doi: https://doi.org/10.1016/j.enbuild.2010.07.011
- Sarhaddi, F., S. Farahat, H. Ajam, A. Behzadmehr, and M. Mahdavi Adeli. 2010. “An Improved Thermal and Electrical Model for a Solar Photovoltaic Thermal (PV/T) Air Collector.” Applied Energy 87: 2328–2339. doi: https://doi.org/10.1016/j.apenergy.2010.01.001
- Shan, F., L. Cao, and G. Y. Fang. 2013. “Dynamic Performances Modeling of a Photovoltaic–Thermal Collector with Water Heating in Buildings.” Energy and Buildings 66: 485–494. doi: https://doi.org/10.1016/j.enbuild.2013.07.067
- Slimani, M. E., M. Amirat, I. Kurucz, S. Bahria, A. Hamidat, and W. B. Chaouch. 2017. “A Detailed Thermal-Electrical Model of Three Photovoltaic/Thermal (PV/T) Hybrid Air Collectors and Photovoltaic (PV) Module: Comparative Study under Algiers Climatic Conditions.” Energy Conversion and Management 133: 458–476. doi: https://doi.org/10.1016/j.enconman.2016.10.066
- Touafek, K., M. Haddadi, and A. Malek. 2013. “Design and Modeling of a Photovoltaic Thermal Collector for Domestic Air Heating and Electricity Production.” Energy and Buildings 59: 21–28. doi: https://doi.org/10.1016/j.enbuild.2012.10.037
- Yang, X., L. Sun, Y. Yuan, X. Zhao, and X. Cao. 2018. “Experimental Investigation on Performance Comparison of PV/T-PCM System and PV/T System.” Renewable Energy 119: 152–159. doi: https://doi.org/10.1016/j.renene.2017.11.094
- Yazdanifard, F., and M. Ameri. 2018. “Exergetic Advancement of Photovoltaic/Thermal Systems (PV/T): A Review.” Renewable and Sustainable Energy Reviews 97: 529–553. doi: https://doi.org/10.1016/j.rser.2018.08.053