
ABSTRACT
The residential sector is responsible for a large portion of global energy consumption, with the primary needs consisting of space heating. Therefore, consumers’ decisions concerning the heating system selection play a significant role in shaping the sector's conditions. This study examines the relationship between residential heating systems’ selection-related motivation factors and socioeconomic, residence, and spatial characteristics. A questionnaire survey focusing on the Greek population was performed during 2012 and 2019, with the two samples being examined in parallel. The motivation factors were classified into convenience, market, performance, and cost-related aspects, with performance-related and cost-related aspects being perceived as the most important. Convenience-related aspects are more important for older people and women, while performance-related aspects for individuals with environmentally friendlier behaviour.
1. Introduction
Energy consumption is split between the industrial, transport, residential, and commercial sectors. On a global scale, the residential sector represents about 25% of total energy consumption, corresponding to 17% of CO2 emissions (IEA Citation2016). The respective percentage on an EU level is approximately 26% (Eurostat Citation2020), whereas Greece is around 27% (Eurostat Citation2021a). Moreover, IEA (Citation2019) estimates a 65% increase in energy consumption in the building sector (including residential and commercial structures) globally between 2018 and 2050 due to rising income, urbanisation, and increased electricity access. Based on Eurostat-derived data, residential energy consumption in the EU is based mainly on natural gas (32%) and electricity (25%), followed by renewable energy sources (RES) (19.5%), petroleum products (11.5%), derived heat (8.5%) and coal products (3.5%) (Eurostat Citation2020). The respective data for Greece indicates that energy consumption is based primarily on electricity (36.5%), renewables and wastes (25%), oil (28%), and gas (9.5%) (Eurostat Citation2021b). On an EU level, space heating is accountable for consuming large amounts of energy in the residential sector (63.5%); water heating (15%), lighting and appliances (14%), and cooking (6%) are the uses that follow (Eurostat Citation2020). This is also the case for the Greek residential sector, with heating (56%) being the activity that consumes the largest share of energy, followed by lighting and appliances (19%), water heating (13%), cooking (6%) and cooling (5%) (Eurostat Citation2021c).
Following the above, it is indicated that the residential sector is accountable for a significant part of energy consumption worldwide, with the primary need involving space heating. Selecting a heating system that satisfies all requirements can be a difficult task (Martinopoulos, Papakostas, and Papadopoulos Citation2018). Therefore, it is crucial to understand the determinants of consumers’ decisions concerning the selection of residential heating systems to have a deeper insight into the space heating market. The potential relations between different motivation factors associated with the systems’ selection process (see ) and particular socioeconomic, residence, and spatial characteristics should be highlighted in this context, in combination with alterations that may occur over time. Such identified relations can support policy and market interventions targeting consumers with common characteristics.
Table 1. Factors affecting the selection of residential heating systems.
The existing research performed so far consists of studies that examine the effect that either (a) socioeconomic, residence, and/or spatial characteristics (e.g. Braun Citation2010; Laureti and Secondi Citation2012; Zorić and Hrovatin Citation2012), or (b) a combination of the aforementioned characteristics and motivation factors (e.g. Aravena, Riquelme, and Denny Citation2016; Decker and Menrad Citation2015; Hecher et al. Citation2017; Lillemo and Halvorsen Citation2013; Mahapatra and Gustavsson Citation2010; Michelsen and Madlener Citation2016; Ruokamo Citation2016; Sopha et al. Citation2010; Su et al. Citation2019) can have on the determinants of the residential heating systems’ selection process.
However, when going a step further and taking into consideration the relations between the motivation factors and the socioeconomic, residence, and spatial characteristics affecting the selection process, it is indicated that minimal research has been performed. To be precise, and to the best of the author's knowledge, the only identified research which has investigated to some extent this topic has been performed by Michelsen and Madlener (Citation2013), where the researchers observed the relation of six developed motivation componentsFootnote1 with a limited number of particular socioeconomic (monthly household income) and residence (dwelling type and size, number of families residing) characteristics. Hence, the relations between individual motivation factors and socioeconomic, residence, and spatial characteristics have never been previously examined, while the exploration of relations between specific motivation components and the abovementioned characteristics is limited to only one study (i.e. Michelsen and Madlener Citation2013), which takes into consideration a limited number of characteristics (i.e. monthly household income, dwelling type and size, and number of families residing). Moreover, when taking into account the time factor, i.e. examining the relations mentioned above in the course of time, it should be noted that no relevant research has been performed.
Having the above in mind, the present research is driven by the following questions: Which relationships occur between individual motivation factors related to the selection of residential heating systems and different socioeconomic, residence and spatial characteristics? Which relations are identified between developed motivation components and a wide range of socioeconomic, residence, and spatial characteristics? How do these relations change over time?
Hence, the present study aims to make a significant empirical contribution towards a better understanding of the interrelations between the factors determining the selection of residential heating systems. A deeper comprehension of the relations between the motivation factors and the socioeconomic, residence, and spatial characteristics can also significantly improve the design of heating system-targeted policy tools by the corresponding public authorities, and marketing strategies by the relevant manufacturers and suppliers. Furthermore, the results of this particular study, focusing on Greek homeowners, can be extended to other countries, at least on a qualitative level.
In this context, Section 2 addresses the theoretical background on the factors that affect the selection process of residential heating systems. Section 3 deals with the study's material and methods, including the survey design, the survey's realisation, and the data's processing and analysis. Section 4 puts forward the results deriving from the various statistical analysis methods applied. Section 5 offers a discussion on the presented results, as well as the limitations of the study. Finally, Section 6 presents the conclusion of the research, along with the relevant policy implications.
2. Theoretical background: factors affecting residential heating systems’ selection
The initial researches examining factors influencing residential heating systems’ selection used U.S. Census data to investigate the impact of socioeconomic and demographic characteristics, along with elements like installation and operation cost, on the selection procedure (Dubin Citation1986; Dubin and McFadden Citation1984; Fernandez Citation2001; Scodari and Hardie Citation1985). Since the year 2000, the volume of related research has risen considerably; such studies concentrate primarily on RES-based heating systems and investigate the impact of socioeconomic, demographic, residence, and spatial attributes and users’ behaviour, preferences, and attitudes for particular heating systems qualities. In this respect, Germany, Denmark, the Netherlands, Sweden, Finland, and the U.K. are the most studied nations (Karytsas and Theodoropoulou Citation2014a). summarises the statistically essential variables that have been found to influence the selection of residential heating systems, according to Karytsas and Theodoropoulou's (2014a) literature assessment. In this sense, the work performed by Michelsen and Madlener (Citation2013) should be pointed out; based on a 2010 German sample, the researchers, by applying a Principal Component Analysis, categorised 25 selection motivation factors into six dimensions, namely (i) cost aspects, (ii) general attitude towards the heating system, (iii) government grant, (iv) reactions to external threats, (v) comfort considerations, and (vi) influence of peers.
In the interest of constructing a theoretical foundation and describing the framework within residential consumers make their decisions about residential heating systems, the majority of the researches investigating factors related to behaviour and preferences (Bjørnstad Citation2012; Mahapatra and Gustavsson Citation2008; Michelsen and Madlener Citation2013; Nyrud, Roos, and Sande Citation2008; Sopha and Klöckner Citation2011; Su et al. Citation2019; Tapaninen, Seppänen, and Makinen Citation2009) base their work on innovation and technology diffusion, as well as on consumer behaviour theories. From this point of view, there are two prevalent theories: the Diffusion of Innovations Model developed by Rogers (Citation2005) states that ‘relative advantage, compatibility, complexity, trialability, and observability’ are the factors affecting the diffusion of innovative technology positively; the Theory of Planned Behavior deals with the connection between beliefs and behaviour and proposes that the behavioural intentions and behaviours of an individual are formed based on attitude toward behaviour, subjective norms, and perceived behavioural control (Ajzen Citation1991). Moreover, several other theories have been applied to describe the residential heating system selection process, among which the Technology Acceptance Model (Davis, Bagozzi, and Warshaw Citation1989), Perceived Characteristics of Innovations (Moore and Benbasat Citation1991), Consumer Perceived Value (Eggert and Ulaga Citation2002) and the Comprehensive Action Determination Model (Klöckner and Blöbaum Citation2010).
Only a handful of studies can be identified when referring to examining factors affecting the selection of heating systems focusing on Greek households. It is worth pointing out that all these studies consider alternative heating systems, i.e. renewable energy technologies and microgeneration systems. Sardianou and Genoudi (Citation2013) performed the first relevant work, which dealt with the determinants of renewable energy technologies adoption willingness, without, however, making a distinction between electricity and thermal production systems. Specific socioeconomic characteristics (age, education, and income) and policy-related measures were identified significantly to affect consumers’ perceptions. Two different studies (Karytsas Citation2018; Karytsas and Theodoropoulou Citation2014a) were centred around the factors influencing the adoption intention of ground source heat pump systems (GSHP), with statistically significant factors including socioeconomic and residence characteristics, as well as residents’ preferences on particular system-related attributes. Following, an international study (Greece, Portugal, and Spain) addressed the socioeconomic, residence, and location-related drivers behind the willingness to adopt and to pay for a hybrid system (GSHP, solar thermal panels, and thermal energy storage) providing heating/cooling and domestic hot water (Karytsas, Polyzou, and Karytsas Citation2019). Likewise, a more recent study investigated the market acceptance factors of microgeneration technologies, including GSHPs and biomass boilers; statistically significant factors comprised of gender, age, income, residence type, ownership and size, environmental behaviour, available subsidy programme, and perceptions on cost and market-related topics (Karytsas, Vardopoulos, and Theodoropoulou Citation2019).
3. Materials and methods
3.1. Design of the survey
As a means to perform the survey, an online questionnaire was designed, comprising on questions on:
Demographic/socioeconomic characteristics: gender, age, marital status, education level, profession, annual family income, place of residence;
dwelling characteristics: size and type of the residence, property ownership, year of construction, number and type of the occupants;
environmental awareness and behaviour: 15 binary (yes/no) questions, used to construct an environmental awareness and an environmental behaviour scale;
perceptions on motivation factors related to heating systems’ selection: a set of 18 questions represented on a five-degree Likert scale;
actual and theoretical decisions on installing residential heating systems; the results of this set of questions are not presented in the present study.
The questionnaire was distributed during two different periods, 2012 and 2019. It was distributed during two different periods to collect two different samples that can be examined in parallel, rather than directly comparing the results of the two samples, to identify the common results between them. It should be noted that only slight modifications were made to the recent (2019) version. In both cases, pilot surveys were performed, targeting a small sample of respondents. The suggestions made within the trial survey led to minor modifications of the questionnaire; after that, the final edition was circulated.
3.2. Realisation of the survey
The survey's target group was Greece's general population, with the only restriction being age >18 years. The survey focused on individual residents rather than on households, as residents of the same household may have different perceptions on the heating system selection motivation factors.
In both time phases, the questionnaire was distributed through specific mailing lists, one acquired from the Harokopio University of Athens (HUA) and the other from the Center of Renewable Sources and Saving (CRES). Nonetheless, it should be emphasised that the two mailing lists’ receivers were different in terms of the two different periods. Concerning the first time phase, the questionnaire was circulated in four steps between June and July 2012; respectively, for the second time phase, the four steps were conducted between January and February 2019. It should be noted that an ethical approval of the survey (being a non-interventional study) was not required.
3.3. Process and analysis of the data
The data collected during both time phases were reviewed. All responses that included missing data or did not match the target audience criteria were removed from the final database. Thus, the final database comprised 410 and 451 responses for 2012 and 2019, respectively.
The SPSS 20 software was applied for the statistical analysis of the data. First of all, descriptive statistics analysis was performed; the results are presented in Section 4.1. The next step involved identifying statistically significant relations between the perceptions on the motivation factors related to heating systems’ selection and socioeconomic, residential, and spatial characteristics. In this context, Spearman's rank correlation coefficients and Mann–Whitney U tests were applied, with the results being presented in Sections 4.2.1 and 4.2.2 accordingly. The third step comprised the performance of a Categorical Principal Component Analysis (CatPCA) on the selection motivation factors to classify these factors and further utilise the results; the applied methodology and the corresponding results are available in Section 4.3. The final step was to detect relations between the components derived from the CatPCA mentioned above and the socioeconomic, residential, and spatial characteristics; Spearman's rank correlation coefficients (Section 4.4.1) and independent samples t-tests (Section 4.4.2) were applied in this context.
4. Results
4.1. Descriptive statistics
The 2012 and the 2019 samples’ socioeconomic characteristics are presented in , presenting gender, age, marital status, education level, type of occupation, and annual family income. Additionally, two individual indexes concerning environmental awareness and environmental behaviour are provided. Each index's values were individually calculated by summing up each respondent's answers to environmental-related questions; the environmental awareness index is counted on a 0–5 scale, while the environmental behaviour index on a 0–10 scale.
Table 2. Socioeconomic characteristics.
The respondents’ profile shows that most of the respondents are women; in both samples, women represent around 57% of the surveyed individuals. In the case of 2012, the average age is 33 years, while for 2019 it is seven years higher, i.e. 40 years; having in mind that the two samples were collected with a 7-year time difference, we could say that it turns out to be the same generation of people. The vast majority of the respondents are at least university educated, with the respective percentages exceeding 80% in both samples. In both instances, the type of occupation with the highest share is private or public employees (although indicating a 13 percentage point difference between the two samples), followed by the self-employed. Referring to annual family income, in both cases, the majority (approx. 55%) of the surveyed citizens has an income of up to 18,000 €. The average value is around 1 unit higher (around 3.5) than the scale's mean value for the two samples regarding the environmental awareness scale. As for the environmental behaviour scale, there is a slight difference between the two cases. The average values for the 2012 and 2019 samples are 6.3 and 5.7, respectively; in any case, both samples have an average score over the scale's mean value.
Likewise, offers information on the residence and spatial characteristics, in terms of year of construction, type and size of housing and property ownership; location densityFootnote2; the number of residents; the existence of minors or elderly. The great majority of the respondents of the two samples live in privately-owned apartments built, in general, about 30–35 years ago (i.e. around 1987–88) with two housemates on average, with the minority of them being minors (a 17 percentage points difference between the two samples should be indicated) or elderly. The average population density in both cases corresponds to urban municipalities’ density.
Table 3. Residence and spatial characteristics.
presents respondents’ perceptions of the different motivation factors related to heating systems’ selection. For both cases, the factors evaluated as most significant (‘Much’ and ‘Very much’ answers) are (a) system lifetime, (b) functional reliability, and (c) secure equipment, installation & operation; in addition, ‘operation & maintenance cost’ is among the four highest-rated factors for the 2012 sample, while having ‘relative advantages over other systems’ completes the list of the top four highest-ranked factors for the 2019 sample. On the contrary, the factor that seems to affect less the respondents on their residential heating system selection is ‘increase of house market value,’ followed by ‘widespread technology’ and ‘ease of installation.’ Furthermore, presents the weighted average (2012 and 2019 samples) of the percentages referring to the ‘Much’ and ‘Very much’ answers for each factor. It is indicated that when examining together the two samples (through the weighted average), system lifetime is perceived as the most critical factor (90%). At the same time, the increase of house market value is the least important one (34%).
Figure 1. The weighted average (2012 and 2019 samples) of the percentages referring to ‘Much’ and ‘Very much’ answers for each factor (% values).
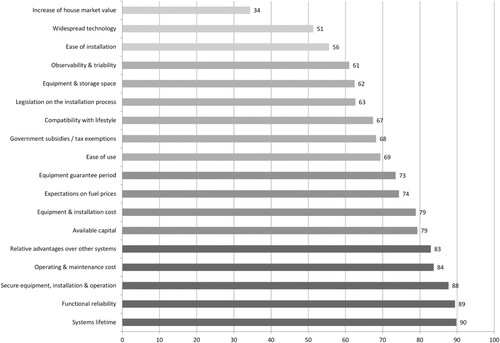
Table 4. Perceived importance of motivation factors related to heating systems’ selection.
4.2. Identifying relations between selection motivation factors and socioeconomic, residential, and spatial characteristics
4.2.1. Spearman's rank correlation coefficients
Spearman's rank correlation coefficient was used to examine potential statistically significant associations between the motivation factors related to the selection of heating systems (being ordinal variables) and the socioeconomic, residence, and spatial characteristics expressed as continuous or ordinal variables, i.e. age, education level, annual family income, environmental awareness scale, environmental behaviour scale, year of construction, size of residence, number of residents and location density. Spearman's rank correlation coefficient is a nonparametric rank statistic that measures the strength of a relation between two variables; it can be used for variables measured at the continuous or ordinal level (Hauke and Kossowski Citation2011).
As presented in , age is positively correlated with several factors, either for both samples or only -mainly- for the 2019 one. Hence, when referring to both cases (2012 and 2019), statistically significant positive associations are identified between age and ‘ease of installation,’ ‘ease of use,’ ‘equipment & storage space,’ ‘compatibility with lifestyle’ and ‘widespread technology’; when referring only to the 2019 sample, positive correlations are detected with ‘equipment & installation cost,’ ‘operating & maintenance cost,’ ‘equipment guarantee period,’ ‘observability & triability’ and ‘legislation on the installation process.’ It should be noted that only in one case a negative association was detected; this had to do with the 2012 sample and concerned the correlation between age and ‘increase of house market value.’
Table 5. Spearman's rank correlation coefficients: Relations between the selection motivation factors and the socioeconomic and residence characteristics.
A small number of statistically significant correlations were also detected when referring to education level. This variable is positively associated with ‘ease of installation,’ ‘equipment and storage space’ and ‘secure equipment, installation & operation’ (2012 sample), while negatively associated with ‘expectations on fuel prices’ (2019 sample).
Annual family income correlates negatively with the factors under investigation, referring to the 2012 case. Specifically, higher levels of annual family incomes are associated with lower levels of perceived importance concerning ‘equipment & installation cost,’ ‘increase of house market value,’ ‘equipment guarantee period,’ ‘government subsidies/tax exemptions,’ and ‘expectations on fuel prices.’
Higher levels of environmental awareness are associated with higher levels of perceived importance of the factors under investigation, especially for the 2019 sample. In this context, environmental awareness is positively correlated with ‘functional reliability’ (for both 2012 and 2019 samples), ‘equipment guarantee period,’ ‘relative advantages over other systems,’ ‘widespread technology,’ and ‘legislation on the installation process’ (2019 sample). On the contrary, environmental awareness was negatively associated with ‘ease of use’ when referring to the 2012 case.
Furthermore, positive correlations were detected between environmental behaviour and several factors either for both 2012 and 2019 samples (‘functional reliability,’ ‘system's lifetime,’ ‘secure equipment, installation & operation,’ ‘relative advantages over other systems’ and ‘legislation on the installation process)’ or only for the 2019 sample (‘widespread technology,’ ‘observability & triability’ and ‘expectations on fuel prices)’. A negative association was indicated only for the 2012 sample, concerning the ‘equipment & installation cost’ factor.
Only a small number of statistically significant correlations were identified when referring to the residence and spatial characteristics. In particular, the year of construction was negatively associated with the ‘system's lifetime’ (2019 sample). The same association was detected between the size of residence and ‘equipment & installation cost’ and ‘increase of house market value’ (2012 sample). In contrast, a higher number of household residents is associated with lower perceived importance of the ‘operating & maintenance’ factor (2012 sample). Finally, location density is positively correlated with ‘increase of house market value’ (2012 and 2019 sample) and ‘equipment & installation cost’ (2012 sample), while negatively correlated with ‘equipment guarantee period’ (2019 sample).
4.2.2. Mann–Whitney U tests
Mann–Whitney U tests were applied in the interest of examining the existence of statistically significant differences in the heating systems’ selection motivation factors (being ordinal variables) between the groups of the recorded binary nominal variables expressing socioeconomic and residence characteristics, i.e. gender, marital status, type of housing, property ownership, and minors/ elderly residing in the household. The Mann-Whitney U test was selected for the specific analysis, as it examines the differences between two groups on a single, ordinal variable with no specific distribution (Mann and Whitney Citation1947).
As indicated in , when referring to gender, women evaluate more than men the importance of specific factors: ‘ease of installation,’ ‘ease of use,’ ‘equipment and storage space,’ and ‘compatibility with lifestyle’ for both the 2012 and the 2019 samples; ‘secure equipment, installation and operation’ and ‘relative advantages over other systems’ only for the 2019 case.
Table 6. Mann-Whitney U tests results: Differences between the groups of the binary nominal variables on the selection motivation factors.
The next socioeconomic characteristic has to do with marital status: compared to not married individuals, married respondents identify as less critical the ‘increase of house market value’ (2012 sample) and the ‘available capital’ (2019 sample) factors; oppositely, those married perceive ‘compatibility with lifestyle,’ ‘secure equipment, installation & operation,’ ‘relative advantages over other systems’ (2012 sample) and ‘widespread technology’ (both samples) as more significant, in relation to the respondents not being married.
For both samples (2012 and 2019), respondents residing in an apartment building perceive an ‘increase of house market value’ as a more critical factor than the respondents who live in a detached house. A similar result can be mentioned in the type of housing context when referring to the ‘equipment and storage space’ factor; however, this result is statistically significant only for the 2019 sample. On the other hand, individuals from the 2019 sample living in detached houses find the ‘functional reliability’ factor more important than apartments’ residents.
Moving on, when referring to ownership of property, the following statistically significant results can be reported: concerning the 2012 sample, people that rent their residence value higher the ‘increase of house market value’ and the ‘system's lifetime’ factors, compared to those living in their property; on the contrary, homeowners find more important ‘widespread technology’ (2012 sample) and ‘ease of installation’ (2019 sample), in relation to renters’ responses.
Only two statistically significant relations were identified when taking into account the type of the household's residents: respondents that live with minors find less critical the ‘equipment and installation cost’ factor, compared to those residing in houses with no children present (2012 sample); at the same time, people staying together with elderly value more the ‘ease of use’ factor, in relation to those living without the presence of the elderly (2019 sample).
4.3. Categorical Principal Component Analysis for perceptions on the motivation factors related to heating systems’ selection
Categorical Principal Component Analysis (CatPCA) was used to categorise the motivation factors related to heating systems’ selection. This type of analysis was selected as the non-linear analogous of PCA (Manisera, van der Kooij, and Dusseldorp Citation2010) since the examined variables were ordinal. The two samples (2012 and 2019) were analysed separately, thus producing a discrete factors' classification for each case. The methodology applied for the execution of the CatPCA is described in detail by Karytsas and Choropanitis (Citation2017) regarding sample suitability, variable fitness, total components included in the model, appropriate rotation method, and interpretation of results.
As a first step, it is essential to examine if the size of the sample is appropriate. According to the empirical rule, a 5:1 observation to variable ratio is required (Costello and Osborne Citation2005); have in mind that the initial number of the study's variables should be considered, rather than only those included in the produced model (Tabachnick and Fidell Citation2007). The present study includes two distinct samples, n2012 = 410 and n2019 = 451, with the original variables being 18. This results in a ratio of 23:1 and 25:1 respectively for the 2012 and 2019 samples, with both being significantly higher than the rule of thumb. In SPSS, the Kaiser-Meyer-Olkin (KMO) Measure of Sampling Adequacy can be applied to check the sample size; the sample size can be considered as adequate when KMO >0.50 (Kaiser Citation1974; Yong and Pearce Citation2013). For the 2012 sample, the corresponding value is .849 (), while for the 2019 sample, it is .866 ().
Table 7. 2012 sample: Classification of selection motivation factors.
Table 8. 2019 sample: Classification of selection motivation factors.
Next, the existence of correlation and multicollinearity between the variables should be investigated. To check for correlation, Bartlett's test of sphericity is utilised with values <0.05 (Field Citation2009) being accepted. Multicollinearity is tested by the correlation matrix's determinant, with a lack of multicollinearity being suggested by values >.00001 (Field Citation2009; Yong and Pearce Citation2013). The Anti-Correlation matrix's diagonal elements are examined, with values greater than .50 (Field Citation2009; Koostra Citation2004; Yong and Pearce Citation2013), confirming the sample's suitability. Indeed, after removing from the two models the variables causing multicollinearity issues, it was revealed that patterned relationships between the variables were present, no multicollinearity issues occurred ( and ), while the samples were appropriate (as the minimum values for the diagonal elements were .654 and .777 for the 2012 and the 2019 sample respectively).
To decide on the number of components included in the two final models, specific conditions are considered (Karytsas and Choropanitis Citation2017): (i) Kaiser Criterion, (ii) variance percentage described by the selected components, (iii) communalities’ values, (iv) the number of variables comprising each component, and (v) the interpretability of the components. Additionally, the cut-off point was set to .40 (Hair et al. Citation1998); the cut-off point, which is essential for the results’ interpretation, is understood as the absolute value below which each component's load factors are not accepted.
The Promax oblique method was selected as the most suitable rotation method in terms of reaching ‘simple structure’ (Thurstone Citation1947), i.e. improving the results’ explication by clarifying the data structure (Bryant and Yarnold Citation1995; Yaremko et al. Citation1986). In social science fields, relationships are expected between components, as it is not common for behaviour-based variables to operate independently. This means that oblique rotation methods provide more valid results (Costello and Osborne Citation2005; Field Citation2009; Matsunaga Citation2010), as, in contrast to orthogonal rotation methods, they assume correlation (Brown Citation2009; Costello and Osborne Citation2005). Practically, the factor transformation matrix is used to test if the selected rotation method is appropriate. Specifically, when an orthogonal rotation method generates data positioned outside the diagonal of the matrix that is not nearly symmetric, an oblique rotation method should be used instead. Hence, the Promax oblique method was applied, as this was the case for both models (2012 and 2019 sample) of the present analysis.
The performed analysis shows that in both cases (2012 and 2019 samples), the motivation factors can be classified into four components: Convenience-related aspects, Performance-related aspects, Market-related-aspects, and Cost-related aspects ( and ). The percentage of variance that each component represents is presented in the last row of and , respectively (Brown Citation2009). It should be noted that although the factors were grouped within the same components in the two models, the percentages that these components represent are different between the two cases; for example, ‘Convenience-related aspects’ explains 33% of the variance in the 2012 model, while 11% of the variance in the 2019 model. Each variable has a value >|.45| in only one component, thus supporting ‘simple structure’ (Thurstone Citation1947); the only exception is ‘operating and maintenance cost’ in the 2012 model, having a value >.54 in two different components. Further on, communality values (h2) are provided in the last column of and , respectively. Communality values indicate the percentage of variation explained by the four components for each variable (Brown Citation2009). For example, in the 2012 model, 62% of the variance of ‘Ease of installation’ is explained by the four components, while the four components explain 64% of the variance of the same factor in the 2019 model. It should be pointed out that, concerning social sciences fields, communality values typically range between .40 and .70, as it is challenging to reach values >.80 when it comes to real data (Tabachnick and Fidell Citation2007). Additionally, it is worth mentioning that the value found at the intersection of the last row and the last column indicates the total percentage of variation described by the model. Thus, the four components explain 59.44% and 63.99% of data variability for the 2012 and the 2019 samples, respectively. An adequate limit is set between 60% and 70% (Beaumont Citation2012).
4.4. Identifying relations between constructed components and socioeconomic, residential, and spatial characteristics
4.4.1. Spearman's rank correlation coefficients
Similar to Section 4.2.1, Spearman's rank correlation coefficient was applied to check for relations between the produced components (continuous variables) and the socioeconomic, residence, and spatial characteristics (continuous or ordinal variables), namely age, education level, annual family income, environmental awareness and environmental behaviour scales, year of construction, size of residence, number of residents and location density.
As provided in , age is positively related to ‘convenience-related aspects’ (both 2012 and 2019 samples), ‘market-related aspects’ and ‘performance-related aspects’ (2019 sample). Only one statistically significant association was identified with respect to educational level, namely a positive correlation with the ‘convenience-related aspects’ when referring to the 2012 sample. Moreover, annual family income was found to be negatively correlated with two components, specifically ‘market-related aspects’ and ‘cost-related aspects’ (2019 sample). Higher levels of environmental awareness and behaviour are related to a higher perception of specific components. Environmental awareness is positively related to ‘market-related aspects’ and ‘performance-related aspects’ (2019 sample), while environmental behaviour with ‘performance-related aspects’ (both 2012 and 2019 samples), ‘market-related aspects’ and ‘cost-related aspects’ (2019 sample).
Table 9. Spearman's rank correlation coefficients: Relations between the constructed components, and the socioeconomic and residence characteristics.
Only a few statistically significant results are identified concerning associations between the components and the residence and spatial characteristics. A negative relation is indicated between the size of residence and ‘cost-related aspects’ (2012 sample), while, when referring to the location density variable, a positive association is identified with the ‘convenience-related aspects’ component (2012 sample) and a negative association with the ‘market-related aspects’ (2019 sample).
4.4.2. Independent samples t-tests
Independent samples t-tests were used to examine the existence of differences in the constructed components (being continuous variables) between the groups of the socioeconomic and residence characteristics coded in binary nominal variables, namely gender, marital status, type of housing, property ownership, and minors/ elderly residing in the household.
As presents, in terms of gender, women evaluate more than men the importance of ‘convenience-related aspects’ regarding both the 2012 and 2019 samples. Also, it is indicated that married respondents perceive ‘convenience-related’ and ‘performance-related’ aspects as more important compared to those not married (2012 sample). On the contrary, respondents that are not married identify ‘cost-related aspects’ as more significant when compared to the individuals that have been married (2012 sample). Little statistically significant evidence exists concerning the residence-related variables. Specifically, the only statistically significant result indicates that in the case of the 2019 sample, households that include senior residents value ‘convenience-related aspects’ more than those with no elder individuals present in the household.
Table 10. Independent samples t-tests: Differences between the groups of the binary nominal variables on the constructed components.
5. Discussion
In both the 2012 and 2019 samples, the motivation factors related to heating systems’ selection were classified into four components: convenience, market, performance, and cost-related aspects. This classification has some similarities with the work performed by Michelsen and Madlener (Citation2013), with the ‘cost’ and ‘comfort’ aspects being commonly identified, having of course in mind that the sets of motivation factors used in the two pieces of research differed. Further on, an agreement was identified in both time phases regarding the most significant motivation factors within a heating system's selection process. These factors are (a) system lifetime, (b) functional reliability, and (c) secure equipment, installation & operation, with all three identified as performance-related aspects. This means that it could be proposed that above all, consumers value most the performance of a heating system, followed by any cost, comfort, and market issues, a finding that differs from previous statements, according to which energy cost is the leading factor when referring to heating system selection (Martinopoulos, Papakostas, and Papadopoulos Citation2016).
Referring to the performance-related aspects, it should be noted that a positive relation is identified between them and environmental behaviour in both time phases, meaning that consumers showing a friendlier behaviour towards the environment perceive performance-related aspects as more critical. This positive relation is also apparent when examining individually the factors comprising this component; in both the 2012 and 2019 samples, a positive relation is identified between environmentally friendly behaviour and functional reliability, system lifetime and secure equipment, installation & operation. In the light of these findings, the importance of creating and culturing an overall environmental friendly behaviour is highlighted, in terms of leading consumers to value factors related to the performance of a system (reliability, lifespan, security) more than issues related to costs (e.g. installation and operation), comfort (e.g. ease of installation, compatibility with lifestyle), and market conditions (e.g. available subsidies and grants, relevant legislation). Moreover, in this setting, a positive connection between performance-related aspects and consumers’ environmental awareness has been identified regarding the 2019 sample; on the individual factor level, this relation is present between functional reliability and equipment guarantee period and environmental awareness. In this context, the importance of activities that can enhance an overall environmentally friendly behaviour should be highlighted, including environmental awareness activities and training throughout a person's academic and professional life.
Performance-related aspects, convenience-related and cost-related aspects correlate with marital status in the 2012 sample. In particular, a positive relation is identified between married individuals and convenience (especially with the ‘compatibility with lifestyle’ factor) and performance aspects (specifically with the ‘secure equipment, installation & operation’ factor). In contrast, a negative relation is reported between married and cost-related aspects. From this point of view, it should be noted that when examining the relation of marital status with each individual motivation factor for both the 2012 and 2019 samples, it is evident that married people foresee as more important all convenience, performance, and market (except for ‘observability & triability)’ related factors, along with the ‘relative advantages over other systems’ and ‘widespread technology’ factors which have not been categorised in any of the CatPCA components. On the other hand, individuals that are not married value more the cost-related factors and the ‘increase of house market value’ factor, which is not classified in any of the CatPCA components. This is a first indication that family men/women, perhaps of older age and higher income, rate convenience and performance higher than any installation and operation costs. This means that perhaps they would be willing to oversee any higher costs in exchange for their family's comfort.
Following this line of thought, the positive relation between convenience-related aspects and age should be highlighted. In both the 2012 and 2019 cases, it is evident that older individuals value more all convenience-related factors (ease of installation, ease of use, equipment & storage space, and compatibility with lifestyle). This connection is also supported by the fact that a positive correlation is identified between convenience-related aspects and households in which older people (>65 years old) reside (at least for the 2019 sample). Thus, as stated in the previous paragraph, older people seem to value their comfort over any cost-related aspects. Besides, when referring specifically to the 2019 case, it is shown that age is also positively connected to the market and performance-related aspects. These are findings that agree with a previous study, according to which households with members >65 years old impact microgeneration technologies’ adoption (Willis et al. Citation2011).
Convenience-related issues are also associated with gender, with women -compared to men- perceiving all relevant factors (ease of installation, ease of use, equipment & storage space, and compatibility with lifestyle) as more important within the heating selection process. This indicates that companies focusing on promoting heating systems should focus on aspects related to comfort-related aspects to approach women involved within the system's selection process.
Furthermore, when examining the characteristics connected to cost-related aspects, a negative association is identified between them and annual family income and residence size (for the 2012 case). This means that house owners with a higher income or a larger house do not value cost-related aspects so much, and specifically, the heating system's installation cost. This indicates the importance of the heating system's installation cost and the policy measures that could reduce it for the low-income classes. These results could be compared with Michelsen and Madlener’s (Citation2013) findings, according to which monthly income and home size are related to specific motivation factor components.
Within the research, connections between the motivation factors and residence and spatial characteristics were also examined. However, only a few statistically significant relations were identified in this case, relevant to more practical issues, such as the positive connection between apartment houses and ‘equipment & storage space’ (i.e. apartment residents find more critical the issue of equipment & storage space; 2019 sample), property ownership and ‘ease of installation’ (homeowners evaluate the ease of installation as more important, compared to renters; 2019 sample), and location density and ‘convenience related aspects’ (residents of highly populated areas value more issues related to their convenience, compared to residents of areas with a lower population density; 2012 sample). These results indicate the need to develop compact (referring to equipment and fuel storage space) heating systems that can be easily installed in existing buildings or new constructions.
5.1. Study limitations
Possibly, the most significant limitation of the present research has to do with the fact that the two collected samples are not representative of the Greek population, taking into account that the surveys were performed entirely through an online questionnaire. In such a case, it should be pointed out that online surveys could perhaps lead to a sample that is not as representative as one created through a telephone or personal interview (Berrens et al. Citation2003; Malhotra and Krosnick Citation2007), thus making it hard to extrapolate the results to offline populations (Andrews, Nonnecke, and Preece Citation2003). Specifically, and considering the 2011 Greek National Census (Hellenic Statistical Authority Citation2011), it becomes clear that the highly-educated and middle-aged are overrepresented in the two samples. Nonetheless, even though the samples do not illustrate the distribution of the Greek population's demographic characteristics ideally, they can provide a sound basis for the examination of the factors taken into consideration within this study (Berrens et al. Citation2003; Karytsas and Theodoropoulou Citation2014b), always having in mind that attention should be given in the case of the generalisation of the present results.
Further on, it should be noted that small differences occur between the questionnaires distributed during the two different periods; specifically, minor modifications were made to the 2019 questionnaire, including slight amendments in wording and adjustments made based on the respective market changes over time. Also, the two questionnaires include some alterations in terms of the questions that form the environmental awareness and environmental behaviour scales, with their overall number and content being somewhat different.
Additionally, as presented in Section 2, more than 50 motivation factors have been identified, being related to the process of residential heating system selection (). However, as a result of time and cost constraints, it was impossible to study all these identified factors within the present research. Thus, a selection was made, and only 18 of them were included in the present study, meaning that some motivation factors were not investigated in this empirical study. Nevertheless, the examination of these factors could be a topic for future research.
In any case, and regardless of these deficiencies, this work can provide a comprehensive basis concerning the relations between the determinants of the residential heating systems’ selection.
6. Conclusion
The present study aimed to examine the relationship between motivation factors related to selecting residential heating systems and different (a) socioeconomic, (b) residence, and (c) spatial characteristics. To do so, an online questionnaire survey focusing on the Greek population was performed during two different time phases, 2012 and 2019, in the context of creating two different samples that are examined in parallel to identify the results being common between them. The first sample comprised 410 responses, while the second one 451.
Based on the statistical analysis performed, it is indicated that the motivation factors connected to the selection of residential heating systems can be classified into four components: (a) convenience-related aspects, (b) market-related aspects, (c) performance-related aspects, and (d) cost-related aspects. In this context, consumers perceive as most important the performance-related aspects (i.e. system lifetime, functional reliability, secure equipment, installation & operation), followed by the cost-related aspects (operating & maintenance cost, available capital, equipment, and installation cost). On the contrary, selecting a specific heating system to increase the house market value is considered the least essential motivation factor.
When referring to the relations between the motivation factors and socioeconomic, residence and spatial characteristics, it has been identified that (a) older people – compared to the younger ones- and women – compared to men- value issues related to comfort as more important within the heating selection process, and (b) individuals with a friendlier environmental behaviour value performance-related issues as more important, compared to those with a lower-scale environmental behaviour.
The present work makes a significant empirical contribution towards a better understanding of the motivation factors affecting the selection of heating systems at the individual homeowner level. A more detailed understanding of the fundamental motivations behind the selection of residential heating systems can help design policy instruments and marketing strategies targeting heating systems with particular attributes (e.g. convenience, performance, and cost). Also, findings from this specific research focusing on Greek homeowners can be applied to other countries, at least on a qualitative level.
Acknowledgments
The author would like to thank Dr. Ioannis Vardopoulos (HUA) for his contribution to the conduction of the 2019 survey and Professor Eleni Theodoropoulou (HUA) for her valuable suggestions, comments, and guidance during both the 2012 and 2019 pieces of research.
Disclosure statement
No potential conflict of interest was reported by the author(s).
Notes
1 Each component comprising of factors relevant to each other.
2 Location density calculated based on municipality surface (Hellenic Statistical Authority Citation2001) and 2011 Census population (Government Gazette Citation3465 B' Citation2012)
References
- Ajzen, I. 1991. “The Theory of Planned Behavior.” Organizational Behavior and Human Decision Processes 50 (2): 179–211.
- Andrews, D., B. Nonnecke, and J. Preece. 2003. “Electronic Survey Methodology: A Case Study in Reaching Hard-to-Involve Internet Users.” International Journal of Human-Computer Interaction 16 (2): 185–210.
- Aravena, C., A. Riquelme, and E. Denny. 2016. “Money, Comfort or Environment? Priorities and Determinants of Energy Efficiency Investments in Irish Households.” Journal of Consumer Policy 39 (2): 159–186.
- Beaumont, R. 2012. “An Introduction to Principal Component Analysis and Factor Analysis Using SPSS 19 and R (Psych Package).” Factor Analysis. Principal Component Analysis (PCA) 24: 8–9.
- Berrens, R. P., A. K. Bohara, H. Jenkins-Smith, C. Silva, and D. L. Weimer. 2003. “The Advent of Internet Surveys for Political Research: A Comparison of Telephone and Internet Samples.” Political Analysis 11 (1): 1–22.
- Bjørnstad, E. 2012. “Diffusion of Renewable Heating Technologies in Households. Experiences from the Norwegian Household Subsidy Programme.” Energy Policy 48: 148–158.
- Braun, F. G. 2010. “Determinants of Households’ Space Heating Type: A Discrete Choice Analysis for German Households.” Energy Policy 38 (10): 5493–5503.
- Brown, J. D. 2009. “Choosing the Right Number of Components or Factors in PCA and EFA. Shiken JALT Test.” Eval. SIG Newsl 13: 20–25.
- Bryant, F. B., and P. R. Yarnold. 1995. “Principal Components Analysis and Confirmatory Factor Analysis.” In Reading and Understanding Multivariate Statistics, edited by L. G. Grimm, and P. R. Yarnold, 99–136. Washington, DC: American Psychological Association.
- Costello, A. B., and J. W. Osborne. 2005. “Best Practices in Exploratory Factor Analysis: Four Recommendations for Getting the Most from Your Analysis.” Practical Assessment, Research and Evaluation 10: 1–9.
- Davis, F. D., R. P. Bagozzi, and P. R. Warshaw. 1989. “User Acceptance of Computer Technology: A Comparison of Two Theoretical Models.” Management Science 35 (8): 982–1003.
- Decker, T., and K. Menrad. 2015. “House Owners’ Perceptions and Factors Influencing Their Choice of Specific Heating Systems in Germany.” Energy Policy 85: 150–161.
- Dubin, J. A. 1986. “A Nested Logit Model of Space and Water Heat System Choice.” Marketing Science 5 (2): 112–124.
- Dubin, J. A., and D. L. McFadden. 1984. “An Econometric Analysis of Residential Electric Appliance Holdings and Consumption.” Econometrica 52 (2): 345–362.
- Eggert, A., and W. Ulaga. 2002. “Customer Perceived Value: A Substitute for Satisfaction in Business Markets?” Journal of Business & Industrial Marketing 17 (2/3): 107–118.
- Eurostat. 2020. Energy Consumption and Use by Households. Accessed June 2021. https://ec.europa.eu/eurostat/web/products-eurostat-news/-/ddn-20200626-1.
- Eurostat. 2021a. Final Energy Consumption by Sector. Accessed June 2021. https://ec.europa.eu/eurostat/databrowser/view/ten00124/default/table?lang=en.
- Eurostat. 2021b. Final Energy Consumption in Households by Fuel. Accessed June 2021. https://ec.europa.eu/eurostat/databrowser/view/t2020_rk210/default/table?lang=en.
- Eurostat. 2021c. Energy Consumption in Households by Type of End-Use. Accessed June 2021. https://ec.europa.eu/eurostat/statistics-explained/index.php?title=Energy_consumption_in_households#Energy_consumption_in_households_by_type_of_end-use.
- Fernandez, V. P. 2001. “Observable and Unobservable Determinants of Replacement of Home Appliances.” Energy Economics 23 (3): 305–323.
- Field, A. 2009. Discovering Statistics Using SPSS: Introducing Statistical Method. 3rd ed. Thousand Oaks, CA: Sage Publications.
- Government Gazette 3465 B’. 2012. Results of the 2011 Population – Housing Census Concerning the Permanent Population of the Country. Decision 11247.
- Hair, J. F., W. C. Black, B. J. Babin, R. E. Anderson, and R. L. Tatham. 1998. Multivariate Data Analysis. Upper Saddle River, NJ: Prentice Hall.
- Hauke, J., and T. Kossowski. 2011. “Comparison of Values of Pearson’s and Spearman’s Correlation Coefficients on the Same Sets of Data.” QUAGEO 30 (2): 87–93.
- Hecher, M., S. Hatzl, C. Knoeri, and A. Posch. 2017. “The Trigger Matters: The Decision-Making Process for Heating Systems in the Residential Building Sector.” Energy Policy 102: 288–306.
- Hellenic Statistical Authority. 2001. Population Census of the 18th March 2001: Permanent Population, Surface and Population Density, Grouped by Urban and Rural Areas, As Well As Lowland, Semi-mountainous and Mountainous Areas. Table 3: Greece and Geographical Districts.
- Hellenic Statistical Authority. 2011. Census, Hellenic Population-Housing; Hellenic Statistical Authority. Greece: Piraeus.
- IEA. 2016. Statistics Report. Paris, France: International Energy Agency, OECD/IEA.
- IEA. 2019. EIA Projects Nearly 50% Increase in World Energy Usage by 2050, Led by Growth in Asia. Accessed June 2021. https://www.eia.gov/todayinenergy/detail.php?id=41433.
- Kaiser, H. F. 1974. “An Index of Factorial Simplicity.” Psychometrika 39: 31–36.
- Karytsas, S. 2018. “An Empirical Analysis on Awareness and Intention Adoption of Residential Ground Source Heat Pump Systems in Greece.” Energy Policy 123: 167–179.
- Karytsas, S., and I. Choropanitis. 2017. “Barriers Against and Actions Towards Renewable Energy Technologies Diffusion: A Principal Component Analysis for Residential Ground Source Heat Pump (GSHP) Systems.” Renewable and Sustainable Energy Reviews 78: 252–271.
- Karytsas, S., O. Polyzou, and C. Karytsas. 2019. “Factors Affecting Willingness to Adopt and Willingness to Pay for a Residential Hybrid System that Provides Heating/Cooling and Domestic Hot Water.” Renewable Energy 142: 591–603.
- Karytsas, S., and H. Theodoropoulou. 2014a. “Public Awareness and Willingness to Adopt Ground Source Heat Pumps for Domestic Heating and Cooling.” Renewable and Sustainable Energy Reviews 34: 49–57.
- Karytsas, S., and H. Theodoropoulou. 2014b. “Socioeconomic and Demographic Factors that Influence Publics’ Awareness on the Different Forms of Renewable Energy Sources.” Renewable Energy 71: 480–485.
- Karytsas, S., I. Vardopoulos, and E. Theodoropoulou. 2019. “Factors Affecting Sustainable Market Acceptance of Residential Microgeneration Technologies. A Two Time Period Comparative Analysis.” Energies 12 (17): 3298.
- Klöckner, C. A., and A. Blöbaum. 2010. “A Comprehensive Action Determination Model: Toward a Broader Understanding of Ecological Behaviour Using the Example of Travel Mode Choice.” Journal of Environmental Psychology 30 (4): 574–586.
- Koostra, G. J. 2004. Exploratory Factor Analysis: Theory and Application. Groningen, The Netherlands: University of Groningen Press.
- Laureti, T., and L. Secondi. 2012. “Determinants of Households’ Space Heating Type and Expenditures in Italy.” International Journal of Environmental Research 6 (4): 1025–1038.
- Lillemo, S. C., and B. Halvorsen. 2013. “The Impact of Lifestyle and Attitudes on Residential Firewood Demand in Norway.” Biomass and Bioenergy 57: 13–21.
- Mahapatra, K., and L. Gustavsson. 2008. “An Adopter-Centric Approach to Analyze the Diffusion Patterns of Innovative Residential Heating Systems in Sweden.” Energy Policy 36: 577–590.
- Mahapatra, K., and L. Gustavsson. 2010. “Adoption of Innovative Heating Systems—Needs and Attitudes of Swedish Homeowners.” Energy Efficiency 3 (1): 1–18.
- Malhotra, N., and J. A. Krosnick. 2007. “The Effect of Survey Mode and Sampling on Inferences about Political Attitudes and Behavior: Comparing the 2000 and 2004 ANES to Internet Surveys with Nonprobability Samples.” Political Analysis 15 (3): 286–323.
- Manisera, M., A. J. van der Kooij, and E. Dusseldorp. 2010. “Identifying the Component Structure of Satisfaction Scales by Nonlinear Principal Components Analysis.” Quality Technology & Quantitative Management 7 (2): 97–115.
- Mann, H. B., and D. R. Whitney. 1947. “On a Test of Whether One of Two Random Variables Is Stochastically Larger Than the Other.” The Annals of Mathematical Statistics, 18 (1): 50–60.
- Martinopoulos, G., K. T. Papakostas, and A. M. Papadopoulos. 2016. “Comparative Analysis of Various Heating Systems for Residential Buildings in Mediterranean Climate.” Energy and Buildings 124: 79–87.
- Martinopoulos, G., K. T. Papakostas, and A. M. Papadopoulos. 2018. “A Comparative Review of Heating Systems in EU Countries, Based on Efficiency and Fuel Cost.” Renewable and Sustainable Energy Reviews 90: 687–699.
- Matsunaga, M. 2010. “How to Factor-Analyze Your Data Right: Do’s, Don’ts, and How-to’s.” International Journal of Psychological Research 3 (1): 97–110.
- Michelsen, C., and R. Madlener. 2013. “Motivational Factors Influencing the Homeowners’ Decisions Between Residential Heating Systems: An Empirical Analysis for Germany.” Energy Policy 57: 221–233.
- Michelsen, C. C., and R. Madlener. 2016. “Switching from Fossil Fuel to Renewables in Residential Heating Systems: An Empirical Study of Homeowners’ Decisions in Germany.” Energy Policy 89: 95–105.
- Moore, G. C., and I. Benbasat. 1991. “Development of an Instrument to Measure the Perceptions of Adopting an Information Technology Innovation.” Information Systems Research 2 (3): 192–222.
- Nyrud, A. Q., A. Roos, and J. B. Sande. 2008. “Residential Bioenergy Heating: A Study of Consumer Perceptions of Improved Woodstoves.” Energy Policy 36 (8): 3169–3176.
- Rogers, E. M. 2005. Diffusion of Innovations. New York: Free Press.
- Ruokamo, E. 2016. “Household Preferences of Hybrid Home Heating Systems – A Choice Experiment Application.” Energy Policy 95: 224–237.
- Sardianou, E., and P. Genoudi. 2013. “Which Factors Affect the Willingness of Consumers to Adopt Renewable Energies?” Renewable Energy 57: 1–4.
- Scodari, P. F., and I. W. Hardie. 1985. “Heating Costs and Household Wood Stove Acquisition: A Discrete Choice Demand Model.” Northeastern Journal of Agricultural and Resource Economics 14 (1): 65–70.
- Sopha, B. M., and C. A. Klöckner. 2011. “Psychological Factors in the Diffusion of Sustainable Technology: A Study of Norwegian Households’ Adoption of Wood Pellet Heating.” Renewable and Sustainable Energy Reviews 15 (6): 2756–2765.
- Sopha, B. M., C. A. Klöckner, G. Skjevrak, and E. G. Hertwich. 2010. “Norwegian Households’ Perception of Wood Pellet Stove Compared to Air-to-Air Heat Pump and Electric Heating.” Energy Policy 38 (7): 3744–3754.
- Su, D., W. Zhou, Y. Gu, and B. Wu. 2019. “Individual Motivations Underlying the Adoption of Cleaner Residential Heating Technologies: Evidence from Nanjing, China.” Journal of Cleaner Production 224: 142–150.
- Tabachnick, B. G., and L. S. Fidell. 2007. Using Multivariate Statistics. 5th ed. Upper Saddle River, NJ: Pearson Allyn & Bacon.
- Tapaninen, A., M. Seppänen, and S. Makinen. 2009. “Characteristics of Innovation in Adopting a Renewable Residential Energy System.” Journal of Systems and Information Technology 11 (4): 347–366.
- Thurstone, L. L. 1947. Multiple-factor Analysis: A Development and Expansion of the Vectors of Mind. Chicago, IL: University of Chicago Press.
- Willis, K., R. Scarpa, R. Gilroy, and N. Hamza. 2011. “Renewable Energy Adoption in an Ageing Population: Heterogeneity in Preferences for Micro-Generation Technology Adoption.” Energy Policy 39 (10): 6021–6029.
- Yaremko, R. M., H. Harari, R. C. Harrison, and E. Lynn. 1986. Handbook of Research and Quantitative Methods in Psychology: For Students and Professionals. Hillsdale, NJ: Lawrence Erlbaum Associates.
- Yong, A. G., and S. Pearce. 2013. “A Beginner’s Guide to Factor Analysis: Focusing on Exploratory Factor Analysis.” Tutorials in Quantitative Methods for Psychology 9: 79–94.
- Zorić, J., and N. Hrovatin. 2012. “Determinants of Residential Heating Preferences in Slovenia.” International Journal of Sustainable Economy 4 (2): 181–196.