
 ?Mathematical formulae have been encoded as MathML and are displayed in this HTML version using MathJax in order to improve their display. Uncheck the box to turn MathJax off. This feature requires Javascript. Click on a formula to zoom.
ABSTRACT
Energy security is sensitive to the behavioural characteristics of resource trade, especially for the US as the world’s largest energy-consuming economy. This paper applies the Markov switching model and dynamic network connectedness measures of Diebold-Yilmaz to explore the impact of the North American shale gas technology on behavioural regimes and spillover effects of natural gas trade cycles, regarding the US’ energy security. The findings indicate asymmetric and time-varying behaviour of the US’ energy security pre- and post-the revolution. Specifically, it seems that overall interaction between substitution- and scale effect of the shale gas revolution through the gravity theory develops the US’ energy security as shocks occur in the energy-trading process. Therefore, the alternating analysis of behavioural regimes and spillover effects, through potential and actual trade links in world natural gas trade networks, is essential to develop availability, affordability, accessibility as well as acceptability dimensions of energy security.
Introduction
The concept of energy security covers a wide range of aspects (Yergin Citation2006), from classic definition, i.e. reliable and affordable flow of oil supply (Yergin Citation1988; Colglazier and Deese Citation1983) to contemporary dimensions e.g. accessibility and environmental acceptability (Goldthau Citation2011). As a comprehensive definition, energy security refers to immediate physical availability, price affordability, transportation and transmission accessibility as well as environmental, political, and social acceptability dimensions of energy resources in the economies (Sutrisno, Nomaler, and Alkemade Citation2021; APERC Citation2007).Footnote1
Particularly, in terms of immediate physical availability, the energy source is available if it is abundant enough to go on an important recoverable resource, while the economic dimension of energy security is explained by the affordability of energy resource acquisition. The accessibility dimension of energy security refers to transportation and transmission barriers, e.g. geopolitical factors, long-term sales contracts and massive infrastructure investments among others. From the aspect of environmental acceptability, the energy security reflexes the economy’s success to switch from a carbon intensive- to non-carbon-based fuel portfolio, to lower potential environmental degradation.
The role of energy security on resource- and non-resource sectors, capital formation, technology improvements and economic growth of the energy-exporting countries is inevitable, since they are vulnerable to the external market shocks (Nepal and Paija Citation2019; Griffiths Citation2017; Bilgili et al. Citation2016). On the other hand, as the economy is dependent on the imported-primary energy sources to cover its primary energy demand, there is a limited possibility to meet its energy consumption through domestic supply sources, which leads to a higher risk of the country’s energy supply security.
Hence, both energy importing- and exporting countries require to adopt dynamic energy trade strategies and policies and, therefore, support their energy securities (Sutrisno, Nomaler, and Alkemade Citation2021; Chalvatzis and Ioannidis Citation2017; Vivoda Citation2014; Cohen, Joutz, and Loungani Citation2011). Even for the United States (the US’) with world’s lowest energy security risk score, highest rank of such economy among 25 large energy-consuming countries makes it necessary to monitor the regional and global energy trade structures to remain less vulnerable in response to the market shocks of energy resources (the US’ chamber of commerce, Citation2020).
Natural gas, as a form of clean energy, has become an important energy resource in light of energy supply security (Liu et al. Citation2020). The global natural gas trade has experienced continuous growth rate higher than natural gas demand, contributing to incremental energy supply security. The US’ natural gas production, particularly from geological or tight oil formations (primarily deep shales), is increased through the combination of hydraulic fracturing and horizontal drilling technologies that is called ‘Shale Technology’. The exploitation of shale gas reserves is hardly recognised commercial outside of the North America (Auping et al. Citation2016). The US and other countries with technically recoverable shale gas resources are different through the institutional characteristics, especially regarding the large-scale extraction process of shale gas reserves (Tian et al. Citation2014; Kuuskraa, Stevens, and Moodhe Citation2013).
From the aspect of outcomes, the benefits of the shale gas technology for the economy are classified into explicit market impacts, e.g. raise in consumer surplus due to lower gas prices, increase in producer surplus and local as well as regional economic benefits, and implicit effects including air quality standards and climate change improvements as a result of emissions reductionsFootnote2. Especially, the shale gas technology declines natural gas production cost by reducing the
separation costs through potential economic and technical infrastructure, which leads to lower natural gas prices. Furthermore, the intermediate technology of shale gas revolution mitigates the short-term environmental concerns of the US’ economy since the price reduction of natural gas may decrease
emissions (Acemoglu et al. Citation2019). Accordingly, the North-American shale gas technology is recognised as a potential affecting factor to analyse the short-term and long-term behavioural characteristics of the US’ energy environment.
It is noted that, energy trade decisions of individual economies have resulted in regional and global energy trade networks (Sutrisno, Nomaler, and Alkemade Citation2021; Shirazi et al. Citation2019) since the shale gas technology has not transferred across the globe (Melikoglu Citation2014). As excess global energy demand is increased, larger volumes of energy trade and more energy network connectedness are needed to raise energy security (Zhong et al. Citation2017; Kern and Rogge Citation2016; Cherp, Jewell, and Goldthau Citation2011; Csereklyei and Stern Citation2015; Institute for 21st Century Energy Citation2015). Also, the structure and performance of natural gas trade flows (sum of export and import) have been developed through energy trade systems, which needs paying attention to various factors determining the energy security level, including energy strategies (An et al. Citation2014). Moreover, the energy security is sensitive to energy trade shocks, e.g. import- and export shocks and non-trade shocks regarding energy reserves, geopolitics, including foreign policies and transport disruptions (Zhong et al. Citation2014), production capacities (Guan et al. Citation2016) as well as production disruptions and price shocks (Shepard and Pratson Citation2020). Consequently, and based on the existing dynamic substitution of natural gas in resource- and non-resource sectors (Serletis, Timilsina, and Vasetsky Citation2011; Renou-Maissant Citation1999), the rule of comparative advantage and high degree of specialisation of the economies (Antweiler, Copeland, and Taylor Citation2001; Hummels, Ishii, and Yi Citation2001), natural gas shows a considerable impact on global energy trade strategies (Ji, Zhang, and Fan Citation2014), economic- growth and development as well as military- and political strategies (Wu and Chen Citation2019).
We aim to address that the North American shale gas revolution is expected to be as a considerable affecting factor to determine the behavioural characteristics of natural gas import and export by country of the US’ economy that would lead to energy security developments, e.g. more natural gas availability, price affordability, accessibility and acceptability, through the higher expected volumes of natural gas trade flows and hence help to turn the US’ economy into a natural gas net exporter and develop the US’ energy security.
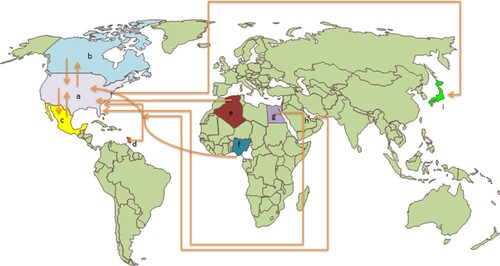
Based on EIAFootnote3 monthly energy review (2021) and throughout the US’ natural gas trade network, the major export destinations of the US’ natural gas are Canada, Japan and Mexico and, therefore, the rest of the destinations are denoted as ‘other countries’. Also, the main import sources of the US’ natural gas import are classified as Algeria, Canada, Egypt, Mexico, Nigeria, Qatar and Trinidad and Tobago and hence, ‘other countries’ for the rest of import sources. In the following, the map of the US’ natural gas trade by country is presented in .
Figure 1. Map of the US’ natural gas trade by country, based on EIA monthly energy review (2021): (a) the US, (b) Canada, (c) Mexico, (d) Trinidad & Tobago, (e) Algeria, (f) Nigeria, (g) Egypt, (h) Qatar, (i) Japan.
The first classification of recent studies, regarding availability and accessibility dimensions of energy security, focuses on the impact of energy sources’ regional and international trade networks on energy security (Tuchinda et al. Citation2021; Peng et al. Citation2021; Shirazi et al. Citation2020; Shepard and Pratson Citation2020; Sutrisno, Nomaler, and Alkemade Citation2021; Rodríguez-Fernandez, Belen Fernandez Carvajal, and Manuel Ruiz-Gomez Citation2020; Dong et al. Citation2020; Shirazi et al. Citation2019; Maltby Citation2013 among others) and concludes that energy security significantly depends on reliable trade relationships throughout global trade networks of both renewables and non-renewables.
The second group of articles surveys determining the risks around energy security, e.g. energy supply, environment, technology, geopolitical and economic factors, of individual economies and regions (Hasanov et al. Citation2020; Karatayev and Hall Citation2020; Augutis et al. Citation2020; Lin and Yousaf Raza Citation2020; San-Akca, Sever, and Yilmaz Citation2020; Balbás Egea and Eguren Egiguren Citation2019; Zeng, Streimikiene, and Balezentis Citation2017; Cherp and Jewell Citation2014) and finds that energy resource diversification, renewables’ development, citizen commitment, the mobilisation of technological and economic resources and finally, a model of efficiency, generation and distribution have constructive roles in energy security enhancement.
The third category of literatures analyses the performance of energy security level based on indicators (Barik, Jaiswal, and Chandra Das Citation2021; Gong, Wang, and Lin Citation2021; Li et al. Citation2020; Augutis et al. Citation2020; Kosai and Unesaki Citation2020; Gasser Citation2020; Yuan and Luo Citation2019; Lobova et al. Citation2019; Sarangi et al. Citation2019; Li and Chang Citation2019; Le and Nguyen Citation2019; Fang, Shi, and Yu Citation2018; Chalvatzis and Ioannidis Citation2017; Bilgili et al. Citation2016; Kisel et al. Citation2016; Narula Citation2014; Stirling Citation2010; Kruyt et al. Citation2009; Scheepers et al. Citation2007) and finds that strategic management, control and storage of energy supply, higher reserves of energy sources, clean energy development, optimisation of the structure of terminal energy consumption and energy efficiency improvement increase the energy security level in the countries under consideration.
The fourth sort of papers investigates the use of potential opportunities to develop energy security (Gyanwali et al. Citation2021; Khare et al. Citation2021; Yong et al. Citation2021; Bilgili, Koçak, and Bulut Citation2020; Rajavuori and Huhta Citation2020; Bekhrad, Aslani, and Mazzuca-Sobczuk Citation2020; Lavidas Citation2019; Nikolaidis, Chatzis, and Poullikkas Citation2019; Azzuni and Breyer Citation2018; Meyer Citation2003) and exhibits the positive effect of investment screening projects on energy security enhancement that is applicable through wave energy, energy hub security region, cross-border transactions in energy infrastructures, energy technologies, e.g. storage technologies and shale development, and data-intensive technologies such as the digitalisation of the energy sector.
Also, from the aspect of energy security dilemma, the comparison between the transition towards renewable energy sources or prioritised fossil fuels as reliable supplies is done (Taherahmadi, Noorollahi, and Panahi Citation2021; Mabea Citation2020; Esperanza Mata Perez, Scholten, and Smith Stegen Citation2019; Novikau Citation2019; Lu et al. Citation2019; Gillessen et al. Citation2019; Nakarmi, Mishra, and Banerjee Citation2016; Aslani et al. Citation2013; Afzal, Mohibullah, and Kumar Sharma Citation2010). They conclude that the focus on renewables lowers the import dependence of the economy, while reliable supplies can mitigate the volatility and costs of energy environment.
Accordingly, the behavioural regimes and spillover effects of natural gas trade cycles are important uncertainty signs that should be considered through the trade networks. So, the shale gas revolution would cause higher volumes of natural gas trade and, therefore, more energy security is expected.
Hence, and to fill in the gap among the literatures, the availability, affordability, accessibility and acceptability aspects of the US’ energy security are analysed through both import and export dimensions of natural gas market. To this end, first the Hodrick and Prescott (Citation1997) filter is applied to extract the stationary cyclical movements (short-term fluctuations) of natural gas import and export series by country of the US’ economy, as suggested by Ewing and Thompson (Citation2007). Secondly, the impact of the North American shale gas technology on the movement regimes for country-based natural gas trade of the US’ economy is investigated, using the Markov switching model. Then, from the perspective of the dynamic generalised forecast error variance decomposition, the network connectedness measures of Diebold and Yilmaz (Citation2016) are utilised to analyse the changes in the dynamic spillover effects between natural gas import and export cycle series by country pre- and post- the North American shale gas revolution.
Consequently, four behavioural indices, e.g. the speed of ‘downward’ regime (decrease state), typical (dominant) regime, degree of integration and uncertainty contributionFootnote4, are utilised in this paper to determine the dynamic behavioural characteristics of the US’ energy security in response to the North American shale gas technology. Then, the applicable and comprehensive natural gas trade strategies are suggested as important factors affecting the structure of energy conservation and vulnerability reduction to increase energy security and sustainable economic development.
Therefore, to understand the potential asymmetric and time-varying performance of energy security regarding the US’ natural gas trade network and its partners at different stages of economic development, the following research questions are investigated:
How the behavioural regimes (i.e. types of regimes, typical regime and speed of ‘downward’ regime) of the US’ natural gas trade cycles are explained pre- and post-the North American shale gas revolution?
What are the sensitivity levels (network structure) of the natural gas import and export cycles by country of the US’ economy in response to trade cycle shocks of the major partners? Do the network structures follow a time-varying pattern?
How influential are the suggested shocks in the short-term fluctuations of natural gas trade networks in response to the shale gas revolution? How their degree of integration changes pre- and post-revolution?
The findings of this paper support the asymmetric behavioural regimes for the cycles of the US’ natural gas trade before and after the North American shale gas revolution. Also, the time-varying contribution of the aforementioned import and export cycles in shock transmission throughout the US’ natural gas trade network is found in response to the revolution. Finally, it seems that the US’ energy security is developed in response to the shale gas revolution, as shocks occur in the energy-trading process. The results may lead to a structural framework that is supposed to enhance the US’ and world energy security and promote sustainable economic development.
Materials and methods
Materials
The natural gas trade (i.e. export and import) data by country of the US’ economy is utilised in this study since energy security is sensitive to the behavioural characteristics of resource trade (Sutrisno, Nomaler, and Alkemade Citation2021; Chalvatzis and Ioannidis Citation2017; Vivoda Citation2014; Chiang, Liu, and Wen Citation2013; Cohen, Joutz, and Loungani Citation2011). Specifically, the US’ energy security is affected by the shale gas technology, through the substitution- and scale effect (Acemoglu et al. Citation2019). Based on the substitution effect, the shale gas technological process facilitates the replacement of oil, coal and green energies (e.g. renewables and nuclear) by natural gas in energy mix that supports the physical availability, price affordability and accessibility dimensions of energy security. Also, the high-carbon substitution effect (coal- and oil replacement by natural gas) reduces emissions. In contrast, the low-carbon energy substitution effect (natural gas-green energy source substitution effect) leads to higher
emissions. It is supposed that the overall substitution effect may potentially reduce
emissions from energy consumption, since the high-carbon substitution effect overcomes the low-carbon substitution effect, which develops the environmental, political, and social acceptability dimensions of energy security. On the other hand, the physical availability, price affordability and accessibility dimensions of energy security are also improved by the scale effect of the shale gas technology since the scale effect results in price reduction of energy sources, which generally increases the energy consumption and, therefore, leads to more
emissions and then less acceptability of the resource is expected. Consequently, and from the aspect of
emissions, the shale gas revolution may enhance the US’ energy security if the overall substitution effect is negative and large enough to compensate the scale effect, especially when the marginal emissions of
from coal and oil are greater than those of natural gas. Moreover, the long-term impact of the shale gas technology is shown by the postponement of switching from fossil fuel consumption towards green innovation, i.e. towards the technology innovation of the used green energy as input for clean energy production. In other words, the environmental, political, and social acceptability dimensions of the US’ energy security will be treated as the economy is getting trapped in fossil fuels (a permanent increase in
emissions from energy consumption), whereas the availability, affordability and accessibility aspects of the US’ energy security will be improved.
From the other aspect, the energy security, regarding natural gas trade spillovers, is affected through two distinct channels (Poulakidas and Joutz Citation2009; Adland and Cullinane Citation2006; Alizadeh and Nomikos Citation2004). The first channel is that shocks in natural gas trade flows have a direct impact on GDP per capita of country ,
.as well as the whole trade network that leads to uncertainty transmission across the natural gas trade network, based on the gravity theoryFootnote5. The second channel is that shocks in natural gas prices due to changes in their trade flows have direct impacts on shipping companies’ transportation costs and then on energy security through the gravity theory. Bunker fuel price is correlated with natural gas and crude oil price. Notteboom and Vernimmen (Citation2009) found that bunker prices continuously fluctuate due to market forces. As fuel cost is the main part of transport expenditure in the tanker freight market, tanker operators would look forward to a higher freight rate to compensate for the increased transportation cost when facing an upward trend in natural gas price. Therefore, the natural gas trade shocks and spillover effects related to import and export are shifted between trade participants (Meng et al. Citation2018). It is believed that increasing reliance on import exacerbates a country’s sensitivity to the effects of natural gas shocks as risks occur in the energy-importing process (Biresselioglu, Yelkenci, and Oz Citation2015; Biresselioglu, Demir, and Kandemir Citation2012; Lacasse and Plourde Citation1995). Specifically, natural gas importers mention about uncertainties regarding the secured supply process, whereas exporters mention that the main concern is highly reliable energy exports or durable demand from buyers that are needed for the domestic economic development.
Therefore, it is expected that overall interaction between substitution and scale effects of the North American shale gas revolution through the gravity theory leads to more natural gas availability, price affordability, accessibility and acceptability through the higher volumes of natural gas trade, and hence helps to turn the US’ economy into a natural gas net exporter and develop the US’ energy security.
Accordingly, the import data in billion cubic feet for each source, e.g. Algeria, Canada, Egypt, Mexico, Nigeria, Qatar, Trinidad and Tobago and other countries as well as export data for each destination, e.g. Canada, Japan, Mexico and other countries are collected from the US’ Energy Information Administration/Monthly Energy Review 2021 for the period Jan 1973–Dec 2019. Moreover, the EIA monthly energy review (2021) shows that the US’ natural gas import from Algeria is zero after the shale gas revolution. Specifically, the cyclical movements for logarithmic series of weightedFootnote6 monthly data of natural gas trade by country of the US’ economy are suggested in this paper by taking into account changes in quantity of natural gas import and export caused by other partners to obtain distinct behavioural regimes and spillover effects of the US’ natural gas import and export cycles. To investigate the impact of the North American shale gas revolution on behavioural characteristics of the US’ country-based natural gas trade cycles, the time period under consideration is divided using the break point in 2006 as the beginning of the revolution (Aruga Citation2016; Wakamatsu and Aruga Citation2013). Also, the North American natural gas market is found to have overlapped with multiple structural breaks during the 2008 global financial crisis (Geng, Ji, and Fan Citation2016; Westgaard et al. Citation2011). Therefore, the impact of the 2008 global financial crisis is eliminated to follow the specific impact of the North American shale gas revolution on natural gas trade cycles of the US’ economy without bias. Consequently, the period between 1 January 1973 and 31 December 2005 is mentioned as pre- the North American shale gas revolution and the period from 1 September 2009 to the end of December 2019 is considered as post- the North American shale gas revolution (Geng, Ji, and Fan Citation2016; Aruga Citation2016).
Methods
As the pre-requisite of the Markov switching autoregressive and network connectedness methodologies, this study applies the Hodrick and Prescott (Citation1997) filter to calculate stationary cyclical movements (short-term fluctuations) of natural gas import and export series from a long-term trend.
Then, the Markov switching autoregressive model of regime heteroscedasticity is used for asymmetric analysis to explore the distinct behavioural regimes for cycles of natural gas import and export of the US’ economy, in response to the North American shale gas revolution. This model allows the cyclical movements of natural gas trade series to switch across different states, taking into account any changes in the short-term fluctuations over the mentioned time periods. Then, it can explore the trade regimes of natural gas import and export of the US’ economy pre- and post-the North American shale gas revolution, and then can reveal whether the shale gas revolution has caused the changes of the US’ energy security, based on their dominant trade regime differences (Geng, Ji, and Fan Citation2016).
Finally, the dynamic network connectedness measures of Diebold and Yilmaz (Citation2016) are utilised to identify the dynamic impact of the shale gas revolution on the spillover effects between cycles of country-based natural gas trade network. In a dynamic rolling window analysis, the potential changes of the natural gas import and export spillover behaviour, and, therefore, energy security development of the US’ economy can be detected before and after the North American shale gas revolution, based on the uncertainty transmission (generalised forecast error variance decomposition) throughout the trade network (Mensi et al. Citation2019; Xu et al. Citation2019; Giuseppe Caloiaa, Cipollini, and Muzzioli Citation2018).
Markov switching autoregressive model of regime heteroscedasticity
In accordance with Hamilton (Citation1989), the Markov regime-switching model is presented as follows:
(1)
(1) where
denotes the cycles of country-based natural gas import and export of the US’ economy,
and
are considered as the mean and standard deviation of
, respectively. Moreover,
is a discrete variable
which exhibits the cycles of natural gas import and export in different regimes. It is also noted that
and
are dependent on the regime
at time
. Furthermore,
is known as the parameter of model and
is a random variable with
. In addition, the minimum Akaike Information Criterion (AIC) and the statistically significant P-values of the estimated coefficients are suggested to determine the number of states.
Based on Hamilton (Citation1990), the unobservable discrete-time as well as state of Markov process is used to simulate . Hence, the matrix of transition probabilities is shown by
(2)
(2) where
with
for all
. Hamilton (Citation1990) proposes the maximum likelihood estimation method to estimate the aforementioned parameters. Moreover, the value of
equals
as
is
and, therefore, the conditional probability density function of variable
is
(3)
(3) where
presents all the information that are captured until
time. Accordingly,
denotes the parameter vector of the model which can be estimated. Furthermore, as
is conditional then the probability
is known. Therefore, the probability density of variable
can be written as
(4)
(4)
Moreover, the total log likelihood function for the observation period is
(5)
(5)
Also, the maximisation of the log likelihood function is considered to estimate the model coefficients.
Then, filtering probability of is denoted as follows:
(6)
(6)
The smooth probability suggests that the sample information of all the time points is used to determine the probability at different states. Hence, the state at each particular moment for the specified samples is considered, based on the smoothing method proposed by Kim (Citation1994). Accordingly, the smooth probabilities of the model are determined by the following equation:
(7)
(7)
Finally, the expected duration of determined regimes is captured from the transition probability . Specifically, the expected duration of regime
is
(8)
(8)
Therefore, and to clarify how behavioural indices regarding the Markov regime-switching model work, more energy security is assessed after the revolution as the speed of ‘downward’ regime or decrease state for the US’ natural gas import (export) increases (decreases) as well as the import (export) model exhibits the existence of typical ‘downward’ regime (‘upward’ regime or increase state).
Network connectedness measures of Diebold and Yilmaz (Citation2016)
This paper implements the Diebold-Yilmaz measures (2016) to calculate the dynamic connectedness and degree of integration to analyse the spillover effects and interdependence of natural gas import and export cycles by country in the US’ natural gas trade networks. This methodology clarifies the direction and magnitude of the shock effect in the short-term fluctuations of the US’ natural gas trade networks, based on the variance decomposition matrix of a vector-autoregressive (VAR) model. The VAR () model can be presented as
(9)
(9) where
: the vector of cycle series of the US’ country-based natural gas import and export,
the companion matrix containing the coefficients. The moving average representation is
.
is the recursive form of
, where
is the identity matrix and
. The moving average coefficients denoted by
are of utmost importance in understanding the dynamic links between variables. The moving average divides the H-step-ahead forecast error variances of each variable into parts attributable to the network shocks. Specifically, there are hundreds of moving average coefficients to interpret, but variance decomposition framework transforms them to a readable formatFootnote7.
Based on Koop, Pesaran, and Potter (Citation1996) and Pesaran and Shin (Citation1998), this paper follows the generalised forecast error variance decomposition approach to estimate the parameters of the network and calculate variance decompositions, when the shocks happen across the networks. As a consequence, there is no concern regarding the ordering of variables throughout the network.
So, the pairwise spillover effect for H-step ahead or variable ’s contribution to the H-period ahead generalised error variance of the variable
determined by
(10)
(10) where
is the standard deviation of errors (
), ∑ is the variance matrix of
, and
,
are the selection column vectors with
th element unity and zeros elsewhere, respectively.
is the fraction of the H-step-ahead error variance of
from shocks to
. In the generalised variance decomposition matrix, diagonals and off-diagonals present own- (variable
to itself) and pairwise contributions (variable
to variable
), respectively. However, row sums in generalised variance decomposition matrices are not necessarily equal to 1 and thus each entry is normalised by the row sum as follows:
(11)
(11)
Diebold and Yilmaz (Citation2016) define the pairwise directional connectedness from to
using
. Accordingly, the total directional spillover effect is calculated to determine the coordination measures across the suggested cycles. Hence, the net pairwise directional connectedness from
to
is identified as follows:
(12)
(12)
Also, the directional spillover effect from others to is expressed by
(13)
(13) while the directional spillover effect from
to others is
(14)
(14)
Moreover, the net directional spillover effect is considered as
(15)
(15)
Finally, the spillover index (average total spillover), , is calculated to show the degree of integration of the network:
(16)
(16) where
is the uncertainty contribution of variable
to itself,
is the uncertainty contribution of variable-
to
. The spillover index exhibits the degree of integration or the average share of each variable in shock transmission throughout the entire network. A higher degree of integration reduces the time, risks, and costs needed to reach the market and, therefore, more energy security is expected. Also, more total spillover effect (uncertainty contribution) shows more important role of the variable in shock transmission throughout the import and export network that can amplify the improvement or decline energy security process. Moreover, the net directional spillover effect is used to conclude that whether one variable is a net shock-transmitter or recipient across the network. Consequently, energy security is affected through natural gas import behavioural indices as follows:
But, the effect of natural gas export behavioural indices on energy security is summarised as follows:
Results and discussion
Results
Results of the Hodrick and Prescott (Citation1997) filter
The Markov switching autoregressive- and network connectedness approaches require that no non-stationary variables are involved. Hence, the unit root tests, based on automatic bandwidth selection of Andrews (Citation1991) and Newey and West (Citation1994), support the conclusion that all cyclical movements (short-term fluctuations) extracted from long-term trend of the suggested series under consideration, are stationary at the 1% significance level.
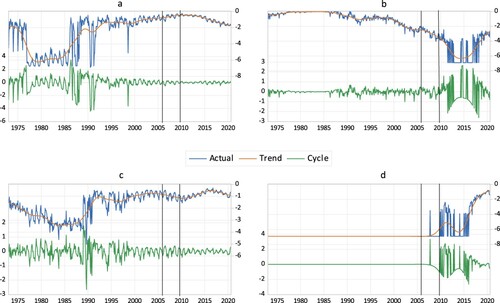
The cycles of the US’ natural gas import and export by country show different behavioural characteristics such as the magnitude and duration of fluctuations (ups and downs) pre- and post- the North American shale gas revolution ( and ). Therefore, the asymmetric and time-varying analysis of behavioural regimes and spillover effects of the cycles may help the US’ economy to mitigate the natural gas trade fluctuations and the economic vulnerability in the line of energy security.
Figure 2. The US’ natural gas import by country: Actual, Trend & Cycle: (a) Algeria, (b) Canada, (c) Egypt, (d) Mexico, (e) Nigeria, (f) Qatar, (g) other countries.
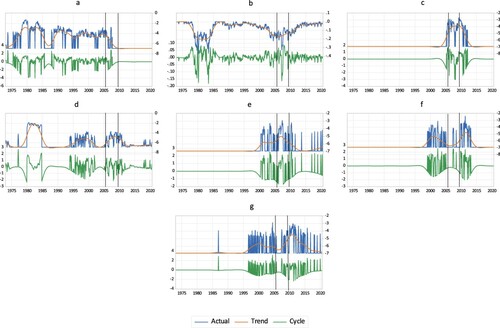
Figure 3. The US’ natural gas export by country: Actual, Trend & Cycle: (a) Canada, (b) Japan, (c) Mexico, (d) other countries.
Results of the US’ natural gas trade behaviour pre- and post- the North American shale gas revolution
To understand how availability, affordability, accessibility as well as acceptability dimensions of the US’ energy security react in response to the North American shale gas technology, four behavioural indices, e.g. the speed of ‘downward’ regime, typical regime, degree of integration and uncertainty contribution, are analysed.
The US’ natural gas import behaviour
Regimes of the US’ natural gas import and export cycles are explained in accordance with the number of cycle states, which is basically specified on the minimum AIC value criterion as well as the statistically significance of the estimated parameters. Therefore, and based on the sign and the value of estimated parameter, two general ‘upward’ (increase state) and ‘downward’ (decrease state) regimes of the cycles on this paper are classified into the following sub-regimes, e.g. ‘slightly’, ‘moderately’ and ‘sharply’ (Geng, Ji, and Fan Citation2016; Zhang and Zhang Citation2015; Artis, Krolzig, and Toro Citation2004; Ferrara Citation2003). Especially, the ‘upward’ regime (‘downward’ regime) is assessed as the sign of the estimated parameter is positive (negative) that shows the increase (decrease) state of the specified regime. Also, as the results show more than one ‘upward’ or ‘downward’ regimes, the ‘slightly’, ‘moderately’ and ‘sharply’ regimes are detected based on the descending to ascending sizes or magnitudes of the estimated parameters, respectively. In accordance with , after the shale gas revolution and based on the monthly expected durations of the specified regimes, the typical regime of import cycles from Canada and Egypt (Mexico) switches from ‘downward’ (‘sharply upward’) to ‘upward’ (‘downward’), while the ‘downward’ (‘upward’) regime of Nigeria and Qatar (Trinidad and Tobago) remains unchanged in comparison with pre- revolution. Moreover, the speed of ‘downward’ regime for import cycles from all countries under consideration, except Nigeria, is increased by the revolution, that is aligned with Acemoglu et al. (Citation2019), Kim, Cho, and Lee (Citation2017), Geng, Ji, and Fan (Citation2016) and Middleton et al. (Citation2012).
Table 1. Results of the US’ natural gas import behaviour pre- and post- the North American shale gas revolution.
On the other hand, the spillover index (S.I) of natural gas import by country of the US’ economy is doubled after the shale gas revolution (29.5%). Therefore, the shale gas revolution leads to markedly higher-average level of network sensitivity, degree of integration and the importance of focus for reasoning shock transmission through the natural gas import cycles that are called the internal affecting factors defining the network. In accordance with total spillover effects, the cycles of natural gas import from Canada (Algeria) meet the unilateral spillover effect to (from) the import network before the revolution. Moreover, natural gas import cycles from Canada, Algeria and Mexico contribute in shock transmission to the network respectively, while Algeria, Canada and Mexico experience uncertainty contribution levels from others throughout the network. Also, the cycles of natural gas import from Canada, Mexico and Nigeria (Trinidad and Tobago, Qatar and Egypt) are net shock-transmitters (receivers) throughout the import network after the revolution. Furthermore, natural gas import cycles from Canada, Nigeria, Mexico, Egypt, Qatar and Trinidad and Tobago contribute in shock transmission to as well as from the network, respectively. Specifically, the spillover contribution of the US’ import cycles from Canada and Mexico to the network is increased after the revolution. As the other result of shale gas revolution, the US’ import from Algeria is ceased, whereas the US starts to import natural gas from Egypt, Nigeria, Qatar, Trinidad and Tobago and some other gas exporting countries.
Hence, and compatible with the studies of Peng et al. (Citation2021); Shirazi et al. (Citation2020), Sutrisno, Nomaler, and Alkemade (Citation2021), Rodríguez-Fernandez, Belen Fernandez Carvajal, and Manuel Ruiz-Gomez (Citation2020), Dong et al. (Citation2020), Shirazi et al. (Citation2019), Zhong et al. (Citation2017) and Kern and Rogge (Citation2016) among others, more energy network connectedness is needed to raise energy security, since the average share of each cycle in forecast error variance decomposition throughout the US’ import network is positively affected by the shale gas revolution. Moreover, and consistent with Biresselioglu, Yelkenci, and Oz (Citation2015), Biresselioglu, Demir, and Kandemir (Citation2012) and Lacasse and Plourde (Citation1995), increasing reliance on import exacerbates a country’s sensitivity to the effects of natural gas shocks as risks occur in the energy-importing process.
The US’ natural gas export behaviour
Based on the results of monthly expected durations of the specified regimes, the typical ‘upward’ (‘downward’) regime of export cycles to Canada and Mexico (Japan) is not affected by the revolution. But, the speed of ‘downward’ regime for export cycles to Mexico and Japan (Canada) is increased (decreased) after the revolution (). Therefore, the energy security can be increased through the strategic management, control and storage of energy supply, higher reserves of energy sources, clean energy development, optimisation of the structure of terminal energy consumption and energy efficiency improvement as the outcome of the shale gas revolution (Barik, Jaiswal, and Chandra Das Citation2021; Gong, Wang, and Lin Citation2021; Li et al. Citation2020; Augutis et al. Citation2020; Lin and Yousaf Raza Citation2020 among others).
Table 2. Results of the US’ natural gas export behaviour pre- and post- the North American shale gas revolution.
Like the import behaviour, the degree of integration (S.I) across cycles of the US’ natural gas export by country is doubled after the shale gas revolution (25.1%). Hence, the average share of each cycle in forecast error variance decomposition throughout the export network is positively affected by the shale gas revolution. Moreover, natural gas export cycles to Canada (Japan) show the unilateral spillover effect to (from) the export network, while export cycles to Mexico are passive in shock transmission before the revolution. Additionally, natural gas export cycles to Canada, Japan and Mexico contribute in uncertainty transmission to the network respectively, while Japan, Canada and Mexico experience contribution levels from others throughout the network. Also, the cycles of natural gas export to Mexico and Canada (Japan and some other importing countries) are net shock-transmitters (receivers) throughout the export network after the revolution. Furthermore, natural gas export cycles to Mexico, Canada, and Japan contribute in shock transmission to as well as from the network, respectively. Specifically, the spillover contribution of the US’ export cycles to Canada and Mexico to the network is considerably increased, while the spillover contribution the US’ export cycles to Japan is markedly decreased after the revolution. Consequently, energy security enhancement is applicable through energy hub security region, cross-border transactions in energy infrastructures and energy technologies, e.g. storage technologies and shale development, that is aligned with Yong et al. (Citation2021), Rajavuori and Huhta (Citation2020), Bekhrad, Aslani, and Mazzuca-Sobczuk (Citation2020) and Azzuni and Breyer (Citation2018).
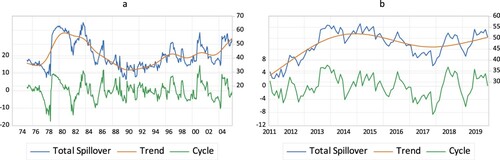
The spillover behaviour of the US’ natural gas import and export
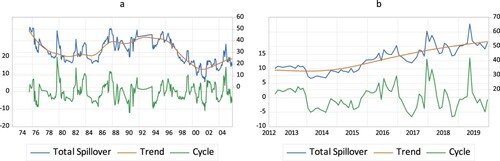
The Hodrick and Prescott (Citation1997) filter is also used to depict and explore the actual, short-term fluctuations and long-term trend of total spillover effects, extracted from the US’ natural gas import and export networks.
Before the revolution, the actual spillover effect exhibits consecutive U-shaped and inverted U-shaped patterns, while an upward trend is detected after the revolution. But, the short-term fluctuations of total spillover are mitigated after the shale gas revolution. Accordingly, the spillover cycles of the US’ natural gas import expose energy security development after the North American shale gas revolution ().
Figure 4. Time-varying spillover effect of the US’ natural gas import by country pre- and post- the North American shale gas revolution: (a) pre- the North American shale gas revolution, (b) post- the North American shale gas revolution.
Also, the actual spillover effect of the US’ natural gas export exhibits consecutive U-shaped and inverted U-shaped trend, before the revolution, while the inverted U-shaped and U-shaped trend are detected, respectively, after the revolution. Moreover, the short-term fluctuations of total spillover are markedly mitigated after the shale gas revolution (). Therefore, the US’ energy security is developed after the North American shale gas revolution, since the spillover cycles of natural gas export are mitigated.
Figure 5. Time-varying spillover effect of the US’ natural gas export by country pre- and post- the North American shale gas revolution: (a) pre- the North American shale gas revolution, (b) post- the North American shale gas revolution.
Additionally, the US’ energy security seems to be promoted after the shale gas revolution since the typical regime of import cycles switches from ‘sharply upward’ to ‘downward’ and the speed of typical ‘downward’ regime regarding total spillover of natural gas import is increased. Furthermore, the behavioural characteristics (e.g. the speed of the ‘downward’ regime and typical regime) of total spillover of the US’ natural gas export show that the shale gas revolution has no negative impact on the US’ energy security ().
Table 3. Results of total spillover of the US’ natural gas trade pre- and post- the North American shale gas revolution (Markov regime switching model).
Discussion
The behavioural characteristics of the US’ natural gas import from Canada, Egypt, Mexico, Qatar and Trinidad and Tobago are in the line to enhance the US’ energy security. Specifically, they show markedly contribution in forecast error variance decomposition, when the cyclical shocks happen throughout import network. Also, the US becomes less vulnerable on natural gas import from the mentioned countries since the speed of ‘downward’ regime is increased after the revolution. Moreover, the US’ natural gas import from Nigeria indicates considerable contribution to the network. However, the behaviour of the US’ import from Nigeria is not on the way to improve the US’ energy security due to decreasing speed of the ‘downward’ regime after the revolution. Therefore, as the shocks in natural gas import cycles have a direct impact on economic growth, economic stability promotes energy security and vice versa. So, based on the gravity theory, the interaction between substitution and scale effect of the shale gas revolution lowers the US’ sensitivity to the effects of natural gas import shocks as risks occur in the energy-importing process. It can be concluded, since the overall total spillover effect of the US’ natural gas sources as well as speed of ‘downward’ regime is increased after the revolution.
But, the post-revolution behaviour of the US’ natural gas export to Canada supports the US’ energy security. Especially, the natural gas export to Canada is considered as one of the main contributors in forecast error variance decomposition throughout export network that may occur to the US’ reliable energy exports (durable demand). In addition, the speed of ‘downward’ regime is decreased as the result of substitution and scale effects of the revolution. While the behaviour of natural gas export to Mexico may not lead to more the US’ energy security, the opposite results are detected after the revolution. Furthermore, the US’ energy security may not be affected by the increasing speed of the ‘downward’ regime regarding the US’ natural gas export to Japan. Also, the US’ export to Japan does not show a markedly contribution to the US’ natural gas export network that may be due to high transportation cost (). Hence, the overall greater total spillover effect of the US’ natural gas export is accompanied with higher speed of the ‘upward’ regime that promotes the US’ energy security.
As the other sign of the US’ energy security progress, the shale gas revolution leads to more spillover index (S.I) or degree of integration across the US’ natural gas import and export networks ( and ). Hence, the time, risks and costs that are needed to reach the natural gas market are reduced and, therefore, the US’ energy security is increased after the shale gas revolution. Moreover, it seems that the US has increased natural gas trade flows via swaps trading with Canada and Mexico after the revolution, which improves the US’ energy security. Furthermore, the total spillover effects of behavioural regimes of the US’ natural gas import and export verify that the US’ energy security is progressed after the shale gas revolution ().
Consequently, the overall interaction between substitution and scale effect of the shale gas revolution (Acemoglu et al. Citation2019; Kim, Cho, and Lee Citation2017; Middleton et al. Citation2012) through the gravity theory (Biresselioglu, Yelkenci, and Oz Citation2015; Biresselioglu, Demir, and Kandemir Citation2012; Lacasse and Plourde Citation1995) develops the US’ energy security as shocks occur in the energy-trading process. Specifically, the substitution effect of the shale gas technology facilitates the replacement of coal, oil and green energy sources (e.g. nuclear power and renewable energy resources) by natural gas in energy mix that supports the physical availability, price affordability and accessibility dimensions of the US’ energy security. Furthermore, the intermediate technology of shale gas revolution develops the environmental, political, and social acceptability dimensions of the US’ energy security since the price reduction of natural gas decreases the emissions. Also, the availability, affordability and accessibility aspects of the US’ energy security are supported through higher natural gas trade flows, caused by the scale effect of the shale revolution (Sutrisno, Nomaler, and Alkemade Citation2021; APERC Citation2007).
Finally, to validate the robustness of the results, the Markov switching specifications, e.g. Log likelihood and Durbin-Watson statistics as well as probabilities and expected durations, are compared through different non-switching regressors and a number of regimes and, therefore, the most reliable econometric results are presented. Also, different rolling window lengths and forecast horizons are used in dynamic network connectedness measures and it is found that the results are robust since the differences in the spillover effects are narrow.
Notwithstanding the potential energy security improvements, including more natural gas availability, price affordability, accessibility and acceptability, as the benefits of the shale gas technology, the technological advancements of the shale gas innovation significantly intensify the shale gas production that cause undesirable explicit market effects and environmental concerns, e.g. methane emissions as the by-products of shale gas and marine pollution due to high water intensity of hydraulic fracturing (Bilgili et al. Citation2016; Wang et al. Citation2014), local anomalies and habitat destruction (Mason, Muehlenbachs, and Olmstead Citation2015), which are considered as the limitations of this article and hence, suggested to analyse by further investigations.
Conclusion
Despite oversupply in the current state of natural gas markets, new energy security concerns are created since natural gas markets are transforming from regional to global and interdependent market.
While the energy security has explicit and implicit impacts on the economy, the US’ natural gas trade behaviour shapes geopolitics and affects the global energy security. The role of the North American shale gas revolution on energy security is known as a necessary condition to overcome the barriers on the way of vulnerability reduction and promotion sustainable economic development for the US as the world’s largest energy-consuming economy. To this end, a comprehensive analysis is aimed to examine asymmetric and time-varying behavioural characteristics of the US’ natural gas trade.
Accordingly, first the Markov regime switching model is applied to determine potential asymmetric movements may happen by the cycles of the US’ natural gas import and export using monthly data before and after the US’ shale gas revolution. Then, the network connectedness measures of Diebold and Yilmaz (Citation2016) are used to follow the potential time-varying impact of the US’ shale gas revolution on contribution of natural gas trade cycles in shock transmission throughout the US’ trade network.
The findings support the asymmetric behavioural regimes for the cycles of the US’ natural gas trade before and after the North American shale gas revolution. Also, the time-varying contribution of aforementioned import and export cycles in shock transmission throughout the US’ natural gas trade network is found, in response to the revolution. Consequently, based on the research findings and to target the structure of energy conservation and vulnerability reduction through natural gas trade for expanding sustainable economic development of the US’ economy, the most important policy implications are as follows:
Alternating investigation of behavioural regimes and spillover effects through potential and actual trade links in world natural gas trade networks is essential to assess energy security since the impacts of shale gas revolution cause higher volumes of natural gas trade
Periodic analysis of the related internal factors defining the trade networks, i.e. preference ordering of cooperation and competition-based trade strategies, diversification of import sources and export destinations
Periodic analysis of the related external affecting factors defining the trade networks, i.e. natural gas derivatives’ market development, energy reserves, production capacities and geopolitics
Keep existing natural gas import sources to cover domestic demand and use the advantage of scale effect to export to Japan and Korea as the US’ traditional alliances with approximately 60% of Asian LNG demand and non-traditional emerging importers in the Asia, e.g. Bangladesh, China, India and Pakistan that have most of the future growth
Analysis of the institutional characteristics and intermediate technology of the US’ shale gas production to facilitate utilisation of the desirable explicit and implicit energy security outcomes, especially for China, Argentina, Algeria, Canada, Mexico, Australia, South Africa, Russia and Brazil that have technically recoverable shale gas reserves, but haven’t markedly started to extract the resource due to the technological constraints
Also, the following areas of interest in the future studies are expected to be valuable for the US’ and world’s energy security improvement:
Study the environmental concerns, e.g. methane emissions and marine pollution, of the shale gas technology
Focus on the North-Western Europe as a potential natural gas market may enhance the US’ energy security since domestic productions’ rapid decline and increase in import requirements are accompanied with growing natural gas demand fluctuations of the region
The development in co-operation between henry hub and NBPFootnote8 that may improve the security of supply along major natural gas trade routes
Disclosure statement
No potential conflict of interest was reported by the author(s).
Notes
1 Asia Pacific Energy Research Centre.
2 - See Mason, Muehlenbachs, and Olmstead (Citation2015), for more details.
3 Energy Information Administration (2021).
4 For details, see the estimation methods.
5 Gravity Theory:,
is the trade flow from country i to country j,
are country i’s GDP and country j's GDP, respectively,
is their distance, and
is the constant. For details, see Tsurumi, Managi, and Hibiki (Citation2015).
6 The US’ natural gas import and export series by each country are weighted by dividing the total natural gas import and export, respectively.
7 For more details, see Hamilton (Citation1989) and Diebold and Yilmaz (Citation2016).
8 National Balancing Point (UK).
References
- Acemoglu, D., P. Aghion, L. Barrage, and D. Hémous. 2019. “Climate Change, Directed Innovation, and Energy Transition: The Long-Run Consequences of the Shale Gas Revolution.” https://scholar.harvard.edu/aghion/publications/climate-change-directed-innovation-and-energy-transition-long-run-consequences. Handle: RePEc:red:sed019:1302.
- Adland, R., and K. Cullinane. 2006. “The Non-Linear Dynamics of Spot Freight Rates in Tanker Markets.” Transportation Research Part E: Logistics and Transportation Review 42 (3): 211–224. doi:https://doi.org/10.1016/j.tre.2004.12.001
- Afzal, A., M. Mohibullah, and V. Kumar Sharma. 2010. “Optimal Hybrid Renewable Energy Systems for Energy Security: A Comparative Study.” International Journal of Sustainable Energy 29 (1): 48–58. doi:https://doi.org/10.1080/14786460903337241
- Alizadeh, A. H., and N. K. Nomikos. 2004. “Cost of Carry, Causality and Arbitrage Between Oil Futures and Tanker Freight Markets.” Transportation Research Part E: Logistics and Transportation Review 40 (4): 297–316. doi:https://doi.org/10.1016/j.tre.2004.02.002
- An, H., W. Zhong, Y. Chen, H. Li, and X. Gao. 2014. “Features and Evolution of International Crude oil Trade Relationships: A Trading-Based Network Analysis.” Energy 74: 254–259. doi:https://doi.org/10.1016/j.energy.2014.06.095
- Andrews, D. W. K. 1991. “Heteroskedasticity and Autocorrelation Consistent Covariance Matrix Estimation.” Econometrica 59: 817–858. doi:https://doi.org/10.2307/2938229
- Antweiler, W., B. R. Copeland, and M. S. Taylor. 2001. “Is Free Trade Good for the Environment?.” American Economic Review 91 (4): 877–908. doi:https://doi.org/10.1257/aer.91.4.877
- APERC (Asia Pacific Energy Research Centre). 2007. A Quest for Energy Security in the 21st Century: Resources and Constraints. Japan: Institute of Energy Economics: 45–54.
- Artis, M., H. M. Krolzig, and J. Toro. 2004. “The European Business Cycle.” Oxford Economic Papers 56 (1): 1–44. doi:https://doi.org/10.1093/oep/56.1.1
- Aruga, K. 2016. “The U.S. Shale Gas Revolution and its Effect on International Gas Markets.” Journal of Unconventional Oil and Gas Resources 14: 1–5. doi:https://doi.org/10.1016/j.juogr.2015.11.002
- Aslani, A., M. Naaranoja, P. Helo, E. Antila, and E. Hiltunen. 2013. “Energy Diversification in Finland: Achievements and Potential of Renewable Energy Development.” International Journal of Sustainable Energy 32 (5): 504–514. doi:https://doi.org/10.1080/14786451.2013.766612
- Augutis, J., R. Krikstolaitis, L. Martisauskas, S. Urbonien, R. Urbonas, and A. Barbora Uspurien. 2020. “Analysis of Energy Security Level in the Baltic States Based on Indicator Approach.” Energy 199: 117427. doi:https://doi.org/10.1016/j.energy.2020.117427
- Auping, W. L., E. Pruyt, S. de Jong, and J. H. Kwakkel. 2016. “The Geopolitical Impact of the Shale Revolution: Exploring Consequences on Energy Prices and Rentier States.” Energy Policy 98: 390–399. https://doi.org/http://doi.org/10.1016/j.enpol.2016.08.032
- Azzuni, A., and C. Breyer. 2018. “Energy Security and Energy Storage Technologies.” Energy Procedia 155: 237–258. doi:https://doi.org/10.1016/j.egypro.2018.11.053
- Balbás Egea, JÁ, and J. A. Eguren Egiguren. 2019. “Bases for a Sustainable Energy Model. Case Study: Basque Autonomous Community.” International Journal of Sustainable Energy 38 (9): 884–903. doi:https://doi.org/10.1080/14786451.2019.1609474
- Barik, A. K., S. Jaiswal, and D. Chandra Das. 2021. “Recent Trends and Development in Hybrid Microgrid: A Review on Energy Resource Planning and Control.” International Journal of Sustainable Energy. doi:https://doi.org/10.1080/14786451.2021.1910698
- Bekhrad, K., A. Aslani, and T. Mazzuca-Sobczuk. 2020. “Energy Security in Andalusia: The Role of Renewable Energy Sources.” Case Studies in Chemical and Environmental Engineering 1: 100001. doi:https://doi.org/10.1016/j.cscee.2019.100001
- Bilgili, F., E. Koçak, and Ü Bulut. 2020. “The Shale Gas Production and Economic Growth in Local Economies Across the US.” Environmental Science and Pollution Research 27: 12001–12016. doi:https://doi.org/10.1007/s11356-020-07776-7
- Bilgili, F., E. Koçak, Ü Bulut, and M. N. Sualp. 2016. “How did the US Economy React to Shale Gas Production Revolution? An Advanced Time Series Approach.” Energy 116: 963–977. https://doi.org/http://doi.org/10.1016/j.energy.2016.10.056
- Biresselioglu, M. E., M. H. Demir, and C. Kandemir. 2012. “Modeling Turkey’s Future LNG Supply Security Strategy.” Energy Policy 46: 144–152. doi:https://doi.org/10.1016/j.enpol.2012.03.045
- Biresselioglu, M. E., T. Yelkenci, and I. O. Oz. 2015. “Investigating the Natural Gas Supply Security: A New Perspective.” Energy 80: 168–176. doi:https://doi.org/10.1016/j.energy.2014.11.060
- Chalvatzis, K. J., and A. Ioannidis. 2017. “Energy Supply Security in the EU: Benchmarking Diversity and Dependence of Primary Energy.” Applied Energy 207: 465–476. doi:https://doi.org/10.1016/j.apenergy.2017.07.010
- Cherp, A., and J. Jewell. 2014. “The Concept of Energy Security: Beyond the Four As.” Energy Policy 75: 415–421. doi:https://doi.org/10.1016/j.enpol.2014.09.005
- Cherp, A., J. Jewell, and A. Goldthau. 2011. “Governing Global Energy: Systems, Transitions, Complexity.” Global Policy 2 (1): 75–88. doi:https://doi.org/10.1111/j.1758-5899.2010.00059.x
- Chiang, C. F., J. T. Liu, and T. W. Wen. 2013. “Individual Preferences for Trade Partners in Taiwan.” Economics & Politics 25: 91–109. doi:https://doi.org/10.1111/ecpo.12000
- Cohen, G., F. Joutz, and P. Loungani. 2011. “Measuring Energy Security: Trends in the Diversification of Oil and Natural Gas Supplies.” Energy Policy 39 (9): 4860–4869. doi:https://doi.org/10.1016/j.enpol.2011.06.034
- Colglazier, E. W., and D. A. Deese. 1983. “Energy and Security in the 1980s.” Annual Review of Energy 8 (1): 415–449. doi:https://doi.org/10.1146/annurev.eg.08.110183.002215
- Csereklyei, Z., and D. I. Stern. 2015. “Global Energy Use: Decoupling or Convergence?” Energy Economics 51: 633–641. doi:https://doi.org/10.1016/j.eneco.2015.08.029
- Diebold, F. X., and K. Yilmaz. 2016. “Trans-Atlantic Equity Volatility Connectedness: U.S. and European Financial Institutions, 2004–2014.” Journal of Financial Econometrics 14 (1): 81–127. doi:https://doi.org/10.1093/jjfinec/nbv021
- Dong, G., T. Qing, R. Du, C. Wang, R. Li, M. Wang, L. Tian, L. Chen, A. L. M. Vilela, and H. E. Stanley. 2020. “Complex Network Approach for the Structural Optimization of Global Crude Oil Trade System.” Journal of Cleaner Production 251: 119366. doi:https://doi.org/10.1016/j.jclepro.2019.119366
- Esperanza Mata Perez, M., D. Scholten, and K. Smith Stegen. 2019. “The Multi-Speed Energy Transition in Europe: Opportunities and Challenges for EU Energy Security.” Energy Strategy Reviews 26: 100415. doi:https://doi.org/10.1016/j.esr.2019.100415
- Ewing, B. T., and M. A. Thompson. 2007. “Dynamic Cyclical Co-Movements of Oil Prices with Industrial Production, Consumer Prices, Unemployment and Stock Prices.” Energy Policy 35 (11): 5535–5540. doi:https://doi.org/10.1016/j.enpol.2007.05.018
- Fang, D., S. Shi, and Q. Yu. 2018. “Evaluation of Sustainable Energy Security and an Empirical Analysis of China.” Sustainability 10 (5): 1685. doi:https://doi.org/10.3390/su10051685
- Ferrara, L. 2003. “A Three-Regime Real-Time Indicator for the US Economy.” Economics Letters 81 (3): 373–378. doi:https://doi.org/10.1016/S0165-1765(03)00220-9
- Gasser, P. 2020. “A Review on Energy Security Indices to Compare Country Performances.” Energy Policy 139: 111339. doi:https://doi.org/10.1016/j.enpol.2020.111339
- Geng, G. B., Q. Ji, and Y. Fan. 2016. “The Impact of the North American Shale Gas Revolution on Regional Natural gas Markets: Evidence from the Regime-Switching Model.” Energy Policy 96: 167–178. doi:https://doi.org/10.1016/j.enpol.2016.05.047
- Gillessen, B., H. Heinrichs, J. F. Hake, and H. J. Allelein. 2019. “Energy Security in Context of Transforming Energy Systems: A Case Study for Natural Gas Transport in Germany.” Energy Procedia 158: 3339–3345. doi:https://doi.org/10.1016/j.egypro.2019.01.966
- Giuseppe Caloiaa, F., A. Cipollini, and S. Muzzioli. 2018. “Asymmetric Semi-Volatility Spillover Effects in EMU Stock Markets.” International Review of Financial Analysis 57: 221–230. doi:https://doi.org/10.1016/j.irfa.2018.03.001
- Global Energy Institute. The US Chamber of Commerce. 2020. “International Index of Energy Security Risk. Assessing Risk in a Global Energy Market”.
- Goldthau, A. 2011. “Governing Global Energy: Existing Approaches and Discourses.” Current Opinion in Environmental Sustainability 3 (4): 213–217. doi:https://doi.org/10.1016/j.cosust.2011.06.003
- Gong, X., Y. Wang, and B. Lin. 2021. “Assessing Dynamic China’s Energy Security: Based on Functional Data Analysis.” Energy 217: 119324. doi:https://doi.org/10.1016/j.energy.2020.119324
- Griffiths, S. 2017. “A Review and Assessment of Energy Policy in the Middle East and North Africa Region.” Energy Policy 102: 249–269. doi:https://doi.org/10.1016/j.enpol.2016.12.023
- Guan, Q., H. An, X. Gao, S. Huang, and H. Li. 2016. “Estimating Potential Trade Links in the International Crude Oil Trade: A Link Prediction Approach.” Energy 102: 406–415. doi:https://doi.org/10.1016/j.energy.2016.02.099
- Gyanwali, K., R. Komiyama, Y. Fujii, and T. Ratna Bajracharya. 2021. “A Review of Energy Sector in the BBIN Sub-Region.” International Journal of Sustainable Energy 40 (6): 530–556. doi:https://doi.org/10.1080/14786451.2020.1825436
- Hamilton, J. D. 1989. “A New Approach to the Economic Analysis of Non-Stationary Time Series and the Business Cycle.” Econometrica 57 (2): 357–384. doi:https://doi.org/10.2307/1912559
- Hamilton, J. D. 1990. “Analysis of Time Series Subject to Changes in Regime.” Journal of Econometrics 45 (1-2): 39–70. doi:https://doi.org/10.1016/0304-4076(90)90093-9
- Hasanov, F. G., C. Mahmudlu, K. Deb, S. Abilov, and O. Hasanov. 2020. “The Role of Azeri Natural Gas in Meeting European Union Energy Security Needs.” Energy Strategy Reviews 28: 100464. doi:https://doi.org/10.1016/j.esr.2020.100464
- Hodrick, J. R., and E. C. Prescott. 1997. “Postwar U.S. Business Cycles: An Empirical Investigation.” Journal of Money, Credit and Banking 29: 1–16. doi:https://doi.org/10.2307/2953682
- Hummels, D., J. Ishii, and K. M. Yi. 2001. “The Nature and Growth of Vertical Specialization in World Trade.” Journal of International Economics 54: 75–96. doi:https://doi.org/10.1016/S0022-1996(00)00093-3
- Institute for 21st Century Energy. 2015. Assessing Risk in a Global Energy Market. Inst. 21 St Century Energy – US Chamb. Commer.
- Ji, Q., H. Y. Zhang, and Y. Fan. 2014. “Identification of Global Oil Trade Patterns: An Empirical Research Based on Complex Network Theory.” Energy Conversion and Management 85: 856–865. doi:https://doi.org/10.1016/j.enconman.2013.12.072
- Karatayev, M., and S. Hall. 2020. “Establishing and Comparing Energy Security Trends in Resource-Rich Exporting Nations (Russia and the Caspian Sea Region).” Resources Policy 68: 101746. doi:https://doi.org/10.1016/j.resourpol.2020.101746
- Kern, F., and K. S. Rogge. 2016. “The Pace of Governed Energy Transitions: Agency, International Dynamics and the Global Paris Agreement Accelerating Decarbonisation Processes?” Energy Research & Social Science 22: 13–17. doi:https://doi.org/10.1016/j.erss.2016.08.016
- Khare, V., C. Khare, S. Nema, and P. Baredar. 2021. “Renewable Energy System Paradigm Change from Trending Technology: A Review.” International Journal of Sustainable Energy 40 (7): 697–718. doi:https://doi.org/10.1080/14786451.2020.1860043
- Kim, C. J. 1994. “Dynamic Linear Models with Markov-Switching.” Journal of Econometrics 60 (1–2): 1–22. doi:https://doi.org/10.1016/0304-4076(94)90036-1
- Kim, T. H., J. Cho, and K. S. Lee. 2017. “Evaluation of CO2 Injection in Shale Gas Reservoirs with Multi-Component Transport and Geomechanical Effects.” Applied Energy 190: 1195–1206. doi:https://doi.org/10.1016/j.apenergy.2017.01.047
- Kisel, E., A. Hamburg, M. Harm, A. Leppiman, and M. Ots. 2016. “Concept for Energy Security Matrix.” Energy Policy 95: 1–9. doi:https://doi.org/10.1016/j.enpol.2016.04.034
- Koop, G., M. H. Pesaran, and S. M. Potter. 1996. “Impulse Response Analysis in Nonlinear Multivariate Models.” Journal of Econometrics 74: 119–147. doi:https://doi.org/10.1016/0304-4076(95)01753-4
- Kosai, S., and H. Unesaki. 2020. “Quantitative Evaluation of Security of Nuclear Energy Supply: United States as a Case Study.” Energy Strategy Reviews 29: 100491. doi:https://doi.org/10.1016/j.esr.2020.100491
- Kruyt, B., D. P. van Vuuren, H. J. M. de Vries, and H. Groenenberg. 2009. “Indicators for Energy Security.” Energy Policy 37 (6): 2166–2181. doi:https://doi.org/10.1016/j.enpol.2009.02.006
- Kuuskraa, V. A., S. H. Stevens, and K. Moodhe. 2013. Technically Recoverable Shale Oil and Shale Gas Resources: An Assessment of 137 Shale Formations in 41 Countries Outside the United States. Washington: EIA. U.S. Energy Information Administration.
- Lacasse, C., and A. Plourde. 1995. “On the Renewal of Concern for the Security of Oil Supply.” Energy 16 (2): 1–23. doi:https://doi.org/10.5547/ISSN0195-6574-EJ-Vol16-No2-1
- Lavidas, G. 2019. “Developments of Energy in EU – Unlocking the Wave Energy Potential.” International Journal of Sustainable Energy 38 (3): 208–226. doi:https://doi.org/10.1080/14786451.2018.1492578
- Le, T. H., and C. P. Nguyen. 2019. “Is Energy Security a Driver for Economic Growth? Evidence from a Global Sample.” Energy Policy 129: 436–451. doi:https://doi.org/10.1016/j.enpol.2019.02.038
- Li, Y., and Y. Chang. 2019. “Road Transport Electrification and Energy Security in the Association of Southeast Asian Nations: Quantitative Analysis and Policy Implications.” Energy Policy 129: 805–815. doi:https://doi.org/10.1016/j.enpol.2019.02.048
- Li, J., L. Wang, X. Lin, and S. Qu. 2020. “Analysis of China’s Energy Security Evaluation System: Based on the Energy Security Data from 30 Provinces from 2010 to 2016.” Energy 198: 117346. doi:https://doi.org/10.1016/j.energy.2020.117346
- Lin, B., and M. Yousaf Raza. 2020. “Analysis of Energy Security Indicators and CO2 Emissions. A Case from a Developing Economy.” Energy 200: 117575. doi:https://doi.org/10.1016/j.energy.2020.117575
- Liu, L., Z. Cao, X. Liu, L. Shi, S. Cheng, and G. Liu. 2020. “Oil Security Revisited: An Assessment Based on Complex Network Analysis.” Energy 194: 116793. doi:https://doi.org/10.1016/j.energy.2019.116793
- Lobova, S. V., J. V. Ragulina, A. V. Bogoviz, and A. N. Alekseev. 2019. “Energy Security Performance: A Dataset on the Member Countries of the Commonwealth of Independent States, 2000–2014.” Data in Brief 26: 104450. doi:https://doi.org/10.1016/j.dib.2019.104450
- Lu, H., F. Y. Xu, H. Liu, J. Wang, D. E. Campbell, and H. Ren. 2019. “Energy-Based Analysis of the Energy Security of China.” Energy 181: 123–135. doi:https://doi.org/10.1016/j.energy.2019.05.170
- Mabea, G. A. 2020. “Electricity Market Coupling and Investment in Renewable Energy: East Africa Community Power Markets.” International Journal of Sustainable Energy 39 (4): 321–334. doi:https://doi.org/10.1080/14786451.2019.1709461
- Maltby, T. 2013. “European Union Energy Policy Integration: A Case of European Commission Policy Entrepreneurship and Increasing Supranationalism.” Energy Policy 55: 435–444. doi:https://doi.org/10.1016/j.enpol.2012.12.031
- Mason, C. F., L. A. Muehlenbachs, and S. M. Olmstead. 2015. “The Economics of Shale Gas Development.” Annual Review of Resource Economics 7: 269–289. doi:https://doi.org/10.1146/annurev-resource-100814-125023
- Melikoglu, M. 2014. “Shale Gas: Analysis of its Role in the Global Energy Market.” Renewable and Sustainable Energy Reviews 37: 460–468. https://doi.org/http://doi.org/10.1016/j.rser.2014.05.002
- Meng, J., Z. Mi, D. Guan, J. Li, S. Tao, Y. Li, K. Feng, et al. 2018. “The Rise of South–South Trade and its Effect on Global CO2 Emissions.” Nature Communications 9: 1871. doi:https://doi.org/10.1038/s41467-018-04337-y
- Mensi, W., A. Sensoy, A. Aslan, and S. Hoon Kange. 2019. “High-Frequency Asymmetric Volatility Connectedness Between Bitcoin and Major Precious Metals Markets.” The North American Journal of Economics and Finance 50: 101031. doi:https://doi.org/10.1016/j.najef.2019.101031
- Meyer, N. I. 2003. “Distributed Generation and the Problematic Deregulation of Energy Markets in Europe.” International Journal of Sustainable Energy 23 (4): 217–221. doi:https://doi.org/10.1080/01425910412331290724
- Middleton, R. S., G. N. Keating, P. H. Stauffer, A. B. Jordan, H. S. Viswanathan, and Q. J. Kang. 2012. “The Cross-Scale Science of CO2 Capture and Storage: From Pore Scale to Regional Scale.” Energy & Environmental Science 5: 7328–7345. doi:https://doi.org/10.1039/C2EE03227A
- Nakarmi, A. M., T. Mishra, and R. Banerjee. 2016. “Integrated MAED–MARKAL-Based Analysis of Future Energy Scenarios of Nepal.” International Journal of Sustainable Energy 35 (10): 968–981. doi:https://doi.org/10.1080/14786451.2014.966712
- Narula, K. 2014. “Is Sustainable Energy Security of India Increasing or Decreasing?” International Journal of Sustainable Energy 33 (6): 1054–1075. doi:https://doi.org/10.1080/14786451.2014.966712
- Nepal, R., and N. Paija. 2019. “Energy Security, Electricity, Population and Economic Growth: The Case of a Developing South Asian Resource-Rich Economy.” Energy Policy 132: 771–781. doi:https://doi.org/10.1016/j.enpol.2019.05.054
- Newey, W. K., and K. D. West. 1994. “Automatic Lag Selection in Covariance Matrix Estimation.” The Review of Economic Studies 61 (4): 631–653. doi:https://doi.org/10.2307/2297912
- Nikolaidis, P., S. Chatzis, and A. Poullikkas. 2019. “Renewable Energy Integration Through Optimal Unit Commitment and Electricity Storage in Weak Power Networks.” International Journal of Sustainable Energy 38 (4): 398–414. doi:https://doi.org/10.1080/14786451.2018.1516669
- Notteboom, T. E., and B. Vernimmen. 2009. “The Effect of High Fuel Costs on Liner Service Configuration in Container Shipping.” Journal of Transport Geography 17 (5): 325–337. doi:https://doi.org/10.1016/j.jtrangeo.2008.05.003
- Novikau, A. 2019. “Conceptualizing and Achieving Energy Security: The Case of Belarus.” Energy Strategy Reviews 26: 100408. doi:https://doi.org/10.1016/j.esr.2019.100408
- Peng, P., F. Lu, Sh Cheng, and Y. Yang. 2021. “Mapping the Global Liquefied Natural Gas Trade Network: A Perspective of Maritime Transportation.” Journal of Cleaner Production 283: 124640. doi:https://doi.org/10.1016/j.jclepro.2020.124640
- Pesaran, H. H., and Y. Shin. 1998. “Generalized Impulse Response Analysis in Linear Multivariate Models.” Ecology Letters 58: 17–29. doi:https://doi.org/10.1016/S0165-1765(97)00214-0
- Poulakidas, A., and F. Joutz. 2009. “Exploring the Link Between Oil Prices and Tanker Rates.” Maritime Policy & Management 36 (3): 215–233. doi:https://doi.org/10.1080/03088830902861094
- Rajavuori, M., and K. Huhta. 2020. “Investment Screening: Implications for the Energy Sector and Energy Security.” Energy Policy 144: 111646. doi:https://doi.org/10.1016/j.enpol.2020.111646
- Renou-Maissant, P. 1999. “Interfuel Competition in the Industrial Sector of Seven OECD Countries.” Energy Policy 27 (2): 99–110. doi:https://doi.org/10.1016/S0301-4215(99)00006-3
- Rodríguez-Fernandez, L., A. Belen Fernandez Carvajal, and L. Manuel Ruiz-Gomez. 2020. “Evolution of European Union’s Energy Security in Gas Supply During Russia–Ukraine Gas Crises (2006–2009).” Energy Strategy Reviews 30: 100518. doi:https://doi.org/10.1016/j.esr.2020.100518
- San-Akca, B., S. D. Sever, and S. Yilmaz. 2020. “Does Natural Gas Fuel Civil War? Rethinking Energy Security, International Relations, and Fossil-Fuel Conflict.” Energy Research & Social Science 70: 101690. doi:https://doi.org/10.1016/j.erss.2020.101690
- Sarangi, G. K., A. Mishra, Y. Chang, and F. Taghizadeh-Hesary. 2019. “Indian Electricity Sector, Energy Security and Sustainability: An Empirical Assessment.” Energy Policy 135: 110964. doi:https://doi.org/10.1016/j.enpol.2019.110964
- Scheepers, M., A. Seebregts, J. de Jong, and H. Maters. 2007. EU Standards for Energy Security of Supply. Energy Research Centre of the Netherlands.
- Serletis, A., G. R. Timilsina, and O. Vasetsky. 2011. “International Evidence on Aggregate Short-Run and Long-Run Interfuel Substitution.” Energy Economics 33 (2): 209–216. doi:https://doi.org/10.1016/j.eneco.2010.05.013
- Shepard, J. U., and L. F. Pratson. 2020. “Hybrid Input-Output Analysis of Embodied Energy Security.” Applied Energy 279: 115806. doi:https://doi.org/10.1016/j.apenergy.2020.115806
- Shirazi, M., A. Ghasemi, T. Mohammadi, A. Faridzad, and A. Taklif. 2019. “A Dynamic Network Comparison Analysis of Iran’s Crude Oil International Trade.” Journal of Iranian Energy Economics 8 (31): 75–114. doi:https://doi.org/10.22054/JIEE.2019.12299
- Shirazi, M., A. Ghasemi, T. Mohammadi, J. Šimurina, A. Faridzad, and A. Taklif. 2020. “A Dynamic Network Comparison Analysis of Crude Oil Trade: Evidence from Eastern Europe and Eurasia.” Zagreb International Review of Economics and Business 23 (1): 95–119. doi:https://doi.org/10.2478/zireb-2020-0007
- Stirling, A. 2010. “Multicriteria Diversity Analysis.” Energy Policy 38 (4): 1622–1634. doi:https://doi.org/10.1016/j.enpol.2009.02.023
- Sutrisno, A., O. Nomaler, and F. Alkemade. 2021. “Has the Global Expansion of Energy Markets Truly Improved Energy Security?” Energy Policy 148: 111931. doi:https://doi.org/10.1016/j.enpol.2020.111931
- Taherahmadi, J., Y. Noorollahi, and M. Panahi. 2021. “Toward Comprehensive Zero Energy Building Definitions: A Literature Review and Recommendations.” International Journal of Sustainable Energy 40 (2): 120–148. doi:https://doi.org/10.1080/14786451.2020.1796664
- Tian, L., Z. Wang, A. Krupnick, and X. Liu. 2014. “Stimulating Shale Gas Development in China: A Comparison with the US Experience.” Energy Policy 75: 109–116. doi:https://doi.org/10.1016/j.enpol.2014.07.025
- Tsurumi, T., S. Managi, and A. Hibiki. 2015. “Do Environmental Regulations Increase Bilateral Trade Flows?” The B.E. Journal of Economic Analysis and Policy 15 (4): 1549–1577. doi:https://doi.org/10.1515/bejeap-2014-0164
- Tuchinda, N., S. Moryadee, C. U-tapao, and L. Laokhongthavorn. 2021. “A Multi-Period Linear Programming Model for the Natural Gas Distribution Network of Thailand.” International Journal of Sustainable Energy. doi:https://doi.org/10.1080/14786451.2021.1924716
- Vivoda, V. 2014. “LNG Import Diversification in Asia.” Energy Strategy Reviews 2: 289–297. doi:https://doi.org/10.1016/j.esr.2013.11.002
- Wakamatsu, H., and K. Aruga. 2013. “The Impact of the Shale Gas Revolution on the U.S. and Japanese Natural Gas Markets.” Energy Policy 62: 1002–1009. doi:https://doi.org/10.1016/j.enpol.2013.07.122
- Wang, Q., X. Chen, A. N. Jha, and H. Rogers. 2014. “Natural Gas from Shale Formation – The Evolution, Evidences and Challenges of Shale Gas Revolution in United States.” Renewable and Sustainable Energy Reviews 30: 1–28. doi:https://doi.org/10.1016/j.rser.2013.08.065
- Westgaard, S., M. Estenstad, M. Seim, and S. Frydenberg. 2011. “Co-Integration of ICE Gas Oil and Crude Oil Futures.” Energy Economics 33: 311–320. doi:https://doi.org/10.1016/j.eneco.2010.11.010
- Wu, X. F., and G. Q. Chen. 2019. “Global Overview of Crude Oil Use: From Source to Sink Through Inter-Regional Trade.” Energy Policy 128: 476–486. doi:https://doi.org/10.1016/j.enpol.2019.01.022
- Xu, W., F. Ma, W. Chen, and B. Zhang. 2019. “Asymmetric Volatility Spillovers Between Oil and Stock Markets: Evidence from China and the United States.” Energy Economics 80: 310–320. doi:https://doi.org/10.1016/j.eneco.2019.01.014
- Yergin, D. 1988. “Energy Security in the 1990s.” Foreign Affairs 67 (1): 110–132. doi:https://doi.org/10.2307/20043677
- Yergin, D. 2006. “Ensuring Energy Security.” Foreign Affairs 85 (2): 69–82. doi:https://doi.org/10.2307/20031912
- Yong, P., Y. Wang, T. Capuder, Z. Tan, N. Zhang, and C. Kang. 2021. “Steady-State Security Region of Energy Hub: Modeling, Calculation, and Applications.” Electrical Power and Energy Systems 125: 106551. doi:https://doi.org/10.1016/j.ijepes.2020.106551
- Yuan, J., and X. Luo. 2019. “Regional Energy Security Performance Evaluation in China Using MTGS and SPA-TOPSIS.” Science of the Total Environment 696: 133817. doi:https://doi.org/10.1016/j.scitotenv.2019.133817
- Zeng, S., D. Streimikiene, and T. Balezentis. 2017. “Review of and Comparative Assessment of Energy Security in Baltic States.” Renewable and Sustainable Energy Reviews 76: 185–192. doi:https://doi.org/10.1016/j.rser.2017.03.037
- Zhang, Y. J., and L. Zhang. 2015. “Interpreting the Crude Oil Price Movements: Evidence from the Markov Regime Switching Model.” Applied Energy 143: 96–109. doi:https://doi.org/10.1016/j.apenergy.2015.01.005
- Zhong, W. Q., H. An, X. Gao, and X. Sun. 2014. “The Evolution of Communities in the International Oil Trade Network.” Physica A: Statistical Mechanics and its Applications 413: 42–52. doi:https://doi.org/10.1016/j.physa.2014.06.055
- Zhong, W., H. An, L. Shen, T. Dai, W. Fang, X. Gao, and D. Dong. 2017. “Global Pattern of the International Fossil Fuel Trade: The Evolution of Communities.” Energy 123: 260–270. doi:https://doi.org/10.1016/j.energy.2017.02.033