
 ?Mathematical formulae have been encoded as MathML and are displayed in this HTML version using MathJax in order to improve their display. Uncheck the box to turn MathJax off. This feature requires Javascript. Click on a formula to zoom.
ABSTRACT
This paper presents the electrical performance of organic photovoltaic modules (OPVs) on top of a polyethylene covered greenhouse high tunnel in a Mediterranean climate. Modules from a previous study were kept on the tunnel and monitored together with new modules with improved connectors installed on the greenhouse roof and on frames adjacent to the greenhouse. Measured module power conversion efficiencies ranged from 1% to 3%. The typical combined output of the modules across the tunnel roof were 105Wh on a sunny day and 81Wh on a cloudy day. Module burn-in period was about 15 days, losing around 36% of its initial efficiency. Ts80 lifetimes ranged from 7 days to 94 days. Tunnel integration was shown to accelerate module degradation.
1. Introduction
Greenhouse agriculture addresses both global water and food security, by greatly increasing annual crop yields whilst reducing water consumption (Cook and Calvin Citation2005). However, in many cases, greenhouse agriculture remains highly energy intensive due to the additional energy needed to control its microclimate (Bot et al. Citation2005). Agrivoltaics provides an opportunity to offset the large energy consumption with renewable energy and a dual land use, thereby turning greenhouse agriculture into an environmentally sustainable solution (Yano and Cossu Citation2019; Hassanien, Li, and Lin Citation2016; Wang et al. Citation2017; Yano et al. Citation2009). Although the integration of silicon photovoltaics (PV) into greenhouses have previously been studied (Yano et al. Citation2009; Yano et al. Citation2010; Campiotti et al. Citation2011; Pérez-Alonso et al. Citation2012), semi-transparent organic photovoltaics (OPV) may be potentially a better suited solution for greenhouse applications, as they allow some light to be transmitted into the greenhouse and their absorption spectra can be tuned to mainly absorb light not needed for crop growth allowing the remaining light to reach the plants (Emmott et al. Citation2015; Liu et al. Citation2019). In addition, the polyethylene substrate material used in OPVs is similar to the covers of polyethylene-covered greenhouses, facilitating their integration into plastic-covered greenhouses. Other advantages of OPVs are that they are lightweight, flexible, have a low carbon footprint, are easily recycled/decommissioned and are predicted to have lower production costs than silicon PVs when mass produced (Carlé et al. Citation2017; Mulligan et al. Citation2014; Chatzisideris et al. Citation2017).
Emmott et al. (Citation2015) investigated the impact of different OPV materials on crop growth and evaluated the efficiency and spectral transparency of several semi-conducting polymer materials. They also carried out a techno-economic analysis of an organic photovoltaic greenhouse, predicting a great potential for OPV greenhouses pending OPV cost reductions. They concluded that although semi-transparent OPV devices had lower outputs compared to opaque crystalline silicon, OPV devices using PMDPP3T and PCDTBT materials performed better compared to opaque, flexible thin-film modules such as CIGS (Copper-Indium-Gallium-Selenide). Friman-Peretz et al. (Citation2019) studied the radiometric and thermal properties of an OPV module to assess its suitability as a greenhouse cover and concluded that OPV modules acting as shading devices on a greenhouse roof could as well as producing electricity, reduce excess solar energy and hence alleviate greenhouse heat loads.
Different simulation models have been developed to find the optimum OPV coverage in terms of output and crop quality (Teranaka, Ikeda, and Doi Citation2016; Okada et al. Citation2017). Okada et al. (Citation2017) found that 49% roof coverage with OPV was able to meet the energy requirement of the greenhouse evaluated in the study. Ravishankar et al. (Citation2020) developed a detailed energy balance model of greenhouses integrating semi-transparent organic solar cells. They found that net-zero energy greenhouses could be achieved, with an annual surplus of energy, in warm and moderate climates. In their study, they assumed an active solar cell area coverage of 85% of the roof area by selecting OPV device structures with minimum absorption in the PAR spectrum and reliance of additional light entering the greenhouse from the walls.
Different OPV outdoor lifetime studies have been carried out in different parts of the world, such as Krebs et al. (Citation2009) in their round robin study and others listed by Zhang et al. (Citation2018) in several countries including Denmark, UK, Holland, Germany, USA, Australia, India and Israel. Bristow and Kettle (Citation2015) presented the effect of temperature and irradiance on the performance of inverted organic photovoltaic modules in an outdoor study in Wales during summer and winter seasons. Emmott et al. (Citation2016) carried out field trials of OPV devices installed on corrugated steel roofs at two sites in a rural village in Southern Rwanda. The panels were exposed to very high levels of insolation (especially UV), high temperatures and heavy rainfall. This led to a 5–6 fold reduction of module lifetimes compared to the same devices kept both in the dark and outdoors in Roskilde, Denmark. The degradation of the panels was mainly due to extensive delamination caused by failure of the non-UV stable encapsulation. Dos Reis Benatto et al. (Citation2017) carried out a two-year outdoor stability test of OPVs with two different device architectures outside and inside a greenhouse in the Netherlands. They found that module lifetime was improved slightly by having them inside the greenhouse, where they were protected from weather related degradation.
Hartner et al. (Citation2015) found that diurnal and annual outputs of a PV system could be maximised by having panels at a combination of different tilt angles, thereby increasing the economic viability. Stoichkov et al. (Citation2019) found similar results for OPVs. Their study looked at the outdoor performance of building-integrated organic photovoltaics in a building prototype and found that the top-facing module had the highest energy yield overall. However, they also found that the west-facing modules could generate power during peak power periods in a building application. This highlighted the significance of module orientation for energy yield across diurnal and seasonal changes. Hirata, Watanabe, and Yachi (Citation2018) compared the outputs of OPVs in different orientations model greenhouse with a curved roof and found that module outputs varied depending on their location and orientation. Magadley et al. (Citation2020) carried out a 12 weeks investigation of the outdoor performance of OPVs installed at three different orientations on the roof of a polytunnel in a Mediterranean climate, investigating the effect of diffuse and direct irradiance and solar incidence angles on the performance of the OPVs and found that the panel on the top ridge overall yielded the highest output. However, the combination of panels on different parts of the greenhouse roof would provide a more even electricity supply throughout the day.
Friman-Peretz et al. (Citation2020) showed that at noon (11:00–13:00), there was no significant difference in the mean seasonal (June–September 2018, May–August 2019) air temperature and humidity between the control and OPV greenhouses. In 2018 (control covered by polyethylene only), the greenhouses differed in terms of the radiation spatial transmittance and leaf temperature. The average radiation level along the OPV tunnel centreline was much lower, and the radiation distribution was less homogenous than in the control. In 2019 (control covered by polyethylene & shading net), with similar shading percentages in the tunnels, similar average radiation levels were observed. The leaf temperature in the OPV greenhouse was lower by 1.9°C than in the control in 2018 and varied from higher to lower in 2019. The leaf area index (LAI), cumulative yield, and average fruit weight were higher in the OPV than in the control in 2018, and similar in 2019. The average value of the maximum power output of three OPV modules increased roughly linearly with irradiance.
If OPVs on greenhouse applications are to become mainstream, it is vital to understand both the effect on the crops inside the greenhouse and the electrical behaviour of the OPV modules in a greenhouse application. This paper presents the results of a study in 2018 and 2019, investigating the electrical behaviour of OPVs on a high tunnel greenhouse roof.
2. Materials and methods
Two similar greenhouse tunnels (hereafter referred to as tunnels) covered by polyethylene, with their axis oriented north-south were used in this study, one for testing the OPV modules and their effect as shading elements, on microclimate and plant parameters, and the other served as control. For details on the experimental facility and measurement setup refer to Magadley et al. (Citation2020).
The OPV modules used in this study were PBTZT-stat-BDTT-8-based roll-to-roll printed semi-transparent modules. More detail can be found in the article by Berny et al. (Citation2016). The modules had a rated cell efficiency at STC of 3.3% and nominal power of 14 Wp. The OPV module size was 800 × 1000 mm with an active area of 655 × 855 mm and had a thickness of 0.6 mm.
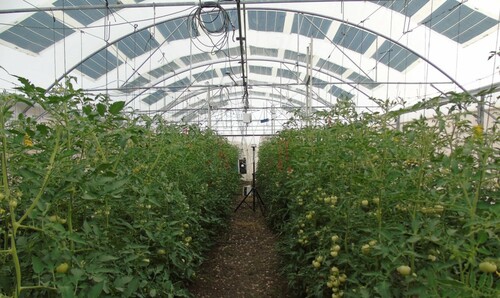
Because of the low transmittance of the OPV modules in the PAR range (about 23%), only about 37% of the roof area was covered by OPV modules as shown in , to avoid a high level of shading.
Figure 1. View of inside the polytunnel greenhouse.
To monitor the electrical behaviour of the modules in different locations on the tunnel roof, 5 individual OPV modules were monitored across the curve of the roof on the Northern end of the tunnel () and another two of the same modules on frames above the roof of a small building next to the tunnels at tilt angles 0⁰ and 30⁰ facing south along with a polycrystalline silicon PV (si-PV) panel (Bluesun Solar, Hefei, China). The si-PV panel had the following specifications: Model type: BSM-045P, Solar cell type: Poly 156 × 156 cell, Panel size: 660 × 550 × 30 mm, Pmax = 45W, Vmp = 17.6 V, Imp = 2.56A, Voc = 21.9 V, Isc = 2.85A @STC.
Figure 2. Layout of OPV and siPV modules on the tunnel roof and on frames next to the tunnel in 2019. From right to left O1 – O5 and A2 – A9.
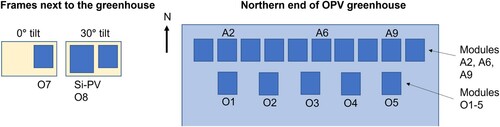
This study builds on the previous work by the authors (Magadley et al. Citation2020), which looked at the electrical behaviour of three modules on the same tunnel roof from 18 October 2018 to 13 January 2019. These modules (A2, A6 and A9) were also kept on the roof and were continued to be monitored throughout this second monitoring period (June–December 2019).
The tilt angles and orientations of the modules in this study, shown in , were as follows:
O1: 25⁰ tilt facing east O5: 25⁰ tilt facing west SiPV: 30⁰ tilt facing south
O2: 13⁰ tilt facing east O7: 0⁰ tilt A2: 21° tilt facing west
O3: 0⁰ tilt O8: 30⁰ tilt facing south A6: 11° tilt facing east
O4: 13⁰ tilt facing west A9: 27° tilt facing east
The data collection setup and method to measure the electrical behaviour of the OPV modules, which followed the ISOS-O-2 outdoor measurement protocol (Reese et al. Citation2011), is detailed by Magadley et al. (Citation2020).
3. Results and discussion
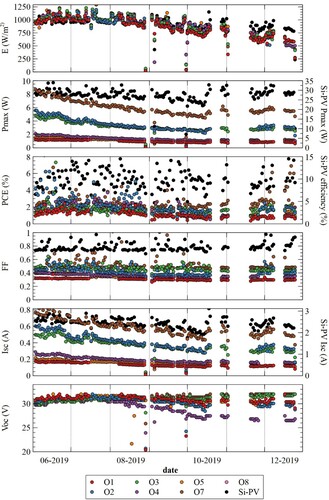
The OPV electrical measurements were taken from 21 May 2019 to 25 December 2019 during daylight hours. shows the daily maximum values of incident irradiance (E), maximum power point (Pmax), power conversion efficiency (PCE), fill factor (FF), short circuit current (Isc) and open-circuit voltage (Voc) from for modules O1-5 on the tunnel roof and O7-8 and si-PV on frames beside the tunnel. A large variation in Pmax values can be seen among the OPV modules, which is also reflected in Isc, FF and PCE. It is assumed to be due to the location on the tunnel roof or on the frames and due to the different degradation rate of the modules over time. However, there were also some significant differences among the modules from the beginning of the measurement period. Initial Pmax values varied between 1 and 9W and PCE between 1% and 3% for the OPV modules. As expected, a reduction in incident irradiance on the modules can be noticed from June to December, influencing output of all the modules. The OPV modules showed more of a reduction in output compared to the si-PV panel. This was assumed to be due to the degradation of the OPV modules over time in combination with the negative temperature coefficient of the si-PV panel leading to higher performances as the ambient temperatures reduced. On the 15 October 2019, the first day of rain occurred, which cleaned the modules and si-PV panel from accumulated dust, leading to an increase in output after this point.
Figure 3. Daily maximum values of E, Pmax, PCE, FF, Isc and Voc for modules O1-5, O7-8 and siPV.
shows the output and average efficiencies and fill factors for modules O1-5 on the polytunnel roof, and O7, O8 and siPV on frames adjacent to the polytunnel. As expected, the siPV panel had the highest output, efficiencies and fill factors. Of the OPV modules on the polytunnel roof, module O3 (0° tilt) on the ridge of the roof had the highest output and modules with highest tilt angles O1 (25° tilt facing West) and O5 (25° tilt facing East) had the lowest outputs. shows that efficiencies peaked at around 3% and 14% for the OPV and siPV respectively. Due to its negative temperature coefficient, the siPV panel had highest efficiencies in the morning hours, when temperatures were lower and the modules had not absorbed much heat yet. OPV modules O7 and O8 on the frames next to the tunnel also had their peak efficiencies in the morning. OPV modules O1-5 on the tunnel roof had highest efficiencies at different times of day, depending on their location on the roof. Their peak efficiencies occurred at times when they were not in direct incident irradiance, i.e. in the morning for modules O1 and O2 on the west and in the afternoon for modules O4 and O5 on the east side of the roof. Module O3 on the top of the tunnel roof had its highest efficiencies in the morning and lowest efficiencies in the afternoon. This concurs with the 2018 study (Magadley et al. Citation2020), where OPV module efficiencies were highest early morning, declining with high incident irradiance and recovering overnight and to some extent in shaded conditions.
Table 1. Output and average efficiencies and fill factors for modules O1-5, O7, O8 and siPV from 21 May 2019 to 25 December 2019.
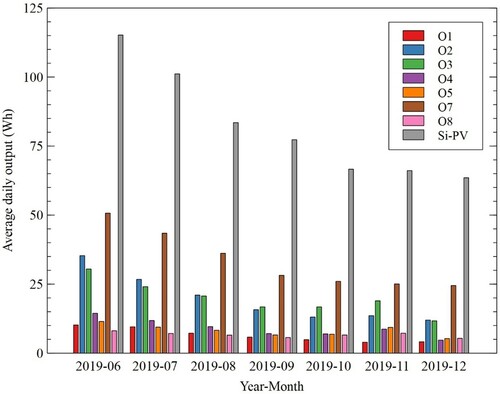
shows the average daily output of the modules per month throughout the measurement period. As expected, the highest output for all modules was in the first month of the measurement period, in June and then decreased in the consecutive months until December. This was due to the decrease in incident irradiance and daylight hours, degradation of the OPV modules, change in solar elevation angle and an accumulation of dust on the modules. Less of a reduction in output can be seen from October onwards when precipitation was more frequent, reducing the accumulation of dust on the modules.
Figure 4. Monthly average daily outputs (Wh) of modules O1-8 and Si-PV.
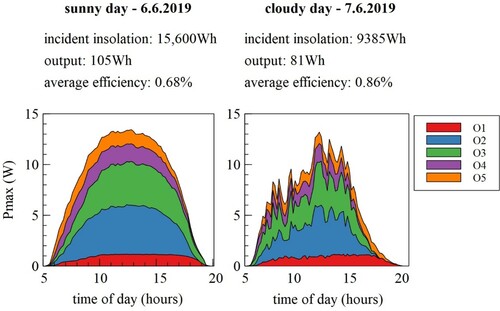
shows the combined output of modules O1-5 across the curved roof on a sunny (6 June 2019) and a cloudy day (7 June 2019) at the beginning of the measurement period. The sum of the daily incident insolation on all 5 modules combined throughout the day was calculated by adding the accumulated insolation for each panel throughout the day and were 15,600 and 9285 Wh per day on the sunny and cloudy day respectively. Output and average efficiency were 105Wh and 0.65% on the sunny day and 81Wh and 0.86% on the cloudy day. Magadley et al. (Citation2020) determined the efficiency of the modules to be higher in overcast conditions compared to sunny conditions. The same phenomenon was noticed in the current study, when considering the combined efficiency of the modules across the curve of the tunnel roof. Due to the modules being distributed across the arch of the roof from east to west, the overall output can generate a more distributed output throughout the day, minimising large peaks around midday. This is an advantage both for onsite use and for grid connection.
Figure 5. Diurnal combined output of modules O1-5 across the curved roof on a sunny and a cloudy day (6.6.2019 and 7.6.2019).
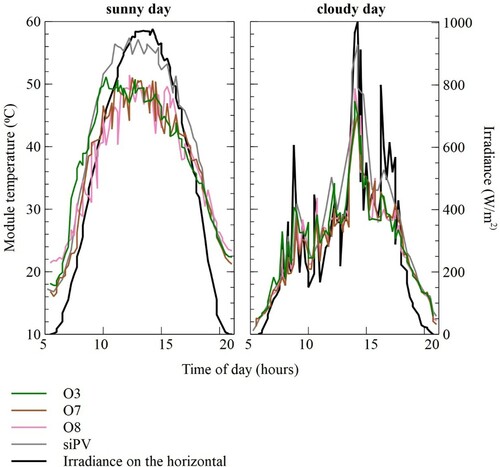
shows the diurnal temperature variation of modules O3, O7, O8 and siPV panel on the sunny day 6 June 2019 and the cloudy day 7 June 2019. The temperatures were influenced by incident irradiance and to some extent by the ambient outdoor temperature. Curves of OPV module temperatures varied slightly, depending on location and orientation of the modules, however, the peak temperature they all reached on those days was around 50⁰C. This was the case for OPV on the tunnel roof and on the frames, at tilt 0⁰ and 30⁰ facing south. The siPV panel temperature increase was higher with incident irradiance, reaching a maximum of 57⁰C at noon, indicating higher heat absorption compared to the OPV modules.
Figure 6. Diurnal OPV module temperature of modules O3, O7, O8 and siPV on a sunny and a cloudy day (6.6.2019 and 7.6.2019).
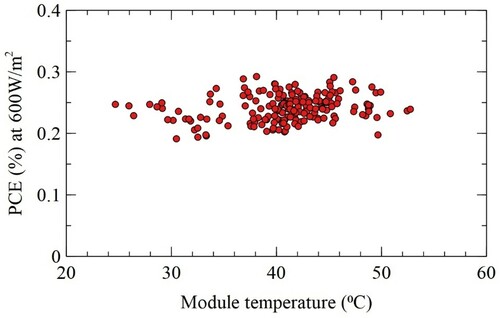
shows a trend of slight increase in efficiency with temperature for module O8, confirming the positive temperature coefficient of the modules, listed temperature coefficient of +0.02% for Pmax in the manufacturer’s specification.
Figure 7. Module O8 PCE vs Module temperature.
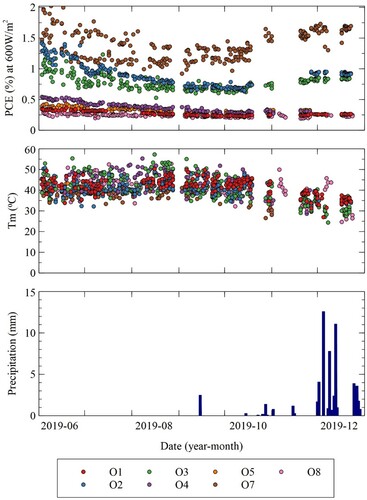
, however, shows an increase in efficiencies at 600 W/m2 for some modules at the end of the measurement period. Due to the positive temperature coefficient of the modules, this increase in efficiency is therefore assumed to be due to other factors. Precipitation increased during that period, which cleaned the modules from the summer dust accumulation, thereby increasing their output and recorded efficiencies. In addition, the diurnal degradation effect caused by high incident irradiance, also decreased in the winter months and consequently led to higher efficiency measurements in those conditions. In order to determine the full effect of these factors on panel efficiency, controlled indoor tests would need to be carried out.
Figure 8. Efficiency and module temperature at 600W/m2 incident irradiance and precipitation during the measurement period.
showed a reduction in the maximum measured values of output and efficiencies of the OPVs over the measurement period, which was attributed both to weather changes and to degradation of the modules. To evaluate the stability of the modules over the measurement period, the normalised efficiencies of the OPV modules were calculated. The data were filtered for irradiance values of 600 ± 15W/m2 for normalised PCE calculations, due to the fact that efficiency values varied with incident irradiance, as detailed in the study by Magadley et al. (Citation2020). Normalised PCE (PCEn) of O1-5 and O7-8 was calculated by the ratio of measured efficiency (PCEmeasured) to the initial power generation (PCEinitial):
(1)
(1)
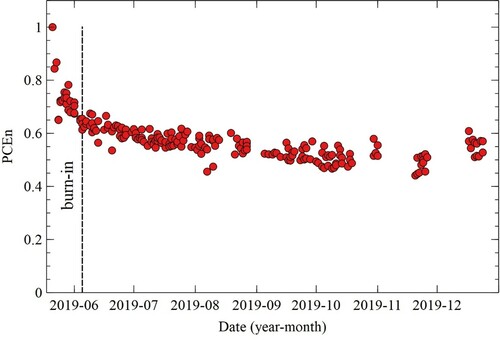
The lifetime parameter T80 is defined as the time over which the efficiency decays to 80% of its initial value. T80 can often be very short and more than 20% of initial efficiency can be lost during the burn-in period. In this case T80 was only 90 h. Ts80, the time over which the efficiency decays to 80% of its value after the burn-in period, usually gives a better indication of the lifetime of a module. shows the normalised PCE of module O8, with a burn-in period of about 15 days (360 h) from the 21 May 2019 to the 05 June 2019 at which the module lost 36.5% of its initial efficiency. After burn-in, the measured average daily maximum efficiencies of OPV modules O1, O2, O3, O4, O5, O7 and O8 were 1.11%, 2.14%, 1.74%, 1.60%, 1.40%, 2.51% and 1.16%, respectively.
Figure 9. Module O8 normalised PCE indicating the burn-in period
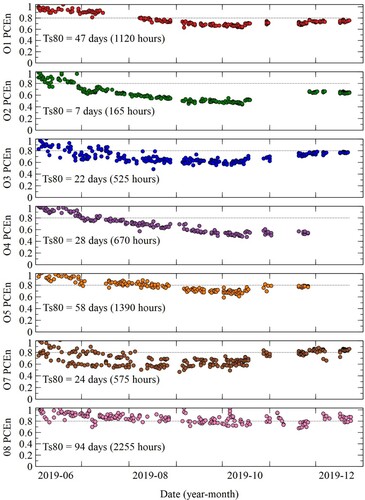
shows normalised PCE values throughout the measurement period after the burn-in period at incident irradiance of 600W/m2. Ts80 lifetimes vary widely between the different modules, ranging from 7 days (165 h) to 94 days (2255 h). It should however be noted that efficiencies increased for all modules from mid-October, after the first rain, indicating that some of the reduction in efficiencies was due to dust accumulation. When looking at the data after mid-October we can see that the modules on the frames next to the tunnel degraded less than the modules on the tunnel and did therefore not reach their Ts80 lifetimes in the measurement period. This indicates that greenhouse integration accelerated the degradation of the modules. This was mainly attributed to the movement of the polyethylene roof sheeting with wind, thereby causing mechanical stresses on the modules and due to formation of mud at certain spots in between the modules and the polyethylene cover.
Figure 10. Normalised PCE (PCEn) of O1-5 and O7-8 for incident irradiance 600W/m2 throughout the measurement period after the burn in period
compares the daily average Pmax values of modules A2, A6 and A9 in the months of October, November and December in both 2018 (first measurement period) and 2019 (second measurement period). Modules A2, A6 and A9 were installed on the tunnel roof during the first and second measurement periods. shows the reduction in daily average Pmax values from 1.50, 1.64 and 1.32W in 2018 to 0.40, 0.05 and 0.002W in 2019 for modules A2, A6 and A9 respectively for October. From this, we can note that module A9 degraded the most (due to degradation at and around the connector), followed by module A6 and then module A2, as was already seen during the first measurement period (Magadley et al. Citation2020). A similar reduction trend can be seen in November and December, in addition to general reduction in daily average Pmax values from October to December due to reduction in irradiance.
Figure 11. Daily average Pmax for October, November and December in 2018 and 2019 for modules A2, A6 and A9 (Module A9 failed to operate in 2019).
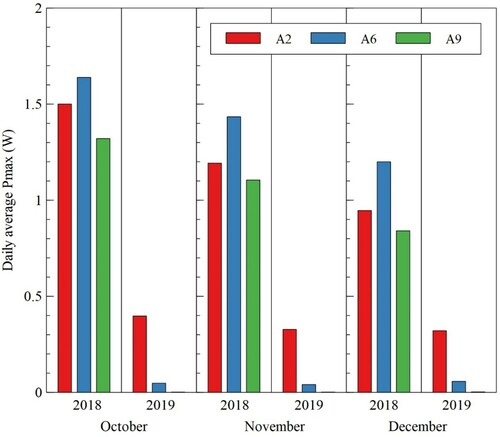
Figure 12. Normalised PCE of (a) modules A2 and O1 on the west side of the roof, (b) modules A6 and O3 on the ridge of the roof and (c) modules A9 and O5 on the east side of the roof for irradiance 600W/m2.
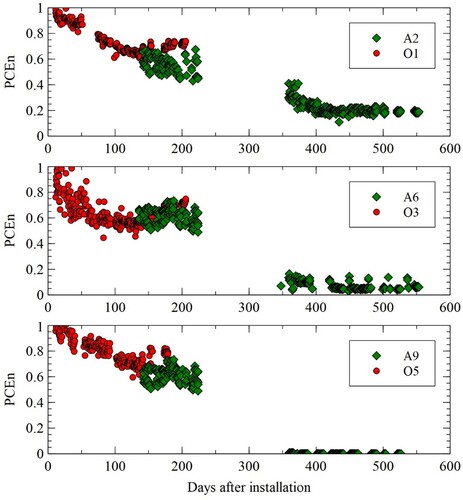
Zhang et al. (Citation2018) and De Amorim Soares et al. (Citation2018) reported long-term outdoor lifetime tests of OPVs, which ranged from only a few weeks to just over two years, with degradation attributed mainly to outdoor environmental changes such as irradiance levels, humidity, ambient temperature levels and ambient diurnal temperature fluctuations (between day and night) being the main degradation factors. Emmott et al. (Citation2016) also found that the OPVs in their study in Rwanda had very short lifetimes of 2.5–5 months, 5–6 times lower than modules kept in the dark or outdoors in a Northern European climate. shows normalised daily maximum efficiencies of modules A2, A6 and A9 (installed on the 30 May 2018) and modules O1, O3 and O5 (installed on the 21 May 2019) at incident irradiance of 600 W/m2. A similar level of degradation trend can be noted for all modules at around 150–220 days after installation, with PCEn of around 0.6 compared to the initial PCE at installation. Module A2 shows an almost linear degradation in PCE until around 420 days after installation, after which PCEn remained constant at around 20% of the initial module PCE. Modules A9 and A6 showed a more severe degradation in PCE in the data 350–550 days after installation. Module A9 had no output during this period and module A6 very little, indicating the influence of some other factors in their degradation and failure of module A9.
The microclimate and crop performance for this experiment were detailed by Friman-Peretz et al. (Citation2020). Crop varieties planted in the experimental (with OPV covering) and control (without OPV covering) polytunnels were ‘Magnolia’ tomatoes in 2018 and ‘Shunit’ tomatoes in 2019. Friman-Peretz et al. (Citation2020) found that covering 37% of the roof area of a greenhouse tunnel (naturally ventilated by side openings) by OPV modules only slightly reduced air temperature and did not have any significant effect on the relative humidity of the air, in comparison to a similar tunnel without OPV modules. The main effect of the modules was irradiance level and distribution within the tunnel. Other significant effects were observed on the leaf temperature which was much lower and leaf area index (LAI) which was higher in the OPV-covered tunnel. Non-significant differences in microclimate, leaf temperature and LAI were observed between the tunnel covered by OPV modules and a control tunnel covered by a shading net with a similar shading percentage. OPV modules did not affect pollen viability of the tomato plants and neither did it affect significantly the total soluble solids and the post-harvest fruit quality. Yet, in comparison to a tunnel without OPV modules, the cumulative yield and average fruit weight were significantly higher (164 kg compared to 121 kg cumulative yield and 102 g compared to 84 g average fruit mass) during the hot summer season. In comparison to a tunnel covered by a shading net, the cumulative yield and average fruit weight were very similar (209 kg cumulative yield and 118 g average fruit mass with OPV cover and 208 kg cumulative yield and 122 g average fruit mass with shading net cover).
4. Conclusions
This paper summarises the results of a study investigating the integration of OPV modules on a greenhouse tunnel roof. The study looked at the outdoor electrical behaviour of OPV modules.
The highest output for all modules was in the first month of the measurement period and then decreased in the consecutive months. This was due to the decrease in incident irradiance and daylight hours, degradation of the OPV modules and an accumulation of dust on the modules.
OPV module efficiencies on the tunnel roof peaked at different times of day, depending on their location on the roof. Their peak efficiencies occurred at times when they were not in direct incident irradiance, i.e. in the morning for modules on the west and in the afternoon for modules on the east side of the roof. When considering the combined effect of the modules across the curved roof, their typical combined output and average PCE were 105Wh and 0.65% on a sunny day and 81Wh and 0.86% on a cloudy day. Due to the modules being distributed across the arch of the tunnel roof from east to west, power was generated throughout most of the day and large peaks around midday were avoided. This is an advantage both for onsite use and for grid connection. Therefore, a study evaluating the performance of roll-based OPV modules and their deployment on the greenhouse roof is desirable.
Both OPV and siPV panel temperature increased with incident irradiance. However, peak OPV module temperature was lower than peak siPV panel temperature. A slight increase in PCE with temperature was found for the OPVs, confirming the positive temperature coefficient of the modules, as listed in the manufacturer’s specification. However, OPV efficiencies remained lower at noon in sunny conditions (with high module temperatures) due to high irradiance at those times.
OPV module T80 was only around 90 h and the module burn-in period was about 15 days (360 h) losing around 36% of its initial PCE. Ts80 lifetimes varied widely between the different modules, ranging from 7 days (165 h) to 94 days (2255 h) (these figures however included the build-up of dust on the modules). When comparing the lifetime data of 2018 with 2019 OPV modules in similar locations of the tunnel roof, a similar level of degradation trend can be noted for all modules at around 150–220 days after installation, with PCEn of around 0.6 compared to the initial PCE at installation. At the end of the measurement period, the modules on the frames next to the tunnel showed lower degradation compared to those on the tunnel and did not reach their Ts80 lifetimes in the measurement period. This indicates that tunnel integration accelerated the degradation of the modules, which was attributed to stresses on the modules caused by the movement of the tunnel sheeting due to wind and therefore the modules.
Understanding the behaviour of the OPVs on a tunnel roof is vital for their successful application in greenhouses. This provides an opportunity to greatly reduce the environmental impact of greenhouse farming and thereby advancing sustainable agriculture. This application area also provides an opportunity of a large commercial market for OPVs, in turn reducing the production cost of the technology, making it economically competitive. Efficiencies of the OPV modules used in this study peaked at around 3%, which was relatively low in comparison to laboratory-scale cell efficiencies of over 17% that were recently reported. Utilising more efficient modules would improve their economic viability, with increased production of renewable electricity.
OPV lifetimes could be improved by integrating the modules inside the greenhouse rather than outside to protect modules from weather (dos Reis Benatto et al. Citation2017) and avoiding modules integration into the the greenhouse cover to reduce movement induced stresses on the modules (Magadley et al. Citation2021). Future research should therefore look at methods of integrating OPVs inside polytunnel greenhouses to prolong their lifetimes. Together with improved OPV module efficiencies, this could offer a viable greenhouse agrivoltaic solution, both economically and environmentally, with minimal impact on crops.
Acknowledgements
The authors wish to thank Mr. Farhad Geoola, Mr. Roman Brikman, Mrs. Shelly Gantz and Mr. Roni Amir for their help in the course of this study.
Disclosure statement
No potential conflict of interest was reported by the author(s).
Additional information
Funding
References
- Berny, S., N. Blouin, A. Distler, H. J. Egelhaaf, M. Krompiec, A. Lohr, O. R. Lozman, et al. 2016. “Solar Trees: First Large-Scale Demonstration of Fully Solution Coated, Semitransparent, Flexible Organic Photovoltaic Modules.” Advanced Science 3 (5): 1500342.
- Bot, G., N. Van de Braak, H. Challa, S. Hemming, T. H. Rieswijk, G. Van Straten, and I. Verlodt. 2005. “The Solar Greenhouse: State of the Art in Energy Saving and Sustainable Energy Supply.” Acta Horticulturae 691 (2): 501.
- Bristow, N., and J. Kettle. 2015. “Outdoor Performance of Organic Photovoltaics: Diurnal Analysis, Dependence on Temperature, Irradiance, and Degradation.” Journal of Renewable and Sustainable Energy 7 (1): 013111.
- Campiotti, C., C. Bibbiani, F. Dondi, M. Scoccianti, and C. Viola. 2011. “Energy Efficiency and Photovoltaic Solar for Greenhouse Agriculture.” Journal of Sustainable Energy 2 (1): 51–56.
- Carlé, J. E., M. Helgesen, O. Hagemann, M. Hösel, I. M. Heckler, E. Bundgaard, S. A. Gevorgyan, et al. 2017. “Overcoming the Scaling Lag for Polymer Solar Cells.” Joule 1 (2): 274–289.
- Chatzisideris, M. D., A. Laurent, G. C. Christoforidis, and F. C. Krebs. 2017. “Cost-competitiveness of Organic Photovoltaics for Electricity Self-Consumption at Residential Buildings: A Comparative Study of Denmark and Greece Under Real Market Conditions.” Applied Energy 208: 471–479.
- Cook, R., and L. Calvin. 2005. Greenhouse Tomatoes Change the Dynamics of the North American Fresh Tomato Industry (No. 3). Washington: US Department of Agriculture, Economic Research Service.
- De Amorim Soares, G., A. Galindo, M. Chabanel, A. Lima, R. Vilaça, and D. Bagnis. 2018. “Lifetime Study on Multiple Organic Photovoltaic Materials through Outdoor Tests.” VII Congresso Brasileiro de Energia Solar – Gramado, April 17–20.
- dos Reis Benatto, G. A., M. Corazza, B. Roth, F. Schütte, M. Rengenstein, S. A. Gevorgyan, and F. C. Krebs. 2017. “Inside or Outside? Linking Outdoor and Indoor Lifetime Tests of ITO-Free Organic Photovoltaic Devices for Greenhouse Applications.” Energy Technology 5 (2): 338–344.
- Emmott, C. J., D. Moia, P. Sandwell, N. Ekins-Daukes, M. Hösel, L. Lukoschek, C. Amarasinghe, F. C. Krebs, and J. Nelson. 2016. “In-situ, Long-Term Operational Stability of Organic Photovoltaics for off-Grid Applications in Africa.” Solar Energy Materials and Solar Cells 149: 284–293.
- Emmott, C. J., J. A. Röhr, M. Campoy-Quiles, T. Kirchartz, A. Urbina, N. J. Ekins-Daukes, and J. Nelson. 2015. “Organic Photovoltaic Greenhouses: A Unique Application for Semi-Transparent PV?” Energy & Environmental Science 8 (4): 1317–1328.
- Friman-Peretz, M., F. Geoola, I. Yehia, S. Ozer, A. Levi, E. Magadley, R. Brikman, et al. 2019. “Testing Organic Photovoltaic Modules for Application as Greenhouse Cover or Shading Element.” Biosystems Engineering 184: 24–36.
- Friman-Peretz, M., S. Ozer, F. Geoola, E. Magadley, I. Yehia, A. Levi, R. Brikman, et al. 2020. “Microclimate and Crop Performance in a Tunnel Greenhouse Shaded by Organic Photovoltaic Modules–Comparison with Conventional Shaded and Unshaded Tunnels.” Biosystems Engineering 197: 12–31.
- Hartner, M., A. Ortner, A. Hiesl, and R. Haas. 2015. “East to West – The Optimal Tilt Angle and Orientation of Photovoltaic Panels from an Electricity System Perspective.” Applied Energy 160: 94–107.
- Hassanien, R. H. E., M. Li, and W. D. Lin. 2016. “Advanced Applications of Solar Energy in Agricultural Greenhouses.” Renewable and Sustainable Energy Reviews 54: 989–1001.
- Hirata, Y., Y. Watanabe, and T. Yachi. 2018, June. “Evaluation of Output of Transparent Organic Photovoltaic Modules on Curved Surfaces Depending on Azimuth.” In 2018 IEEE 7th World Conference on Photovoltaic Energy Conversion (WCPEC) (A Joint Conference of 45th IEEE PVSC, 28th PVSEC & 34th EU PVSEC), 1112–1115. IEEE.
- Krebs, F. C., S. A. Gevorgyan, B. Gholamkhass, S. Holdcroft, C. W. Schlenker, M. E. Thompson, B. C. Thompson, et al. 2009. “A Round Robin Study of Flexible Large-Area Roll-to-Roll Processed Polymer Solar Cell Modules.” Solar Energy Materials and Solar Cells 93 (11): 1968–1977.
- Liu, Y., P. Cheng, T. Li, R. Wang, Y. Li, S. Y. Chang, Y. Zhu, et al. 2019. “Unraveling Sunlight by Transparent Organic Semiconductors Toward Photovoltaic and Photosynthesis.” ACS Nano 13 (2): 1071–1077.
- Magadley, E., R. Kabha, M. Dakka, M. Teitel, M. F. Peretz, M. Kacira, R. Waller, and I. Yehia. 2021. “Organic Photovoltaic Modules Integrated Inside and Outside a Polytunnel Roof.” Renewable Energy 182: 163–171.
- Magadley, E., M. Teitel, M. Friman-Peretz, M. Kacira, and I. Yehia. 2020. “Outdoor Behaviour of Organic Photovoltaics on a Greenhouse Roof.” Sustainable Energy Technologies and Assessments 37: 100641.
- Mulligan, C. J., M. Wilson, G. Bryant, B. Vaughan, X. Zhou, W. J. Belcher, and P. C. Dastoor. 2014. “A Projection of Commercial-Scale Organic Photovoltaic Module Costs.” Solar Energy Materials and Solar Cells 120: 9–17.
- Okada, K., I. Yehia, M. Teitel, and M. Kacira. 2017, August. “Crop Production and Energy Generation in a Greenhouse Integrated with Semi-Transparent Organic Photovoltaic Film.” Acta Horticulturae 1227: 231–240.
- Pérez-Alonso, J., M. Pérez-García, M. Pasamontes-Romera, and A. J. Callejón-Ferre. 2012. “Performance Analysis and Neural Modelling of a Greenhouse Integrated Photovoltaic System.” Renewable and Sustainable Energy Reviews 16 (7): 4675–4685.
- Ravishankar, E., R. E. Booth, C. Saravitz, H. Sederoff, H. W. Ade, and B. T. O’Connor. 2020. “Achieving Net Zero Energy Greenhouses by Integrating Semitransparent Organic Solar Cells.” Joule 4 (2): 490–506.
- Reese, M. O., S. A. Gevorgyan, M. Jorgensen, E. Bundgaard, S. R. Kurtz, D. S. Ginley, D. C. Olson, et al. 2011. “Consensus Stability Testing Protocols for Organic Photovoltaic Materials and Devices.” Solar Energy Materials and Solar Cells 95 (5): 1253–1267.
- Stoichkov, V., T. K. N. Sweet, N. Jenkins, and J. Kettle. 2019. “Studying the Outdoor Performance of Organic Building-Integrated Photovoltaics Laminated to the Cladding of a Building Prototype.” Solar Energy Materials and Solar Cells 191: 356–364.
- Teranaka, K., T. Ikeda, and M. Doi. 2016, September. “Simulation of Seasonal Changes in Radiant Flux Energy in a Greenhouse Installed with Light-Transmitting Organic Photovoltaics.” In II Asian Horticultural Congress 1208, 339–346.
- Wang, T., G. Wu, J. Chen, P. Cui, Z. Chen, Y. Yan, Y. Zhang, et al. 2017. “Integration of Solar Technology to Modern Greenhouse in China: Current Status, Challenges and Prospect.” Renewable and Sustainable Energy Reviews 70: 1178–1188.
- Yano, A., and M. Cossu. 2019. “Energy Sustainable Greenhouse Crop Cultivation Using Photovoltaic Technologies.” Renewable and Sustainable Energy Reviews 109: 116–137.
- Yano, A., A. Furue, M. Kadowaki, T. Tanaka, E. Hiraki, M. Miyamoto, F. Ishizu, and S. Noda. 2009. “Electrical Energy Generated by Photovoltaic Modules Mounted Inside the Roof of a North–South Oriented Greenhouse.” Biosystems Engineering 103 (2): 228–238.
- Yano, A., M. Kadowaki, A. Furue, N. Tamaki, T. Tanaka, E. Hiraki, Y. Kato, F. Ishizu, and S. Noda. 2010. “Shading and Electrical Features of a Photovoltaic Array Mounted Inside the Roof of an East–West Oriented Greenhouse.” Biosystems Engineering 106 (4): 367–377.
- Zhang, Y., I. D. Samuel, T. Wang, and D. G. Lidzey. 2018. “Current Status of Outdoor Lifetime Testing of Organic Photovoltaics.” Advanced Science 5 (8): 1800434.