
 ?Mathematical formulae have been encoded as MathML and are displayed in this HTML version using MathJax in order to improve their display. Uncheck the box to turn MathJax off. This feature requires Javascript. Click on a formula to zoom.
ABSTRACT
Despite the need to ensure that operations at the end of the infrastructure life cycle are carried out in a safe and efficient manner, there is no systematic risk analysis study tailored specifically for renewable energy decommissioning. This paper aims to propose qualitative and quantitative approaches for identifying and prioritising different hazards associated with decommissioning of offshore wind farms. The potential hazards are identified through well-established techniques such as hazard identification (HAZID), fault tree analysis (FTA), event tree analysis (ETA) and risk matrix. Four levels of consequence are considered in the risk analysis process. The results reveal that the lifting and loading are the most safety-critical operations during the decommissioning; hence, they will require specific attention for safety management improvement.
1. Introduction
Offshore wind farm (OWF) decommissioning operations have increased substantially in Europe in the past few years. lists seven offshore wind farms that have been decommissioned until now, including Vindeby, Hooksiel, Lely, Utgrunden I, Yttre Stengrund, Blyth and Beatrice. Except the Vindeby offshore wind farm, the other six wind farms were decommissioned prior to the end of their useful life.
Table 1. Decommissioned offshore wind farms (4C Offshore Citation2020).
With the rapid growth in decommissioning activities, there is a crucial need to develop comprehensive risk management strategies that are tailored to the decommissioning phase of the asset lifecycle. There are several factors affecting the decommissioning operations in OWFs, such as the weight/capacity of the wind turbines, the number of wind turbines on the wind farm, available vessels (for lifting and transportation) and their capacity, weather conditions, etc. Decommissioning is often seen as a reverse of installation. However, because of the age of structures this may be an oversimplification. For instance, lifting points on the wind turbines may have defects, which therefore will cause the structure to have lower strength at later age. The structural integrity must be ascertained through visual inspections as the project plan is being developed. Offshore wind farm decommissioning is not as mature as offshore oil and gas decommissioning. However, in the context of safety management, there are standards and regulations that duty holders in both sectors take into account. Some examples are the International Maritime Organisation (IMO) FSA regulations, Health and Safety Executive (HSE) guidelines, DNVGL recommended practices for location-specific projects, etc. For more information the readers can refer to HSE (Citation2002); Maritime (Citation2017); International Maritime Organisation (Citation2018) and BSI (Citation2018, Citation2019, Citation2020).
The risk management literature has predominantly focused on the early and mid-stages of offshore wind farm development, including design, installation, and operation and maintenance (O&M) phases. A summary of the most important studies on these lifecycle phases is presented below:
Mehdi et al. (Citation2020) proposed a novel real-time, manoeuvring-based dynamic risk assessment method to improve the navigation safety around offshore wind farms during the planning phase. Kahrobaee and Asgarpoor (Citation2011) proposed a risk-based failure analysis method using cost priority numbers (CPN) as the metric to reduce the costs associated with risk of offshore wind turbine failures during the design phase. González, Burgos Payán, and Riquelme Santos (Citation2013) studied decision making under uncertainty (risk) in order for design engineers to select the appropriate transmission system for a large OWF. The authors used Monte Carlo Simulation (MCS) for the selection of the best alternative based on different scenarios and parameters. Kim, Shah, and Kang (Citation2020) used dynamic probabilistic methods (including Bayesian Network and clustering analysis) to quantify the safety risks of OWFs during the installation phase. Kim et al. (Citation2021) studied the risk of collision in offshore wind turbine installation vessels and identified the most critical factors contributing to such risk. Lazakis and Kougioumtzoglou (Citation2019) proposed the use of failure mode, effects and criticality analysis (FMECA), hazard identification (HAZID) and Bayesian Network (BN) for evaluating the risks associated with installation and O&M of OWFs. Gintautas, Sørensen, and Vatne (Citation2016) proposed a risk-based decision support tool to quantify the cost risks associated with assembling, transportation, installation, and O&M of OWFs. Mendoza and Köhler (Citation2019) proposed a BN decision-making framework to find an optimum design for offshore wind turbine monopiles based on the expected consequences of failure. Furthermore, the value of acquiring further site-specific information on the soil characteristics is addressed by means of a value of information analysis. For the O&M phase, Rangel-Ramírez and Sørensen (Citation2012) studied the risk-based inspection planning of OWFs based on estimated probability of fatigue failure. Dai et al. (Citation2013) presented a novel risk analysis framework for the collision of service vessels and offshore wind turbines. The study used fault tree analysis (FTA), event tree analysis (ETA) and BNs for estimating the likelihood of occurrence, and the ANSYS package for consequence assessment. Taflanidis, Loukogeorgaki, and Angelides (Citation2013) proposed a stochastic simulation framework for quantification/evaluation of risks in offshore wind turbines under extreme environmental conditions. A surrogate modelling approach based on moving least squares response surface approximation was also introduced to improve the computational efficiency. Shafiee and Dinmohammadi (Citation2014) proposed an FMECA-based risk assessment method to mitigate the operational risks related to asset failure in offshore wind farms. Zitrou, Bedford, and Walls (Citation2014) proposed a mathematical model for the estimation of early operation risks in OWFs. The authors argued that asset managers can make better informed decisions, reduce risks and improve availability by using their proposed model. Shafiee (Citation2015a) proposed a fuzzy analytic network process (FANP) to determine the most appropriate risk mitigation strategy for OWFs. Adedipe, Shafiee, and Zio (Citation2020) reviewed studies that applied the BNs to risk assessment of OWFs. The authors proposed BNs as a tool to overcome the limitations of classical risk assessment techniques.
Some authors have proposed risk assessment methods for wind turbine asset lifecycle. Adem, Çolak, and Dağdeviren (Citation2018) used SWOT (strengths, weaknesses, opportunities and threats) analysis and Hesitant fuzzy linguistic term set (HFLTS) method for the evaluation of occupational safety risks in lifecycle of wind turbines. The study found out that the construction phase was the fourth most contributor to the risk ranking of lifecycle phases; however, it was not clear if decommissioning was included in the construction phase. Gul, Guneri, and Baskan (Citation2018) presented a risk assessment method for wind turbines during their construction and installation period by combining two fuzzy-based methods: fuzzy analytical hierarchy process (FAH) and fuzzy VIKOR method. The most significant construction and operation risks were seen to be related to seatbelts, falls from height, road accidents, poor emergency response, etc. In another study, Ashrafi, Davoudpour, and Khodakarami (Citation2015) presented a BN model to assess and improve wind energy system reliability. This showed the capacity of BNs in risk level monitoring in continuous time.
Safety should be prioritised in all stages of the asset lifecycle, from planning and construction phase to operation and maintenance (O&M) phase to end of life (EOL) phase. However, the literature review showed that there was no study investigating the risks associated with the EOL and decommissioning phase of OWFs. In an attempt to fill this research gap, our study proposes qualitative and quantitative approaches for identifying and prioritising different health and safety related risks during the decommissioning process of OWFs. It is important for asset managers to mitigate the risks related to the removal of wind turbines, vessel accessibility and operational efficiency, whilst ensuring high safety practices. To achieve this, we identify potential risk-driving factors in offshore wind decommissioning operations as a (de)construction problem, by using semi-quantitative risk assessment approaches including HAZID, FTA, ETA, and risk matrix. Four classes/indices of hazard consequence are considered in the analysis, providing a more granular insight into the possible mitigation/controls required. The specific area of safety management practices that need to be improved in terms of project management, personnel protective equipment, administrative, engineering or mitigation methods are determined. The novelty and contributions of this study to the body of literature and practice are captured in three areas. Firstly, it presents risk assessment for the decommissioning phase of an OWF lifecycle, which was not previously presented in the literature. Secondly, the most critical risk factors (i.e. key risk drivers) in OWF decommissioning are presented for the first time, to the best of the authors’ knowledge and analytical descriptors presented for each risk critical factor. Thirdly, ranking the consequences using four metrics (personnel, asset, economic and environmental) allows for each potential hazard to be estimated in more detail and mitigation/control recommendations be provided in a more structured way. Thus, the findings of this study can substantially support asset managers or owners, regulators, decommissioning project managers and risk researchers towards reducing risks and improving safety in OWFs.
The organisation of this paper is as follows. Section 1 introduces OWF decommissioning trends and some OWF risk management research up to date. Section 2 presents the research background, detailing the decommissioning phases and some tools and techniques for decommissioning risk assessment. Section 3 presents the risk assessment for OWF decommissioning by adopting the HAZID, FTA, ETA and risk matrix techniques. Section 4 presents the results obtained from the assessment: the HAZID result, frequency analysis of the top event, minimal cut set, importance ranking, basic event sensitivity analysis, consequence analysis and risk matrix. It also discusses the most safety-critical tasks during lifting and loading operations and some mitigation measures are proposed. Section 5 concludes the study with proposals for future work in OWF decommissioning safety research.
2. Research background
2.1. Lifecycle phases in offshore wind decommissioning
Decommissioning is defined as the process of planning, removing, transporting, waste management and post-decommissioning of wind turbines and their support structures in order to return the wind farm site to as close to its original condition as before development (Adedipe and Shafiee Citation2021). At each stage of the decommissioning process, risk factors/hazards must be considered to ensure all operations are conducted safety. However, OWF decommissioning has not been a focus in safety engineering research in the wind energy industry to date. Decommissioning has not been a focus in safety engineering research. The main decommissioning activities and their associated risks are described in detail in the following subsections:
2.1.1. Planning and consenting
This stage involves task scheduling (accounting for weather and other environmental conditions), stakeholder consultation, procurement, (sub)contracting, transportation planning, selection and chartering of vessel fleet, obtaining licenses and certifications to execute, developing a lift plan, etc. (Acero et al. Citation2016). During planning, the duty holder is responsible for engaging all relevant regulatory bodies. The lift plan informs decisions on the vessel fleet to be chartered and the number of personnel to be deployed for operations. In Morandeau et al. (Citation2013), the Mermaid software was proposed as an economic risk management tool to reduce the cost-associated risks by improving the project schedule in planning.
2.1.2. Wind turbine preparation
This involves disconnecting wind turbines from the substation/grid, disconnecting the cables, removing hydraulic fluids and other toxic substances from the nacelle, removing the elevator from the tower, removing excess marine growth, fitting/welding lift points on the turbine if required (Topham and McMillan Citation2017; Adedipe and Shafiee Citation2021). This is a repetitive activity for all the wind turbines on site. The risks associated with this activity involve drop from height, asphyxiation due to confinement for extended periods, etc.
2.1.3. Lifting and loading (including unbolting and cutting of wind turbines and foundations)
This involves unbolting, cutting, disassembly, lifting and loading onto the transportation vessel, and vessel repositioning. Operation durations depend on factors including lift configuration, environmental conditions during operations, wind farm size, and the number of vessels. Vessels that may be used include jack-up barges, floating cranes, shear-leg crane barges, heavy lift vessels (HLV), installation vessels, etc. (Zhao et al. Citation2018). Typical factors involved in crane selection are: height of lift, reach, weight of components, safe working load (SWL) capacity of crane, wind turbine rating, maximum lift capacity of crane, method of nacelle removal, sea states, environmental conditions, etc. Ruud and Mikkelsen (Citation2008) presented the steps involved in a generic offshore lifting operation using cranes, including influencing factors, risk levels and mitigation measures. Safety factors during lifting operations include: nonexceedance of SWL capacity, adequate prior maintenance and certification, using of appropriate attachment tools, etc. Safety factors during loading operations are related to the loading/arrangement layout, fastening of components, deck loading capacity, and vessel stability/ballasting. The support structure/foundation lift has similar risk factors as the wind turbines removal except the height related factors. For further reading, the readers can refer to Seyr and Muskulus (Citation2016) and Hinzmann, Stein, and Gattermann (Citation2019).
2.1.4. Transportation
After lifting, the components are loaded onto the intended transport vessel based on the transportation schedule and charter plans and pre-planned deck layout. They are transported to shore, and the vessel returns to the site. Goerlandt and Montewka (Citation2015) presented a review of risk management practices in the maritime transportation industry. The decommissioning fleet may be made up of an installation vessel, support barges/vessels and tow tugs. Transport vessels may be subject to mechanical or structural faults or failures, as reported in Abdussamie et al. (Citation2018). The authors made a case for relying on qualitative risk evaluations (HAZID and fuzzy risk assessment) because of data sparsity with four consequence classes: personnel, asset (vessel and modules), economic and environment. Transportation alternatives may include the use of one removal vessel (WTIV) or multi-vessel alternative (Topham and McMillan Citation2017).
2.1.5. Waste management
The removed components transported to port/shore must be disposed of in the most practically sustainable manner and according to local and international waste management regulations like the EU Landfill Directive (1993/31/EC) (United Nations Citation1982; OSPAR Commission Citation2006; Cherrington et al. Citation2012). The different waste management methods include recycling, reuse, energy regeneration, scrapping, etc. A number of deepwater ports are used for decommissioning like the Port of Grenaa in Denmark (Port of Grenaa Citation2020).
2.2. Risk assessment tools and techniques for offshore wind farm decommissioning
According to ISO 31000, risk is defined as the ‘effect of uncertainty on objectives, expressed in terms of potential events, likelihood and consequences’ (BSI Citation2018). Risk assessment is used in decision-support to ensure safety of operations. Mathematically, the risk can be expressed by Equation (1) (Rahman et al. Citation2020).
(1)
(1) where
and
represent the probability of occurrence and the consequence of the ith hazardous event, respectively. The probability of occurrence may be obtained from different sources including historical data, expert judgement, or computerised modelling (Kim et al. Citation2021; Friis-Hansen and Simonsen Citation2002; Li, Meng, and Qu Citation2012). Most OWF decommissioning risk management practices are adopted from adjacent industries, particularly the offshore oil and gas industry. Risk management involves identification and control of hazards that may hamper operations. Safety is not the absence of risks; it is rather a state whereby as little as possible can go wrong (Aven, Vinnem, and Wiencke Citation2007; Shafiee Citation2015b). Safety management in construction is studied using different safety indicators like lost time injury frequencies (LTIF) and total recordable injury rates (TRIR) in Winge, Albrechtsen, and Arnesen (Citation2019). These indicators also have been adopted in the offshore wind energy industry as reported in G+ Global Offshore Wind Health and Safety Organisation (Citation2020). Some commonly used tools/techniques are described below:
2.2.1. HAZID
HAZID (hazard identification) is a tabular, qualitative technique used to identify potential operational hazards/deviations and their possible causes and consequences. A HAZID worksheet lists the different hazards that can occur during operations in an observed system. HAZID can be carried out using workshops, interviews, surveys, etc. During HAZID workshops all or parts of the operation or equipment under control (EUC) can be considered.
2.2.2. Fault tree analysis (FTA)
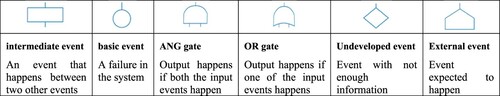
FTA is an established diagrammatic technique which uses a top-down (deductive) method to identify, model and analyse the relationship between different causal events that can lead to an unwanted system/operational top event. It is used for qualitative or quantitative assessments of the top event based on the use of events (intermediate and basic) and gates. Events are operational/system occurrences that can lead to an unwanted fault/failure during operations. Gates are the symbols that show how the events develop and their relationship to one another. Events are connected by either AND (resulting event occurs only if all input events occur) or OR gates (resulting event occurs if any input event occurs). Some symbols are represented in . Readers can refer to Shafiee et al. (Citation2019) for further reading .
Figure 1. FTA symbols.
2.2.3. Event tree analysis (ETA)
ETA is a bottom-up (inductive) diagrammatic technique that uses reasoning to show escalation/development of a potential unwanted initiating incident/event and different possible outcomes. It shows the safety/hazard promoting factors at each level of the event tree with each level developing into two branches (one for success and one for failure) for different potential outcomes. The consequences of operational (or system) failure depend on the safety gates at each stage of the tree development. In order to determine an event sequence, the ETA can be performed or a functional block diagram to be used (Aneziris et al. Citation2008).
2.2.4. Risk matrix
A risk matrix is a technique used to categorise risks into different levels based on the combined likelihood and consequence rankings in order to rate the significance for prioritising mitigation/control actions. It is made up of two axes, with the likelihood on one axis and the consequence on the other axis. Each cell represents a risk rank or rating which is determined for every potential event being assessed. It is used to rate, evaluate and communicate the magnitude of different risks and determine how acceptable they are in order to set risk management priorities. The likelihood or consequence rating can be of three, four or five levels, making a 3×3, 4×4 or 5×5 matrix, respectively (BSI Citation2019b).
3. Methodology
In this section, semi-quantitative risk analysis approaches using the HAZID analysis, FTA and ETA methods and risk matrix are developed for the OWF decommissioning activities in order to prioritise the required risk control/mitigation measures or barriers. The approach chosen for risk assessment in this study is advantageous as it uses well-established methods to provide a good baseline assessment of OWF decommissioning risks. Our methodology is represented by a flowchart given in Appendix A.
3.1. HAZID for offshore wind farm decommissioning
The hazards inherent within the decommissioning activities were identified using the HAZID technique. A HAZID study was conducted to obtain different potential hazards or incidents involved in the decommissioning activities. In the study, hazards were identified from consultation with experts and they were ranked based on their potential to disrupt decommissioning operations. During decommissioning activities, the safety of operations depends on factors such as vessel safety, cranes and other lifting equipment remaining in good working condition, personnel safety, and compliance with regulations.
3.2 Fault tree analysis (FTA) - estimation of likelihood
In this study, the likelihood of occurrence for the top event is estimated for lifting and loading operations to determine potential to safety threats. The top event (TE) during lifting and loading operations is ‘suspended/halted lifting and loading operations’. The FTA focuses on two types of failures related to lifting and loading activities, including: operational faults/failure and equipment faults/failure. The fault tree diagram (FTD) includes the probability of occurrence of the basic events/causes that could lead to the top event. The intermediate events investigated are collision, vessel damage and crane failure as illustrated in . FTA can also be used to present the likelihood of occurrence of each of the basic events and the minimal cut sets (MCS), which are the smallest combination of events that can lead to the top event.
Figure 2. Fault tree diagram for top event (suspended/failed decommissioning operations).
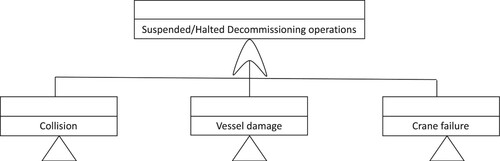
The events in are connected by an OR gate because any of the intermediate events can result in the top event. There are a host of FTA tools available in the market, including PTC Windchill FTA (formerly Relex FTA), ReliaSoft BlockSim, Isograph FaultTree+, etc. (Baklouti et al. Citation2017). The data for constructing the FTDs can be collated from different literature sources and expert judgements. The rankings for the likelihood of occurrence are given in .
Table 2. The rankings for the likelihood of occurrence.
3.2.1. Collision/contact
Collision hazards are a significant concern for the offshore wind energy industry. Collision is often caused by three distinct factors as reported in Antão and Guedes Soares (Citation2006) and Dai et al. (Citation2013). These are: failure in navigation operations, manoeuvring operations and/or hazard detectability. These basic events and their combination are important to understand in order to make adequate provision for mitigation and control measures. Data on offshore wind collision is available in databases like: G+ Global Offshore Wind Health and Safety Organisation (Citation2020) and Marine Accident Investigation Branch (Citation2020). In , the collision intermediate event is further developed based on navigation, manoeuvring and detection failures.
Figure 3. Fault tree diagram for collision event (intermediate event).
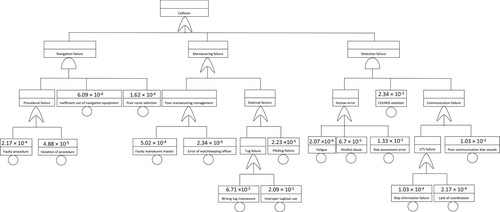
Navigation failure is caused by a combination of procedural issues, equipment failures and decision-making errors. Manoeuvring failure is due to human-related errors and equipment failures, and detection failure is most often caused by human errors. Because OWF decommissioning and installation vessel data is not yet as granular as tanker vessels, the data used are taken from collision accident estimations of tankers in Uğurlu et al. (Citation2015). The frequency estimates are considered suitable because the probability of failure estimation can be representative for heavy lift/jack up/transportation vessels, which have similar navigation and manoeuvring basic events and thus, applicable only for frequency estimation in collision incidents. The consequence estimation is incomparable, which is not used in this study.
3.2.2. Vessel damage
Vessel operation management is critical for decommissioning and can be costly, especially for operations involving large modules. In this study, vessel damage was considered in place of grounding because there is limited possibility of damage by grounding during lifting and loading operations offshore. Marine vessel damage can be caused by mechanical, structural or human-related failures, and may lead to dynamic changes in vessel response. The fault tree for vessel damage was developed, excluding events that could lead to collision or grounding. Vessel damage can be caused by events like improper cuts, poor payload estimation, an imbalance in the forces acting on the vessel, etc. Failure rate values of the basic events were obtained from Babaleye, Khorasanchi, and Kurt (Citation2018) and Rahman et al. (Citation2020) as shown in .
Figure 4. Fault tree diagram for vessel damage event (intermediate event).
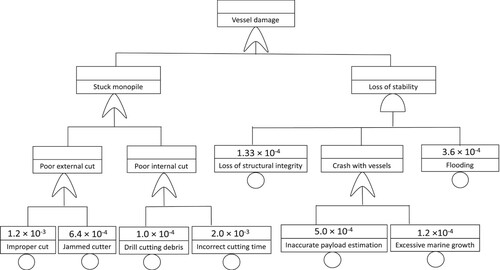
The operation limits for a lifting vessel are set to ensure that the vessels remain safe (DNVGL Citation2015; Luo-Theilen and Rung Citation2019). Structural integrity, cutting efficiency, jack up leg/seabed interaction, payload estimation, sea states, etc. are assessed, but failures can still occur if a combination of events takes place. Clean cuts are required to avoid potential operational risks; thus, appropriate severance methods must be selected (Li, Gao, and Moan Citation2016; Kaiser and Pulsipher Citation2004). Vessel damage can result in sinking or capsize if safety barriers are ineffective or if there is a slow response to incidents that eventually escalate.
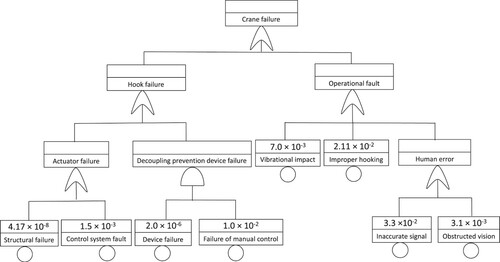
3.2.3. Crane failure
The crane is the most critical equipment in the lifting operations. Crane overloading must be prevented with due consideration of SWL, load behaviour during all stages of the lift, lifting reach/angles/heights, and the dynamic response of the vessel and crane system in the real time environment. Crane operability must be certified by an independent body such as DNVGL (DNVGL Citation2015), however, the duty holders are responsible for ensuring that operational plans and activities are prudent (DNVGL Citation2017). shows the fault tree of the crane failure event and the basic events and their failure rate values obtained from Bai, Sun, and Sun (Citation2012) and Sun et al. (Citation2012). Any of the basic events represented can lead to the unexpected motions during lifting and loading, excluding bad weather conditions. There is also a potential for self-induced vibrations like galloping vibrations caused by winds acting on the crane (Klinger Citation2014) which may be more likely in the offshore operating environment.
Figure 5. Fault tree diagram for crane failure event (intermediate event).
3.3. Consequence analysis – event tree analysis
Multi-dimensional consequences of the hazards were identified for the events presented for collision, vessel damage and crane failure operational deviations/hazards. The four consequence classes used are offshore personnel safety, asset losses, economic, and environmental consequences. Safety/hazard promoting factors can be evaluated in the event tree to determine where operational/technological improvements may be needed in decommissioning operations. The economic consequence is based on lost days, contingency costs and schedule overruns (Jacinto and Silva Citation2010). Consequence data can be obtained from incident reports or computer modelling (finite element modelling).
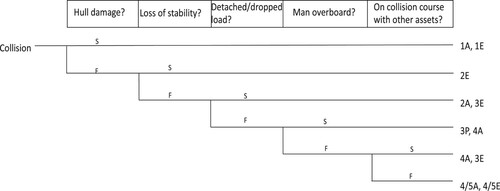
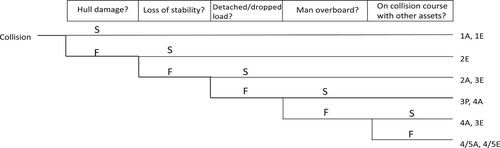
3.3.1. Event tree for collision/contact
The event tree for the collision event is presented in . The safety/hazard critical factors, including vessel hull damage, vessel stability, detached or dropped load, man overboard and vessel on collision course with another asset are seen above the tree, represented by each tree branch for which failures (F) result in further development of the tree and success (S) results in the expression of the estimated consequence. Collision potential will vary from site to site, largely depending on the wind farm layout. Influencing factors of collision risk include: number of vessels (removal and transportation), number of wind turbines, etc. The risk assessment can further be investigated for the type of collision: vessel-vessel collision (V-V) or vessel-turbine collision (V-T). With more than one consequence class for each branch, the higher-ranked consequence was used to classify the chain of events in each tree branch. For example, hull damage and loss of vessel stability will cause economic and asset-related risks, higher costs in future insurance premiums, remedial action and repair costs - (ranking: 2).
Figure 6. Collision event tree.
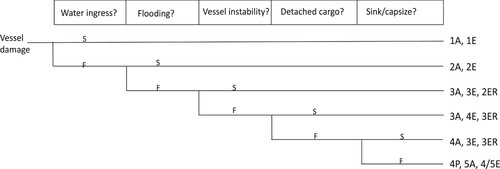
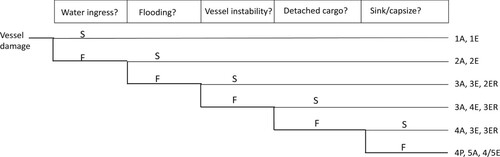
3.3.2. Event tree for vessel damage
The event tree for the vessel damage presents the possible consequences as shown in . The safety/hazard promoting factors are water ingress, flooding, vessel instability, detached cargo, and sink/capsize. If the vessel loses stability, it can lead to detached loads and compound into other failures/incidents. The vessel may be damaged due to swinging/dropped loads or loss of stability. The liability of the removal vessel damage rests with the agreed party within the contract. Regardless of liability, personnel safety must be assured throughout the decommissioning process. If there is vessel/hull damage with uncontrollable water ingress that leads to flooding, it may cause extensive damages to the vessel and other equipment on board. This will be classified under damage to multiple assets but with no damage to the environment resulting in higher financial/economic liabilities (ranking: 2). If the vessel sinks/capsizes, this will lead to loss of asset and potentially multiple personnel injuries (ranking: 5).
Figure 7. Vessel damage event tree.
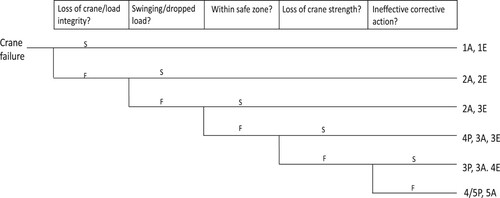
3.3.3. Event tree crane failure
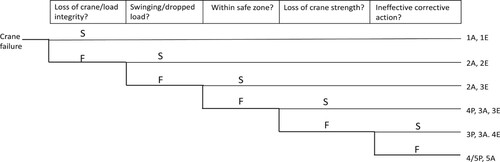
Crane failure includes the failures of the crane operations or the load being lifted. The failure of the crane can have minimal or catastrophic consequences, which will lead to vessel stability compromise depending on the failure extent. It is important that inspections are carried out at set intervals during lifting operations and peculiar project/site factors are taken into consideration. The event tree is presented in , where the safety/hazard critical factors are loss of crane/load integrity (the load may lose integrity at the lift points), swinging/dropped load, safe/dangerous zone, loss of structural strength because of the swinging load, and ineffective remedial/corrective action. If crane strength is compromised, this will lead to damage to a single or multiple equipment and moderate economic impact (ranking: 3). If the swinging/dropped load falls within a dangerous zone, this will result in multiple personnel injuries and extensive damage without the need for extensive remedial action (ranking: 4).
Figure 8. Crane failure event tree.
Overall, the event trees above consider possible scenarios that could occur if collision, vessel damage and crane failure take place. These different scenarios and their corresponding safety/hazard critical factors and barrier effectiveness may be further developed using simulations to predict the outcomes presented in order to quantify the consequences. The types of simulations that can be conducted are damage extent, survivability, cargo pollution modelling, and structural response modelling for the different potential outcomes.
3.4. Risk matrix
In this study, the risk-matrix approach is used in addition to an FTA and ETA for decommissioning risk ranking. The risk matrix can be used to estimate the magnitude of the risk by considering a single consequence or using multiple consequence classes as shown in Appendix B. In order to estimate the offshore wind farm decommissioning risks, a risk matrix is used to rank the hazards associated with lifting and loading operations and the potential hazardous incidents.
4. Results and discussion
The results obtained from the HAZID, FTA (including the results for minimal cut sets), ETA, and risk matrix methods are presented in the following subsections.
4.1. HAZID table
Some guidewords such as delay, dropped object, drift, impact, operational fault, overloading, spills, etc. are used to3 identify the associated deviations or hazards. The results of the HAZID analysis for operations involved in an offshore wind turbine decommissioning project are reported in Appendix C.
4.2. Frequency analysis - top event FTA
The top event (suspended/halted decommissioning operations) has a probability of failure of 6.9 × 10⁻² if the same level of inspections and modifications are used in maintaining reliability/safety of equipment and overall operations. The top three most frequently occurring basic events include: inaccurate signal, improper hooking (during crane activities) and failure of manual control. The least occurring events are crane structural failure, decoupling prevention device failure and improper tugboat use. Of all these basic events, crane-related fault/failure events are the most likely events to occur. Thus, this study suggests that crane-related events are the area of focus for contractors, asset managers and regulators. Existing best practices and guidelines are in place to prevent/control any mishaps/risks. The rankings for the likelihood of lifting and loading incidents are given in .
Table 3. Frequency ranking of lifting and loading incidents.
4.2.1. Collision event frequency of occurrence
The probability of occurrence of collision during decommissioning was estimated to be 8.46 × 10⁻⁴. According to the fault tree, the three highest contributing events to collision risk include: COLREG violation, risk assessment error and poor communication between vessels, which have the probabilities of occurrence of 2.34 × 10⁻³, 1.33 × 10⁻³ and 1.03 × 10⁻³, respectively. All these probabilities are based on detection failure (E10 – E16) events, which is hinged on human errors. Reliable and consistent communication between removal vessels is critical, especially if more than one vessel is to operate on site.
The estimated collision rate in this study assumes activity durations are impacted by decommissioning vessels needing to be repeatedly repositioned by each wind turbine for removal. The vessels will return to site and be positioned, and this cycle of operations will continue until all modules have been removed and transported. It is uncertain, however, if head-on collision or manoeuvring collision would have a higher probability of occurrence. This study does not classify the collision type. We anticipated that this would depend on the wind farm size, wind farm layout and number of vessels used for operations. More data can be collected from operators for analysis as decommissioning operations grow over time.
4.2.2. Vessel damage frequency of occurrence
The frequency assessment yielded a vessel damage probability of 3.94 × 10⁻³. The basic events with the highest probability of failure is differential sticking of the monopile during foundation removal operations. This is mostly influenced by the cutting operations as shown in . There are different cutting techniques, and the selection depends on different criteria including type of foundation, thickness of the material, etc. In an attempt to lower the duration of cutting operations, different methods may be preferred over others subject to operator request. The vessel stability also depends on monitoring of different lifting parameters. If the vessel is damaged by flooded members, it can lead to catastrophic vessel sinking or capsize.
4.2.3. Crane failure frequency of occurrence
The probability of occurrence of crane failure intermediate event was estimated to be 6.42 × 10⁻². From the FTA, it is observed that crane failure or crane related events are mostly due to operational or mechanical failures. In the FTA, inaccuracy in signal, improper hooking of the object and failure of manual control are the three most contributing factors to crane failure. The potential for mechanical faults supports the case for secondary back-up controls fitted on the crane. This study shows that a hazard such as improper hooking may result in falling/swinging loads. Operational safety thus depends on adherence to proper operating procedures as stated in the guidelines, standards and recommended practices.
4.3. FTA outcome - minimal cut set (MCS)
The minimal cut sets were determined using Boolean logic expressions. The probability of a collision event (intermediate event IE1) was estimated to be 8.46 × 10⁻⁴. The probability of a vessel damage event (intermediate event IE2) was estimated to be 3.94 × 10⁻³. The probability of crane failure event (intermediate event IE3) was estimated to be 6.42 × 10⁻². The probability of the top event is estimated to be 6.89 × 10⁻², which presents a baseline case. When calculating the probability of occurrence of top event, the minimal cut set (MCS) is identified. The MCS is presented below.
where TE is the top event and
are the intermediate events (1 = collision, 2 = vessel damage, 3 = crane failure).
There are 13 first order MCSs and 15 third order MCSs as given in Appendix D. The first order events represent the most critical events for which the top event can occur if only one of them occurs. The third order events are the smallest combination of events that can occur if three of the events occur at the same time.
4.4. Importance ranking (risk critical factors) and sensitivity analysis
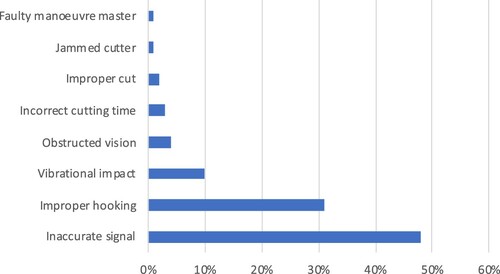
To improve the decommissioning safety, the importance ranking is calculated to determine the basic events contributing the most to a failed/suspended decommissioning operation. This identified where operations need to be improved with respect to the operating system, equipment/vessel and personnel-related decision making. Each activity was analysed to observe how much impact a basic event would have on the overall top event (TE) if that basic event was eliminated. For example, the basic event, improper hooking, is set to zero to show the impact it has on the fault tree while the value of probability of occurrence for all other basic events remain the same. The top event is calculated subsequently for each basic event set to zero. The output is presented in , which shows the importance ranking of the basic events, excluding the events that reflected no significant impact. Inaccurate signal, improper hooking and vibrational effects have the highest impact on the top event with 48%, 31% and 10% changes, respectively. Based on this analysis, the crane failure basic events are the most likely to have the highest impact on a failed/halted decommissioning operation. Thus, mitigation and control efforts should make cranes a priority.
Figure 9. Importance ranking of basic events.
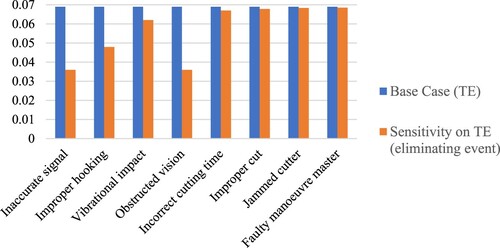
4.5. Sensitivity analysis
In , a sensitivity analysis is conducted to assess the impact of changes in basic events on the top event frequency. To compare the sensitivity of different basic events, each event is set to zero, one after the other, while maintaining the probability of failure values for other basic events. It was observed that inaccurate signal, obstructed vision, improper hooking and vibrational effects had the highest sensitivity on the top event when eliminated. This implies that the top event will be most sensitive to these events. This means that if those events can be eliminated, then the likelihood of failure of the decommissioning operations will also be reduced. This will be compared against the overall risk ranking determined by the risk matrix.
Figure 10. Sensitivity of basic events on top event.
4.6. Consequence analysis – outcome of ETA
The metrics of each consequence are expressed based on the values reported in Appendix B.
4.6.1. Collision/contact consequence scenario
In if the collision event leads to a minor hull damage, the consequence will be asset damage and economic impact from financial loss/increase insurance premium or interest (severity ranking of 1). In scenario B where there is loss of stability and dropped/swinging load, this may lead to personnel injury and major damage/loss to the asset(s), and recovery of the dropped load; thus, increasing financial cost. There are costs associated with contingencies of these nature; however, more than the amount allocated may be required.
Figure 11. Collision consequence scenario 2.
4.6.2. Vessel damage consequence scenario
In for the vessel damage hazard, there is only water ingress without flooding or damage to other equipment. This has a consequence of minor damage to one asset and minimum financial loss/premium/interest. In scenario B, after the vessel losses its stability, the cargo is detached, and the vessel may capsize/sink. Depending on the evacuation effectiveness, there might be multiple personnel injuries or fatalities, extensive damage/loss of asset, and maximum financial loss. The environmental impact will depend on the hydraulic spill into the sea from the nacelle module. Scenario B shows the event path for the worst-case scenario.
Figure 12. Vessel damage consequence scenario 3.
4.6.3. Crane failure consequence scenario
During lifting and loading operations, the impact of crane failure on personnel safety is determined based on the zone of occurrence (if it involves swinging/dropped loads), availability of first aid/medical care at the time of the incident. Economic impacts will be based on the exposure of the contractors or duty holders based on the contract liability clause extent of schedule delays. The social impacts depend on the contractors or duty holder’s track record in safety; the impact on the asset is defined by the extent of the damage. The environmental damage will be dependent on how thoroughly the wind turbines were prepared for removal in the event of a dropped object.
As can be seen in , in the scenario A of the crane failure, if there is loss of crane/load integrity without further damage, this will lead to minor/major impact on the asset and minimum financial loss/premium/interest, increased contingency cost, and increased schedule delay cost. In scenario B, there may be multiple injuries/fatalities, extensive asset damage and extensive financial loss/premium/interest.
Figure 13. Crane failure consequence scenario 3.
4.7. Risk matrix for decommissioning operations
The risk matrix shows the risk values for the three intermediate incidents (collision, vessel damage and crane failure). For the incidents studied, the minimum, most likely and maximum consequence scenarios are determined. The risk values are a function of the probability of occurrence and expected consequence given the safety/hazard promoting factors. The risks associated with each hazard are obtained for different consequence ranking scenarios with different outcomes. For each potential incident, frequency ranks are presented, and the different safety/hazard promoting factors were used to present the four consequence classes (indices) for each event.
The results of the risk matrix for decommissioning operations are given in Appendix E. From the results, the crane failure has the highest level of risk followed by vessel damage and collision/contact, respectively. Also, the asset and economic impacts are the highest risk classes overall, followed by personnel safety and environmental risks, respectively. The asset and economic risks are closely related. Personnel risk is seen to be unacceptable if crane failure occurred with a dropped object within a dangerous zone, as the punitive damages incurred may be high (medical bills, fatalities, and compensation). Long term, insurance premiums may also increase.
4.8. The most safety-critical activities in lifting and loading operations
The most safety critical activities during lifting and loading operations are found to be those associated with crane operations. This is consistent with construction project conventions where crane safety is the most important during operations requiring lifting of heavy modules and even more so for offshore marine decommissioning projects. The highest risk drivers identified are related to crane operations such as weight of component in relation to the crane capacity and number of crane inspections per set of lifts. Crane vessels will have been tested for different loads, environmental and vessel response constraints. There is limited research, however, on the operability constraints related to the different types of lifts within wind farm decommissioning projects. In terms of the number of crane inspections per set of lifts, there is a more stringent process required by certification organisations who will usually have representatives present to approve of lifting operations after inspections are conducted. We propose that safety can be improved by lowering the number of lifts per wind turbine, considering crane lifting capacity and vessel type.
4.9. Mitigation and control
Reducing the risks involves reducing the likelihood of occurrence of incidents and/or reducing the impact of the incident to as low as reasonably practicable (ALARP). To prevent hazards from escalating, barriers are put in place. Records of the barrier/control effectiveness should be kept. Barrier effectiveness can be monitored using maintenance records and inspections, which are closely monitored by regulators. Investment in improvement of barrier effectiveness may not lower the frequency of failures of the critical events. Therefore, the need for improvement must be considered using cost–benefit or cost-effectiveness analysis as the conventional cost–benefit approach may not always provide the most suitable approach (Aven, Vinnem, and Wiencke Citation2007). Risk control options may be geared towards reducing the likelihood of occurrence and/or consequence of an event or the manner in which the risk burden is shared amongst all parties involved in the decommissioning project (BSI Citation2019a). Mitigation and control measures will be focused to reduce the likelihood of occurrence or magnitude of consequence.
There are several mitigation and control approaches to prevent or safeguard against collision risk as reported in Kongsvik, Haavik, and Gjøsund (Citation2014). Mitigation measures/barriers to reduce the impact of hazardous incidents include: (i) reduction of the level of impact on personnel (ii) ensuring high-quality inspection of the lifting equipment to ensure all standards are met (iii) reduction of marine activity duration (e.g. by using more efficient or robot-assisted technologies) (iv) reduction of human-related errors by improved personnel training, modification of tasks or provision of the right personal protective equipment (PPE). Operational research is usually improved by performing human reliability analysis (HRA) (Rahman et al. Citation2020) and because decommissioning operations are made up of man-machine tasks, human errors are bound to occur or may be caused by poor responses to mechanical errors. When an accident occurs, an investigation will be conducted by an independent body. It is recommended that investigation reports also be made publicly available. Some mitigation and control measures are proposed in for personnel safety, asset safety, procedures/regulations to be put in place, lifting configuration, contingency planning, reporting and investigation. If crane failure occurs, barriers should be put in place to control swinging/dropped loads and prevent further escalations. To improve the safety of crane activities, crane-less and driver-less technology can be explored for decommissioning (Choudhary and Howes-Roberts Citation2018).
Table 4. Mitigation and control measures for the intermediate events.
Based on the contributions of this study, identifying the most safety critical factors can improve asset management decision making if the risks are prioritised in this manner. In addition, ranking the consequences and thus risk, allows for more targeted approach in risk management, where the risk treatment (mitigation/control) can be focused on reducing the most critical consequences (personnel, asset, economic or environment) for each hazard type.
5. Conclusion and future work
Decommissioning of offshore wind infrastructure requires a risk-based decision-making approach through which all potential hazards can be identified and assessed to mitigate risk exposure. An improved understanding of the risk-critical activities allows regulators and asset managers and owners improve safety operations in offshore wind decommissioning. Based on the G+ Global Offshore Wind Health and Safety Organisation (Citation2020) report, the potential hazards throughout offshore wind decommissioning activities were found to be higher during the lifting and loading operations. Thus, this study focused on lifting and loading operations because operational safety depends on vessels, cranes and other lifting equipment to be in good working condition. In addition, personnel safety must be ensured whilst complying with regulations, standards and recommended practices.
The risk assessments of offshore wind farm decommissioning in this paper were conducted using well-established methodologies, including HAZID, FTA, ETA and risk matrix. The HAZID was conducted for all the key decommissioning tasks. The HAZID paints a picture of potential hazards involved in different activities but is not exhaustive. The risks associated with lifting and loading operations were further assessed with FTA and ETA techniques for collision/contact, vessel damage (caused by loss of stability and vessel response) and crane failure incidents/hazards. The corresponding ETA was conducted to estimate the impact of all possible outcomes on decommissioning operations. A risk matrix was further used to estimate the level of risk of all potential hazards/incidents.
The crane events were considered to have the highest risk ranking followed by vessel damage and collision, with ratings as high as 20, 15 and 15, respectively. The crane events were caused by navigation faults, manoeuvring failures, hazard detection failures and human errors. The vessel damage, on the other hand, was primarily due to vessel stability concerns and vessel response. The crane failure was caused by mechanical failures and human errors. The ETA was used to estimate the consequences of each potential incident in four classes, including: personnel, asset (vessel and wind turbines), economic and environmental, and possible scenarios were presented from the least to the highest possible consequence. The risk ranking was presented for the different scenarios. In addition, mitigation and control measures were proposed for personnel safety, asset safety, procedures/regulations to be put in place, lifting configuration, contingency planning, reporting and investigation to reduce the identified loads to as low as reasonably practicable (ALARP). The key risk drivers were identified using importance measures. Based on the analysis, the most significant contributing events to the top event included: inaccurate signal, improper hooking and vibrational impact. If industrial HAZID records were to become public, it would be beneficial not just for the offshore wind industry but also for the other sectors in the supply chain.
Risk assessment is paramount to safe decommissioning and four classical risk assessment methods were applied to a baseline offshore wind farm case to identify critical safety factors in decommissioning. However, because these classical methods are limited (due to their static nature and the limited knowledge about OWF decommissioning to date), uncertainties have to be modelled; both as a means to validate and update the risk assessment parameters when new information is obtained. Further investigation into risk can be carried out with the use of methods like advanced fault tree models, probabilistic methods like fuzzy theory and BN models. In addition, accounting for the duration of operations in modelling the risks will offer better insight into the impact that the duration of each activity has on decommissioning safety. Beyond decommissioning risks presented in this study, suggestions for future work include: firstly, identification of safety barrier improvements required for decommissioning; secondly, research into risk-based methods for optimal lifting configuration, considering the risks and potential financial risks related to decommissioning operations; thirdly, transmission assets risk (like cables, piles or foundations removed or left-in-place) can be reviewed and areas for safety improvements proposed like design improvements related to lifting points or lifting equipment like cranes. Lastly, organisational risks related to decommissioning capacity/capability can be assessed.
Disclosure statement
No potential conflict of interest was reported by the author(s).
References
- Abdussamie, N., A. Zaghwan, M. Daboos, I. Elferjani, A. Mehanna, and W. Su. 2018. “Operational Risk Assessment of Offshore Transport Barges.” Ocean Engineering 156: 333–346.
- Acero, W. G., L. Li, Z. Gao, and T. Moan. 2016. “Methodology for Assessment of the Operational Limits and Operability of Marine Operations.” Ocean Engineering 125: 308–327.
- Adedipe, T., and M. Shafiee. 2021. “An Economic Analysis Model for Decommissioning of Offshore Wind Farms Using a Cost Breakdown Structure.” The International Journal of Life Cycle Assessment 26: 344–370. doi:10.1007/s11367-020-01793-x.
- Adedipe, T., M. Shafiee, and E. Zio. 2020. “Bayesian Network Modelling for the Wind Energy Industry: An Overview.” Reliability Engineering and System Safety 202: 107053.
- Adem, A., A. Çolak, and M. Dağdeviren. 2018. “An Integrated Model Using SWOT Analysis and Hesitant Fuzzy Linguistic Term set for Evaluation Occupational Safety Risks in Life Cycle of Wind Turbine.” Safety Science 106: 184–190.
- Aneziris, O. N., I. A. Papazoglou, M. L. Mud, M. Damen, J. Kuiper, H. Baksteen, B. J. Ale, et al. 2008. “Towards Risk Assessment for Crane Activities.” Safety Science 46 (6): 872–884.
- Antão, P., and C. Guedes Soares. 2006. “Fault-tree Models of Accident Scenarios of RoPax Vessels.” International Journal of Automation and Computing 3 (2): 107–116.
- Ashrafi, M., H. Davoudpour, and V. Khodakarami. 2015. “Risk Assessment of Wind Turbines: Transition from Pure Mechanistic Paradigm to Modern Complexity Paradigm.” Renewable & Sustainable Energy Reviews 51: 347–355.
- Aven, T., J. E. Vinnem, and H. S. Wiencke. 2007. “A Decision Framework for Risk Management, with Application to the Offshore oil and gas Industry.” Reliability Engineering and System Safety 92 (4): 433–448.
- Babaleye, A., M. Khorasanchi, and R. E. Kurt. 2018. “Dynamic Risk Assessment of Decommissioning Offshore Jacket Structures.” In: Proceedings of the International Conference on Offshore Mechanics and Arctic Engineering (OMAE), 3, 1–10. June 17-22, 2018, Madrid, Spain.
- Babaleye, A. O., and R. E. Kurt. 2020. “Safety Analysis of Offshore Decommissioning Operation Through Bayesian Network.” Ships and Offshore Structures 15: 99–109.
- Bai, X., L. Sun, and H. Sun. 2012. “Risk Assessment of Hoisting Aboard and Installation for Offshore Wind Turbine.” In: Proceedings of the International Conference on Offshore Mechanics and Arctic Engineering (Vol. 44892, pp. 107-114). American Society of Mechanical Engineers. July 1-6, 2012, Rio de Janeiro, Brazil.
- Baklouti, A., N. Nguyen, J. Y. Choley, F. Mhenni, and A. Mlika. 2017. “Free and Open-Source Fault Tree Analysis Tools Survey.” In: Proceedings of the11th Annual IEEE International Systems Conference, (SysCon), 24-27 April 2017, Montreal, QC, Canada.
- BSI. 2018. Risk Management – Guidelines. BS ISO 31000:2018. The British Standards Institution, London, UK.
- BSI. 2019. Code of Practice for Safe Use of Cranes. BS 7121-5:2019. The British Standards Institution, London, UK.
- BSI. 2020. Ships and Marine Technology – Offshore Wind Energy – Port and Marine Operations. BS ISO 29400:2020. British Standards Institution, London, UK.
- Cherrington, R., V. Goodship, J. Meredith, B. M. Wood, S. R. Coles, A. Vuillaume, A. Feito-Boirac, F. Spee, and K. Kirwan. 2012. “Producer Responsibility: Defining the Incentive for Recycling Composite Wind Turbine Blades in Europe.” Energy Policy 47: 13–21.
- Choudhary, A., and M. Howes-Roberts. 2018. “Crane-less, Diver-Less Platform Decommissioning Vessel to Reduce Cost and Enhance Safety and Efficiency.” SPE symposium: decommissioning and abandonment, Kuala Lumpur, Malaysia, 3-4 December.
- Dai, L., S. Ehlers, M. Rausand, and I. B. Utne. 2013. “Risk of Collision Between Service Vessels and Offshore Wind Turbines.” Reliability Engineering and System Safety 109: 18–31.
- DNVGL. 2015. Guidelines for Marine and Lifting Operations. http://rules.dnvgl.com/docs/pdf/gl/nobledenton/0001-nd%20rev%201.1%2028-jun-16%20general%20guidelines%20for%20marine%20projects.pdf.
- DNVGL. 2017. Recommended Practice: Modelling and Analysis of Marine Operations. DNVGL-RP-N103. https://www.dnvgl.com/oilgas/download/dnvgl-rp-n103-DNVGL-RP-N103-modelling-and-analysis-of-marine-operations.html.
- DNVGL Energy. 2016. Assessment of Offshore Wind Farm Decommissioning Requirements. Report for Ontario Ministry of the Environment and Climate Change. Document Number: 800785-CAMO-R-06. https://files.ontario.ca/assessment_of_offshore_wind_farm_decommissioning_requirements.pdf (Accessed March 2019).
- Friis-Hansen, P., and B. C. Simonsen. 2002. “GRACAT: Software for Grounding and Collision Risk Analysis.” Marine Structures 15 (4–5): 383–401.
- G+ Global Offshore Wind Health and Organisation. 2018. 2017 Incident data report. https://www.gplusoffshorewind.com/?a = 633567.
- G+ Global Offshore Wind Health and Safety Organisation. 2020. G+ Global Offshore Wind Health and Safety Organisation - 2019 Incident Data Report. Available at: www.gplusoffshorewind.com.
- Gintautas, T., J. D. Sørensen, and S. R. Vatne. 2016. “Towards a Risk-Based Decision Support for Offshore Wind Turbine Installation and Operation & Maintenance.” Energy Procedia 94: 207–217. Proceedings of 13th Deep Sea Offshore Wind R&D Conference, EERA DeepWind’2016, 20-22 January 2016, Trondheim, Norway.
- Goerlandt, F., and J. Montewka. 2015. “Maritime Transportation Risk Analysis: Review and Analysis in Light of Some Foundational Issues.” Reliability Engineering and System Safety 138: 115–134.
- González, J. S., M. Burgos Payán, and J. Riquelme Santos. 2013. “Optimum Design of Transmissions Systems for Offshore Wind Farms Including Decision Making Under Risk.” Renewable Energy 59: 115–127.
- Gul, M., A. F. Guneri, and M. Baskan. 2018. “An Occupational Risk Assessment Approach for Construction and Operation Period of Wind Turbines.” Global Journal of Environmental Science and Management 4 (3): 281–298.
- Hinzmann, N., P. Stein, and D. J. Gattermann. 2019. “Decommissioning of Offshore Monopiles, Occuring Problems and Alternative Solutions.” In: Proceedings of the ASME 37th International Conference on Ocean, Offshore and Arctic Engineering OMAE 2018. June 17-22, 2018, Madrid, Spain., 1–8.
- HSE. 2002. Offshore Technology Report – Beyond Lifetime Criteria Of Offshore Cranes. Prepared by BAE Systems (Land and Sea systems). Available at: https://www.hse.gov.uk/researcH/otopdf/2001/oto01088.pdf.
- International Maritime Organisation. 2018. Revised Guidelines for Formal Safety Assessment (FSA) for use in the IMO Rule-Making Process. MSC-MEPC.2/Circ.12/Rev.2. http://www.imo.org/en/OurWork/Safety/SafetyTopics/Documents/MSC-MEPC%202-Circ%2012-Rev%202.pdf.
- Jacinto, C., and C. Silva. 2010. “A Semi-Quantitative Assessment of Occupational Risks Using bow-tie Representation.” Safety Science 48 (8): 973–979.
- Kahrobaee, S., and S. Asgarpoor. 2011. “Risk-based Failure Mode and Effect Analysis for Wind Turbines (RB-FMEA).” Proceedings of the 43rd north American Power Symposium NAPS 2011, Boston, Massachusetts, USA, August 4-6, 2011.
- Kaiser, M. J., and A. G. Pulsipher. 2004. “A Binary Choice Severance Selection Model for the Removal of Offshore Structures in the Gulf of Mexico.” Marine Policy 28 (2): 97–115.
- Kim, S. J., J. K. Seo, K. Y. Ma, and J. S. Park. 2021. “Methodology for Collision-Frequency Analysis of Wind-Turbine Installation Vessels.” Ships and Offshore Structures 16 (4): 423–439.
- Kim, J., A. U. A. Shah, and H. G. Kang. 2020. “Dynamic Risk Assessment with Bayesian Network and Clustering Analysis.” Reliability Engineering and System Safety 201: 106959.
- Klinger, C. 2014. “Failures of Cranes due to Wind Induced Vibrations.” Engineering Failure Analysis 43: 198–220.
- Kongsvik, T., T. Haavik, and G. Gjøsund. 2014. “Participatory Safety Barrier Analysis: A Case from the Offshore Maritime Industry.” Journal of Risk Research 17 (2): 161–175.
- Lazakis, I., and M. A. Kougioumtzoglou. 2019. “Assessing Offshore Wind Turbine Reliability and Availability.” Journal of Engineering for the Maritime Environment 233 (1): 267–282.
- Li, L., Z. Gao, and T. Moan. 2016. “Operability Analysis of Monopile Lowering Operation Using Different Numerical Approaches.” International Journal of Offshore and Polar Engineering 26 (2): 88–99.
- Li, S., Q. Meng, and X. Qu. 2012. “An Overview of Maritime Waterway Quantitative Risk Assessment Models.” Risk Analysis 32 (3): 496–512.
- Luo-Theilen, X., and T. Rung. 2019. “Numerical Analysis of the Installation Procedures of Offshore Structures.” Ocean Engineering 179: 116–127.
- Marine Accident Investigation Branch (MAIB). 2020. “2019 Annual Report - Recommendations Edition (Issue June).” https://assets.publishing.service.gov.uk/government/uploads/system/uploads/attachment_data/file/896409/MAIBAnnualReport2019.pdf.
- Maritime, Danish. 2017. Offshore Wind Industry Standards. https://danskemaritime.dk/wp-content/uploads/2017/03/Project-No.-2016-080-Offshore-Wind-31.10.2017.pdf.
- Mehdi, R. A., M. Baldauf, and H. Deeb. 2020. “A Dynamic Risk Assessment Method to Address Safety of Navigation Concerns Around Offshore Renewable Energy Installations.” Journal of Engineering for the Maritime Environment 234 (1): 231–244.
- Mendoza, J., and J. Köhler. 2019. “Risk-based Design of an Offshore Wind Turbine Using VoI Analysis.” Proceedings of the 13th International Conference on Applications of statistics and probability in civil engineering, Seoul, South Korea, May 26-30.
- Morandeau, M., R. T. Walker, R. Argall, and R. F. Nicholls-lee. 2013. “Optimisation of Marine Energy Installation Operations.” International Journal of Marine Energy 3–4: 14–26.
- Offshore, C. 2020. https://www.4coffshore.com/windfarms/.
- OSPAR Commission. 2006. Review of the current state of knowledge on the environmental impacts of the location, operation and removal/disposal of offshore wind-farms. Status report April 2006. ISBN 978-1-905859-15-3. https://www.ospar.org/documents?v = 7055 (accessed on: 14.02.2020).
- Port of Grenaa. 2020. https://www.port-of-grenaa.com.
- Rahman, M. S., F. Khan, A. Shaikh, S. Ahmed, and S. Imtiaz. 2020. “A Conditional Dependence-Based Marine Logistics Support Risk Model.” Reliability Engineering and System Safety 193: 106623.
- Rangel-Ramírez, J. G., and J. D. Sørensen. 2012. “Risk-based Inspection Planning Optimisation of Offshore Wind Turbines.” Structure and Infrastructure Engineering 8 (5): 473–481.
- Ruud, S., and Å Mikkelsen. 2008. “Risk-based Rules for Crane Safety Systems.” Reliability Engineering and System Safety 93 (9): 1369–1376.
- Seyr, H., and M. Muskulus. 2016. “Safety Indicators for the Marine Operations in the Installation and Operating Phase of an Offshore Wind Farm.” Energy Procedia 94: 72–81.
- Shafiee, M. 2015a. “A Fuzzy Analytic Network Process Model to Mitigate the Risks Associated with Offshore Wind Farms.” Expert Systems with Applications 42 (4): 2143–2152.
- Shafiee, M. 2015b. “Maintenance Logistics Organization for Offshore Wind Energy: Current Progress and Future Perspectives.” Renewable Energy 77 (1): 182–193.
- Shafiee, M, I Animah, B Alkali, and D Baglee. 2019. “Decision support methods and applications in the upstream oil and gas sector.” Journal of Petroleum Science and Engineering 173: 1173–1186.
- Shafiee, M., and F. Dinmohammadi. 2014. “An FMEA-Based Risk Assessment Approach for Wind Turbine Systems: A Comparative Study of Onshore and Offshore.” Energies 7 (2): 619–642.
- Sun, H., X. Bai, S. Li, and L. Sun. 2012. “Risk assessment of Transportation and Installation of Offshore Jacket.” In: Proceedings of the ASME 31st International Conference on Offshore Mechanics and Arctic Engineering, Vol. 44892, pp. 89–98, July 1-6, 2012, Rio de Janeiro, Brazil.
- Taflanidis, A. A., E. Loukogeorgaki, and D. C. Angelides. 2013. “Offshore Wind Turbine Risk Quantification/Evaluation Under Extreme Environmental Conditions.” Reliability Engineering and System Safety 115: 19–32.
- Topham, E., and D. McMillan. 2017. “Sustainable Decommissioning of an Offshore Wind Farm.” Renewable Energy 102: 470–480.
- Uğurlu, Ö, E. Köse, U. Yıldırım, and E. Yüksekyıldız. 2015. “Marine Accident Analysis for Collision and Grounding in oil Tanker Using FTA Method.” Maritime Policy and Management 42 (2): 163–185.
- United Nations. 1982. “United Nations Convention on the Law of the Sea (UNCLOS).” Accessed November 8, 2019. https://www.un.org/depts/los/convention_agreements/texts/unclos/unclos_e.pdf.
- Winge, S., E. Albrechtsen, and J. Arnesen. 2019. “A Comparative Analysis of Safety Management and Safety Performance in Twelve Construction Projects.” Journal of Safety Research 71: 139–152.
- Zhao, Y., Z. Cheng, P. C. Sandvik, Z. Gao, T. Moan, and E. Van Buren. 2018. “Numerical Modeling and Analysis of the Dynamic Motion Response of an Offshore Wind Turbine Blade During Installation by a Jack-up Crane Vessel.” Ocean Engineering 165: 353–364.
- Zitrou, A., T. Bedford, and L. Walls. 2014. “Quantification and Modelling of Epistemic Uncertainties for Availability Risk of Future Offshore Wind Farms Using Expert Judgment.” In: Proceedings of the European Safety and Reliability Conference, 14-18 September, Wroclaw, Poland, pp. 805–812.
Appendices
Appendix A: Methodology flowchart
Appendix B: Risk Matrix with multiple consequence classes (BSI Citation2002; Citation2019)
The asset consequence depends on whether the removed modules are intended for disposal or reuse. It is assumed that there is good visibility during all decommissioning operations.
Appendix C: HAZID analysis for an offshore wind turbine decommissioning (G+ Global Offshore Wind Health and Safety Organisation, Citation2018; DNVGL Energy Citation2016; Abdussamie et al. Citation2018; Babaleye, Khorasanchi, and Kurt Citation2018; Babaleye and Kurt Citation2020).
Appendix D: Minimal cut set (MCS) for suspended/halted decommissioning operations (top event).
Table