
 ?Mathematical formulae have been encoded as MathML and are displayed in this HTML version using MathJax in order to improve their display. Uncheck the box to turn MathJax off. This feature requires Javascript. Click on a formula to zoom.
ABSTRACT
In this study, using a Geographical Information System (GIS) based model method, locations having theoretical hydroelectric energy potential were identified in the Buyuk Menderes basin, one of Turkey's largest basins. According to the installed power potential on the examined basin, 33 sites below 10 MW, 57 sites between 10 and 50 MW, 4 sites between 50 and 100 MW, and 1 site over 100 MW were found as a consequence of the study. While the theoretical hydroelectric energy potential in the whole basin is 886.55 MW at 70% turbine efficiency, the installed power in the basin is currently 302.02 MW. According to these results, only 34.07% of the total hydro potential in the basin is used today.
1. Introduction
The energy sector has a significant impact on the economic, social, technological, and environmental development of countries and regions (Hosseini et al. Citation2022). With the increase in the energy demand, the energy sector’s role is also increasing.
While the energy supply was 230 EJ in 1971, this figure reached 606 EJ in 2020 (World Energy Balances: Overview Citation2021). This has emerged as a result of continued population growth and industrialisation (Marks-Bielska et al. Citation2020). Urbanisation has also contributed to the increase in energy demand (Xu et al. Citation2018). And this increase is expected to continue in the coming years. According to the International Energy Agency (IEA), energy demand is projected to increase at an annual rate of 1.3% between 2020 and 2030, reaching 670 EJ in 2030 (World Energy Outlook Citation2021 Citation2021).
Considering electrical energy, while 6,131 TWh of energy was produced in 1973, 26,936 TWh of electrical energy was produced in 2019 (Key World Energy Statistics Citation2021 Citation2021). This shows that the increase in electrical energy supply is much higher than the increase in the general energy supply. To fight climate change, the increasing energy supply must be met with renewable energy sources because the energy sector is one of the sectors that contributes the most to carbon emissions (Brini Citation2021; Suman Citation2021; Kang et al. Citation2020; Wang et al. Citation2018). Different studies have been carried out to reduce the energy supply, which is an alternative solution to the global warming problem contributed by the energy sector (Brugger et al. Citation2021; Sorrell Citation2015).
Hydropower, which is one of the renewable energy sources, has a great responsibility to meet the demands of the increasing population and fight the problem of climate change (Zhang et al. Citation2018; Zhang et al. Citation2015). In this context, investments in hydroelectric power plants continue throughout the world (Almeida et al. Citation2022; Zarfl et al. Citation2015). shows the installed power of hydropower plants in the world and Turkey between 2016 and 2020 (CitationPublications. International Hydropower Association).
Figure 1. Total installed capacity of hydropower plants in Turkey and the world.
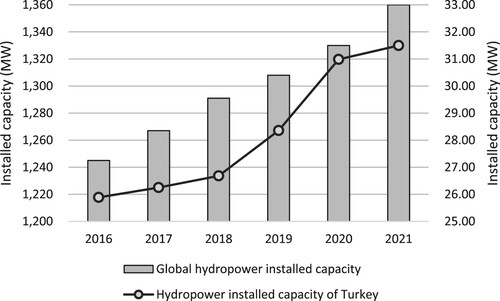
In , both in Turkey and around the world, the installed power of hydropower plants is increasing due to the increase in their number. Considering the year 2020, Turkey, which ranks first in Europe with 2.480 MW, made the biggest contribution to the installed power after China (Hydropower Status Report Citation2021).
Hydropower plants are classified in terms of their installed power capacities. However, this classification differs from country to country. For example, facilities smaller than 50 MW in terms of installed capacity are considered small hydropower plants (SHPs) in China and Canada, while facilities with an installed capacity of 5–100 MW in the US are considered SHPs (Zhang et al. Citation2020; Arthur et al. Citation2020). In the World Small Hydropower Development Report (WSHDR), published by the United Nations Industrial Development Organization (UNIDO) and the International Center on Small Hydro Power (ICSHP), facilities with an installed capacity of less than 10 MW are classified as SHP, and this is taken as a reference in the statistics shared. SHPs, which are a class of hydropower plants, play an important role in many rural areas, although they constitute 7.5% of the total hydropower capacity. SPHs are very suitable both in terms of cost and applicability, especially in rural areas where energy demand is low (Liu et al. Citation2019). Although SHPs produce less electricity than large hydropower plants (LHPs), they have advantages in terms of operating on small rivers and application diversity (Couto and Olden Citation2018). At the same time, the environmental effects of SHPs are less than LHPs. A study suggested that the four SHPs examined in Spain did not cause significant changes in the physical and chemical properties of water (Álvarez et al. Citation2020). Considering these advantages, SHPs, which are renewable energy sources, play a major role in the fight against climate change.
Since the hydroelectric potential in the basin has not been determined before, the gap in the study area on this subject will be filled with this study. In this study, the potential of hydropower plants will be investigated in the Büyük Menderes Basin, which is one of Turkey's 25 river basins (Official Water Resources Statistics for Citation2020). The hydropower plants to be determined with the help of the Geographic Information System (GIS) will be compared with the existing hydropower plants, and the accuracy of the results obtained from the GIS will be examined. At the same time, the hydropower plant sites that can be built will be determined. Thus, this study will contribute to the planners by setting an example for future hydropower plants in the basin.
2. Material and methods
2.1. Material
2.1.1 Study area
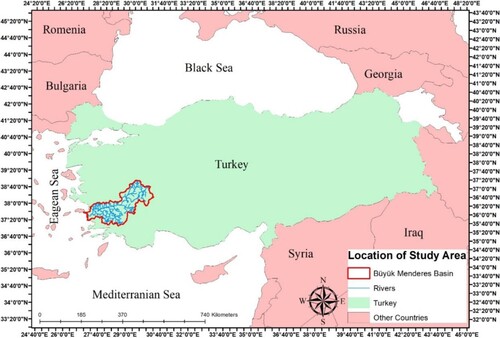
Büyük Menderes Basin is located between 37° 6′–38° 55′ north latitudes and 27°−30° 36′ east longitudes in the Aegean Region. The basin is one of Turkey's 25 river basins. With a surface area of 25,960 km2, it is Turkey's 8th largest basin in terms of surface area (Official Water Resources Statistics for Citation2020). Denizli, Aydın, Afyonkarahisar, and Muğla provinces constitute approximately 83.5% of the basin (CitationBüyük Menderes Basin Protection Action Plan Report). The longest river in the basin is the Büyük Menderes River, with a length of 581,091 km (CitationPreparation of Watershed Protection Action Plans). The annual average flow in the basin is 3,047 km3. While the groundwater recharge of the basin is 1,045.4 hm3/year, the groundwater operating reserve is 761.5 hm3/year (Official Water Resources Statistics for Citation2020; Official Water Resources Statistics for Citation2020). The Büyük Menderes Basin is divided into ten sub-basins: Banaz Stream Basin, Küfi Stream Basin, Adıgüzel Dam, Buldan Buharkent Basin, Çürüksu Basin, Dandalas Basin, Akçay Basin, Çine Sub-Basin, and Aydın Söke Basin. The location of the Büyük Menderes Basin, which is being examined as a study area, in Turkey is shown in .
Figure 2. The location of the Büyük Menderes Basin in Turkey.
2.1.2. Data collection
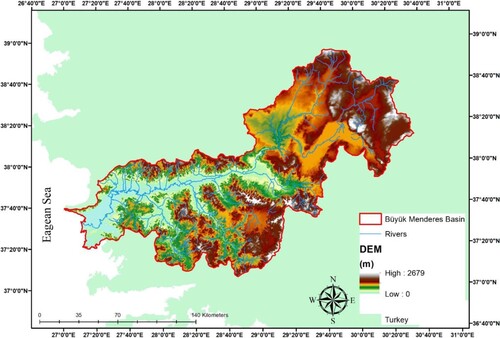
In this study, digital elevation model (DEM) of the study area and rainfall data were needed to determine the hydropower plants in the study area. DEM of the study area is derived from USGS Shuttle Radar Topography Mission (SRTM) elevation data and has a resolution of 30 m with absolute vertical height accuracy of less than 16 m. The basin boundaries and the stream networks belonging to the basin are given in together with the DEM. The rainfall data for the study area were taken from General Directorate of State Meteorology Affairs. There are 14 rainfall gauging stations in the study area, and the data at these stations were obtained monthly.
Figure 3. DEM and river networks of the Büyük Menderes Basin.
2.2. Methods
Spatial analyses in this study were performed with ArcGIS 10.3 software, and the flow chart of the method applied in the study is given in . The method is limited to revealing the theoretical hydroelectric energy potential in a study area. Realisable potential can be revealed through field research. First, the fill tool was used to eliminate minor defects in the DEM of the study area. Then, the flow direction of each cell was determined with the flow direction tool. The output raster obtained as a result of the flow direction analysis was entered as the input raster in the flow accumulation tool, and the raster of the flow accumulation was obtained as the output. The term ‘flow accumulation’ describes how much water has theoretically accumulated in particular pixel cells of the land. When calculating the flow accumulation of a cell, each cell flowing into it is taken into account.
Figure 4. Flowchart of the method used in the study.
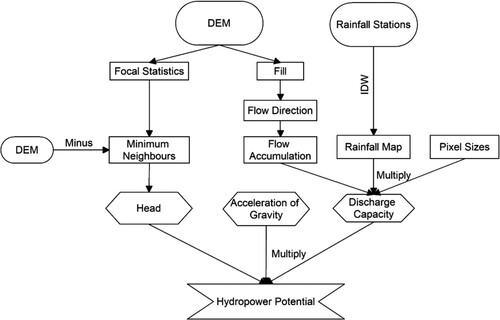
When calculating the water mass in the cell, the flow accumulation value of the cell, the rainfall depth at the cell location, the cell area, and the density of water are multiplied (EquationEq. 1(1)
(1) ). EquationEq. 1
(1)
(1) serves to calculate the mass expression in the potential energy equation given in EquationEq. 3
(3)
(3) .
(1)
(1)
The parameters in these equations are,
: mass of water in the cell (kg),
f: flow accumulation of the cell,
: rainfall depth in the cell (m),
: cell area (m2),
: water density (kg/m3).
In this study, since each cell has the same dimensions (100 m × 100 m), the flow accumulations and rainfall depths of the cells are variable while the cell areas are constant. The rainfall depths values of the cells were determined by interpolating the values obtained from 14 rainfall gauging stations (). Interpolation was carried out with the IDW (inverse distance weighted) interpolation method. In this method, unknown point values are calculated depending on the distance between the known point and the unknown point. The formula used in interpolation is given in EquationEq. (2(2)
(2) ) (Lloyd Citation2007).
(2)
(2)
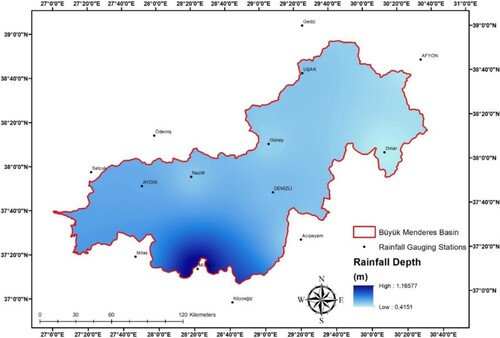
Figure 5. Rainfall depth map of Büyük Menderes Basin.
The parameters in these equations are,
z(x0): rainfall depth at an unknown point (mm),
z(xi): rainfall depth at a known point (mm),
r: exponent that determines the weight assigned to the observations,
d: distance between points xi and x0 (m)
After calculating the water masses in each cell (pixel) on the river networks, the required head heights to generate electricity in hydropower plants are calculated. The focal statistics tool in ArcGIS software was used for this process. The raw DEM of the study area is entered into the focal statistics tool as input. At the end of this process, each cell in the raster data given as output is calculated as a function of the values of the neighbouring cells of that cell at a certain distance. The values of neighbouring cells, including the processing cell, are taken into account when calculating neighbourhood statistics. In this way, the minimum neighbourhood value, which is the maximum head between two cells, is calculated. After calculating the water masses and head heights of the cells, the potential energies are calculated in the final step. The equation used in the calculation of potential energies is given below (EquationEq. 3(3)
(3) ).
(3)
(3)
E: potential energy (J),
m: mass of water (kg)
g: acceleration of gravity (m/s2)
h: head (m)
The unit of energy calculated in the equation is the Joule, so the calculation factor is used to convert the energy into kWh and MWh (1/3.6*1012).
3. Results and discussions
3.1. Rainfall depths
The data obtained from the 14 rainfall gauging stations in the study area were interpolated according to the IDW interpolation method described in the method section. The rainfall depth map obtained as a result of interpolation is given in .
According to the data obtained from the rainfall gauging stations within the borders of the basin, the annual rainfall depth in the basin varies between 1166 mm and 415 mm. The rainfall depth in the southern parts of the basin is higher than in the other parts. The average rainfall depth in the basin is approximately 600 mm.
3.2. Flow accumulation
The accumulated flow of all cells flowing into each downslope cell was calculated using the flow accumulation function [). The flow accumulation in the investigated region ranged from 0 to 150,658. After computing the flow accumulation raster, this layer is multiplied by the area of a pixel (100 m × 100 m) and the rainfall map layer to calculate the discharge capacity of the basin.
Figure 6. Flow accumulation map of the Büyük Menderes Basin.
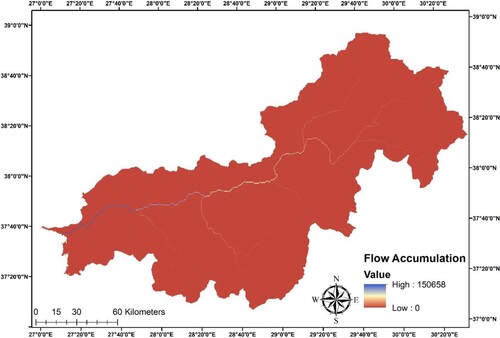
On a pixel basis, discharge capacity refers to the maximum volume of water that can pass through a stream. Ibrahim et al. (Citation2015) measured the water level at six points on the Aqra River, Lebanon and calculated the discharge capacity of the stream based on these measurements. However, in this study, a precipitation map prepared with precipitation measurement data based on many years was used. A more realistic and holistic approach has been put forward.
3.3. Theoretical hydropower potentials
As a result of the analyses made in the study, a total of 95 sites were determined in the Büyük Menderes Basin, varying in terms of their installed power. The locations of the identified hydropower potential sites in the basin are shown in .
Figure 7. Potential hydropower sites in the Büyük Menderes Basin.
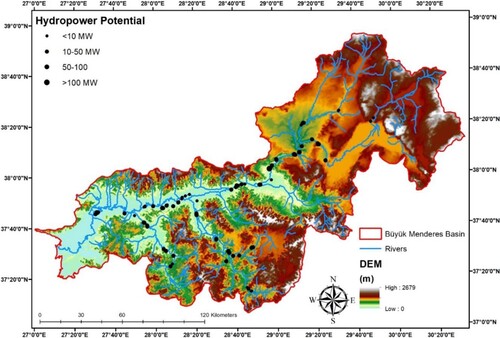
The classification of hydropower potential sites shown on the map in terms of installed power is given in . In the classification of hydropower facilities in terms of installed power, although most countries accept facilities smaller than 10 MW as SHPs, this classification differs according to countries and organisations (Ptak et al. Citation2022). The capacity of 50 MW, which is the upper limit for small hydropower plants in Turkey, was determined as the classification criterion in this study (Capik et al. Citation2012).
Table 1. Classification of hydropower potentials in the Büyük Menderes Basin according to installed capacity.
According to , in terms of installed power in the basin, 33 hydropower plants smaller than 10 MW (Mini Hydropower Plants), 57 hydropower plants between 10–50 MW (SHPs), 4 hydropower plants between 50–100 MW (Medium Hydropower Plants), and 1 hydropower plant larger than 100 MW (LHPs) have been theoretically determined. SHPs account for 60% of the determined hydropower potentials. When the turbine efficiency is accepted as 70% for a total of 95 facilities, calculated theoretically, the total installed power of these facilities is 886.55 MW. The total installed power of the hydropower plants operating in the basin is 302.02 MW. The total installed power of the existing facilities constitutes approximately 34.07% of the theoretically calculated installed power. However, considering factors such as environmental, social, and cost, it may not be possible to construct all the hydropower plants determined theoretically. Therefore, it should be noted that environmental conditions and other effects are ignored in this study.
At the same time, Adıgüzel and Kemer Dams, which are currently in operation in the basin, overlap with the theoretically determined sites and show a great similarity in terms of installed power (.). If the turbine efficiency, which is accepted as 100% in the theoretical calculations, is accepted in the range of 70%−80%, the existing installed capacities of Adıgüzel and Kemer Dams are also compatible with the installed capacities obtained by the theoretical calculations. As a result of the analysis, the theoretical potentials of Adıgüzel and Kemer Dams were found as 80 MW and 69 MW, respectively. These amounts are, in fact, 62 and 48 MW, respectively. When the turbine efficiency is assumed to be approximately 78% in the Adıgüzel dam and approximately 70% in the Kemer dam, the installed power of these two plants in operation is obtained.
Figure 8. Comparison of the installed power of Kemer and Adıgüzel Dams in operation with the analysis results.
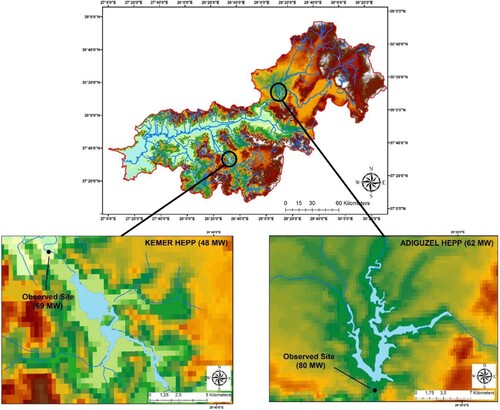
Turbine efficiency, which also depends on the turbine configuration, discharge, and head, is the turbine's ability to transform mechanical energy into electrical energy (Daadaa et al. Citation2021). Although turbine efficiencies may vary in practice, many studies have shown that turbine efficiency is in the range of 70−80%, especially in plants with low heads (Elbatran et al. Citation2015; Okot Citation2013; Paish Citation2002). Therefore, the assumption made for turbine efficiency in the study is a reasonable one.
4. Conclusion and recommendations
GIS provides both time-saving and economic gain in determining suitable sites for hydropower plants. Based on the results obtained in this study, which overlap with the existing dams in the basin, it seems that GIS is successful in identifying hydropower potential sites. In addition to the method used in this study, climatic data such as precipitation and evaporation can be analyzed in more detail, and theoretical results closer to reality can be obtained. Apart from these, if potential hydropower areas are selected considering environmental, social, and economic effects, the results will be even more logical and applicable. This study only revealed the determination of suitable hydropower potential sites by theoretical calculations. Along with many studies in this area in different regions, this study will serve as an example for researchers and planners to have a comprehensive idea of the potential sites in the study area (Tian et al. Citation2020; Sammartano et al. Citation2019; Zaidi and Khan Citation2018; Bayazıt et al. Citation2017; Kayastha et al. Citation2018).
A study examined the installed power and annual production of hydropower plants operating in the Büyük Menderes Basin. According to the results of the study, considering the electricity production between 2010-2019, it is stated that the basin has an installed power of 302.02 MW, and an average of 68% of the total installed power was put into service between these years. Between these years, the maximum production in the basin was 92.97%, while the minimum production was 43.09%, according to the installed power (Koç Citation2022). The 70% turbine efficiency, which is accepted in the theoretical calculations in this study, is a realistic assumption considering that the average efficiency in the basin is 68%.
Similar to this study, the theoretical potential hydropower facilities and the installed capacity of these facilities were determined with the help of GIS in the Ayung Basin and compared with the existing hydropower plants (Farid et al. Citation2021). In another similar study, in addition to the method in this study, the analytical hierarchy process (AHP) was used as a selection tool in the selection of potential sites in Nigeria (Odiji et al. Citation2021). Although theoretical calculations have been made for the determination of hydropower potential areas with the help of GIS in different studies, comparisons with existing hydropower plants have not been made, as was done in this study (Zaidi and Khan Citation2018; Fasipe et al. Citation2021; Setiawan Citation2015). In another study, theoretically, the locations and installed capacities of hydropower plants were calculated, but instead of comparing with existing facilities, a different approach was shown by making calculations on the discharge obtained by the correlation between the observed discharge and the estimated discharge in the river basin in Nigeria. At the same time, the costs of potential facilities were also calculated in the study (Fasipe and Izinyon Citation2021).
Hydropower plants are of great importance in terms of climate change, which is one of the leading problems and issues globally. Therefore, it is necessary to increase the number of these facilities and, while doing this, by developing these facilities, both to increase efficiency and reduce their effects. To serve this purpose, many studies, including this study, have been carried out (Liszka et al., Citation2022; Zahedi et al., Citation2022; Pragana et al., Citation2017). In this study, the method used to investigate the theoretical hydropower potential with the Geographical Information System is explained in detail and will thus be a helpful resource for future researchers. In addition, future researchers can calculate how much of the theoretical hydropower potential in the basin can be used in practice, considering the environmental and social effects that are ignored in this study. At the same time, this study will contribute to the literature on Geographical Information System applications and renewable energy. A sustainable future will be possible with the increase in the number of these and similar studies, their implementation, and the awareness of people.
Disclosure statement
No potential conflict of interest was reported by the author(s).
References
- Almeida, R., R. Schmitt, A. Castelletti, A. Flecker, J. Harou, S. Heilpern, N. Kittner, et al. 2022. “Strategic Planning of Hydropower Development: Balancing Benefits and Socioenvironmental Costs.” Current Opinion in Environmental Sustainability 56. doi:10.1016/j.cosust.2022.101175.
- Álvarez, X., E. Valero, N. Torre-Rodríguez, and C. Acuña-Alonso. 2020. “Influence of Small Hydroelectric Power Stations on River Water Quality.” Water 12. doi:10.3390/w12020312.
- Arthur, E., F. Anyemedu, C. Gyamfi, P. Asantewaa - Tannor, K. Adjei, G. Anornu, and S. Odai. 2020. “Potential for small hydropower development in the Lower Pra River Basin, Ghana.” Journal of Hydrology: Regional Studies 32. doi:10.1016/j.ejrh.2020.100757.
- Bayazıt, Y., R. Bakış, and C. Koç. 2017. “An Investigation of Small Scale Hydropower Plants Using the Geographic Information System.” Renewable and Sustainable Energy Reviews 67: 289–294. doi:10.1016/j.rser.2016.09.062.
- Brini, R. 2021. “Renewable and Non-Renewable Electricity Consumption, Economic Growth and Climate Change: Evidence from a Panel of Selected African Countries.” Energy 223. doi:10.1016/j.energy.2021.120064.
- Brugger, H., W. Eichhammer, N. Mikova, and E. Dönitz. 2021. Energy Efficiency Vision 2050: How Will New Societal Trends Influence Future Energy Demand in the European Countries?” Energy Policy 152. doi:10.1016/j.enpol.2021.112216.
- Büyük Menderes Basin Protection Action Plan Report: General Directorate of Water Management & Ministry of Forestry and Water Affairs of the Republic of Turkey; 2016. https://www.tarimorman.gov.tr/SYGM/Belgeler/havza%20koruma%20eylem%20planlar%C4%B1/B.Menderes_Havzas%C4%B1.pdf. Accessed March 24, 2022.
- Capik, M., A. Yılmaz, and İ Cavusoglu. 2012. “Hydropower for Sustainable Energy Development in Turkey: The Small Hydropower Case of the Eastern Black Sea Region.” Renewable and Sustainable Energy Reviews 16 (8): 6160–6172. doi:10.1016/j.rser.2012.06.005.
- Couto, T., and J. Olden. 2018. “Global Proliferation of Small Hydropower Plants – Science and Policy.” Frontiers in Ecology and the Environment 16 (2): 91–100. doi:10.1002/fee.1746.
- Daadaa, M., S. Séguin, K. Demeester, and M. Anjos. 2021. “An Optimization Model to Maximize Energy Generation in Short-Term Hydropower Unit Commitment Using Efficiency Points.” International Journal of Electrical Power & Energy Systems 125. doi:10.1016/j.ijepes.2020.106419.
- Elbatran, A., O. Yaakob, Y. Ahmed, and H. Shabara. 2015. “Operation, Performance and Economic Analysis of Low Head Micro-Hydropower Turbines for Rural and Remote Areas: A Review.” Renewable and Sustainable Energy Reviews 43: 40–50. doi:10.1016/j.rser.2014.11.045.
- Farid, M., A. Rizaldi, A. Prahitna, M. Badri, A. Kuntoro, and H. Kardhana. 2021. “Rapid Hydropower Potential Assessment for Remote Area by using Global Data.” IOP Conference Series: Earth and Environmental Science 813), doi:10.1088/1755-1315/813/1/012006.
- Fasipe, O., and O. Izinyon. 2021. “Feasibility Assessment of SHP Potential Using GIS-enhanced RS Approach in Poorly Gauged River Basin in Nigeria.” Renewable Energy Focus 36: 65–78. doi:10.1016/j.ref.2020.12.005.
- Fasipe, O., O. Izinyon, and J. Ehiorobo. 2021. “Hydropower Potential Assessment Using Spatial Technology and Hydrological Modelling in Nigeria River Basin.” Renewable Energy, 960–976. doi:10.1016/j.renene.2021.06.133.
- Hosseini, S., A. Aslani, and A. Kasaeian. 2022. “Energy, Water, and Environmental Impacts Assessment of Electricity Generation in Iran.” Sustainable Energy Technologies and Assessments, 52. doi:10.1016/j.seta.2022.102193.
- Hydropower Status Report 2021: Sector trends and insights. International Hydropower Association; 2021. https://www.hydropower.org/publications/2021-hydropower-status-report#:~:text=Now%20in%20its%20eighth%20edition,Association%20(IHA)%20finds%20that%3A&text=Global%20installed%20hydropower%20capacity%20rose,to%201%2C330%20gigawatts%20in%202020. Accessed February 13, 2022.
- Ibrahim, A., M. Al Hajj, and M. El Hage. 2015. “Use of Geomatic Approaches to Characterize Arqa River Basin: A Typical Coastal Lebanese River.” Open Journal of Modern Hydrology 5: 45–57. http://doi.org/10.4236/ojmh.2015.53005.
- Kang, J.-N., Y.-M. Wei, L.-C. Liu, R. Han, B.-Y. Yu, and J.-W. Wang. 2020. “Energy Systems for Climate Change Mitigation: A Systematic Review.” Applied Energy 263. doi:10.1016/j.apenergy.2020.114602.
- Kayastha, N., U. Singh, and K. Dulal. 2018. “A GIS Approach for Rapid Identification of Run-of-River (RoR) Hydropower Potential Site in Watershed: A case study of Bhote Koshi Watershed, Nepal.” Hydro Nepal: Journal of Water, Energy and Environment 23: 48–55. doi:10.3126/hn.v23i0.20825.
- Key World Energy Statistics 2021. Paris: International Energy Agency; 2021. https://www.iea.org/reports/key-world-energy-statistics-2021. Accessed April 28, 2022.
- Koç, C. 2022. “A Study on Solutions and Problems of Hydroelectric Power Plants in the Operation.” Sustainable Water Resources Management 8 (90), https://doi.org/10.1007/s40899-022-00677-2.
- Liszka, D., Z. Krzemianowski, T. Węgiel, D. Borkowski, A. Polniak, K. Wawrzykowski, and A. Cebula. 2022. “Alternative Solutions for Small Hydropower Plants.” Energies 15 (4), doi:10.3390/en15041275.
- Liu, D., H. Liu, X. Wang, and E. Kremere. 2019. World Small Hydropower Development Report 2019. United Nations Industrial Development Organization & International Center on Small Hydro Power; 2019. www.smallhydroworld.org. Accessed March 8, 2022.
- Lloyd, C. 2007. Local Models for Spatial Analysis. CRC Press.
- Marks-Bielska, R., S. Bielski, K. Pik, and K. Kurowska. 2020. “The Importance of Renewable Energy Sources in Poland’s Energy Mix.” Energies 13 (18), doi:10.3390/en13184624.
- Odiji, C., M. Adepoju, I. Ibrahim, O. Adedeji, I. Nnaemeka, and O. Aderoju. 2021. “Small Hydropower Dam Site Suitability Modelling in Upper Benue River Watershed, Nigeria.” Applied Water Science 11 (8): 136. doi:10.1007/s13201-021-01466-6.
- Official Water Resources Statistics for 2020: Annual Average Surface Water Potential by Basin, 2013-2020. Devlet Su İşleri; 2020. https://cdniys.tarimorman.gov.tr/api/File/GetGaleriFile/425/DosyaGaleri/2471/1.2.havzalara_gore_yillik_ortalama_yuzeysuyu_su_potansiyeli_20132020.xlsx. Accessed March 9, 2022.
- Official Water Resources Statistics for 2020: Annual Groundwater Potential by Basin, 2013-2020. Devlet Su İşleri; 2020. https://cdniys.tarimorman.gov.tr/api/File/GetGaleriFile/425/DosyaGaleri/2471/1.3.havzalara_gore_yillik_yeraltisuyu_potansiyeli_20132020.xlsx. Accessed March 9, 2022.
- Official Water Resources Statistics for 2020: Turkey Basin Numbers and Basins. Devlet Su İşleri; 2020. https://cdniys.tarimorman.gov.tr/api/File/GetGaleriFile/425/DosyaGaleri/2471/1.1.turkiye_havza_numaralari_ve_havzalari_2020.docx. Accessed April 30, 2022.
- Okot, D. 2013. “Review of Small Hydropower Technology.” Renewable and Sustainable Energy Reviews 26: 515–520. doi:10.1016/j.rser.2013.05.006.
- Paish, O. 2002. “Small Hydro Power: Technology and Current Status.” Renewable and Sustainable Energy Reviews 6 (6): 537–556. doi:10.1016/S1364-0321(02)00006-0.
- Pragana, I., I. Boavida, R. Cortes, and A. Pinheiro. 2017. “Hydropower Plant Operation Scenarios to Improve Brown Trout Habitat.” River Research and Applications 33 (3): 364–376. doi:10.1002/rra.3102.
- Preparation of Watershed Protection Action Plans: Büyük Menderes Basin. Turkish Scientific and Technical Research Council; 2010. https://www.tarimorman.gov.tr/SYGM/Belgeler/havza%20koruma%20eylem%20planlar%C4%B1/B.Menderes_Havzas%C4%B1.pdf. Accessed March 3, 2022.
- Ptak, T., A. Crootof, T. Harlan, and S. Kelly. 2022. “Critically Evaluating the Purported Global “Boom” in Small Hydropower Development Through Spatial and Temporal Analysis.” Renewable and Sustainable Energy Reviews 163. doi:10.1016/j.rser.2022.112490.
- Publications. International Hydropower Association. https://www.hydropower.org/resources/publications. Accessed March 20, 2022.
- Sammartano, V., L. Liuzzo, and G. Freni. 2019. “Identification of Potential Locations for Run-of-River Hydropower Plants Using a GIS-Based Procedure.” Energies 12 (18), doi:10.3390/en12183446.
- Setiawan, D. 2015. “Potential Sites Screening for Mini Hydro Power Plant Development in Kapuas Hulu, West Kalimantan: A GIS Approach.” Energy Procedia 65: 76–82. doi:10.1016/j.egypro.2015.01.034.
- Sorrell, S. 2015. “Reducing Energy Demand: A Review of Issues, Challenges and Approaches.” Renewable and Sustainable Energy Reviews 47: 74–82. doi:10.1016/j.rser.2015.03.002.
- Suman, A. 2021. “Role of Renewable Energy Technologies in Climate Change Adaptation and Mitigation: A Brief Review From Nepal.” Renewable and Sustainable Energy Reviews 151. doi:10.1016/j.rser.2021.111524.
- Tian, Y., F. Zhang, Z. Yuan, Z. Che, and N. Zafetti. 2020. “Assessment Power Generation Potential of Small Hydropower Plants Using GIS Software.” Energy Reports 6: 1393–1404. doi:10.1016/j.egyr.2020.05.023.
- Wang, B., Q. Wang, Y.-M. Wei, and Z.-P. Li. 2018. “Role of Renewable Energy in China’s Energy Security and Climate Change Mitigation: An Index Decomposition Analysis.” Renewable and Sustainable Energy Reviews 90: 187–194. doi:10.1016/j.rser.2018.03.012.
- World Energy Balances: Overview. Paris: International Energy Agency; 2021. https://www.iea.org/reports/world-energy-balances-overview. Accessed April 28, 2022.
- World Energy Outlook 2021. Paris: International Energy Agency; 2021. https://www.iea.org/reports/world-energy-outlook-2021. Accessed April 27, 2022.
- Xu, X., J. González, S. Shen, S. Miao, and J. Dou. 2018. “Impacts of Urbanization and Air Pollution on Building Energy Demands — Beijing Case Study.” Applied Energy 225: 98–109. doi:10.1016/j.apenergy.2018.04.120.
- Zahedi, R., A. Ahmadi, and S. Gitifar. 2022. “Reduction of the Environmental Impacts of the Hydropower Plant by Microalgae Cultivation and Biodiesel Production.” Journal of Environmental Management 304), doi:10.1016/j.jenvman.2021.114247.
- Zaidi, A., and M. Khan. 2018. “Identifying High Potential Locations for Run-of-the-River Hydroelectric Power Plants Using GIS and Digital Elevation Models.” Renewable and Sustainable Energy Reviews 89: 106–116. doi:10.1016/j.rser.2018.02.025.
- Zarfl, C., A. Lumsdon, J. Berlekamp, L. Tydecks, and K. Tockner. 2015. “A Global Boom in Hydropower Dam Construction.” Aquatic Sciences 77 (1): 161–170. doi:10.1007/s00027-014-0377-0.
- Zhang, C., S. Chen, H. Qiao, L. Dong, Z. Huang, and C. Ou. 2020. “Small Hydropower Sustainability Evaluation for the Countries Along the Belt and Road.” Environmental Development 34. doi:10.1016/j.envdev.2020.100528.
- Zhang, X., H.-Y. Li, Z. Deng, C. Ringler, Y. Gao, M. Hejazi, and L. Leung. 2018. “Impacts of Climate Change, Policy and Water-Energy-Food Nexus on Hydropower Development.” Renewable Energy 116: 827–834. doi:10.1016/j.renene.2017.10.030.
- Zhang, J., C.-Y. Luo, Z. Curtis, S.-h Deng, Y. Wu, and Y.-w. Li. 2015. “Carbon Dioxide Emission Accounting for Small Hydropower Plants—A Case Study in Southwest China.” Renewable and Sustainable Energy Reviews 47: 755–761. doi:10.1016/j.rser.2015.03.027.