
 ?Mathematical formulae have been encoded as MathML and are displayed in this HTML version using MathJax in order to improve their display. Uncheck the box to turn MathJax off. This feature requires Javascript. Click on a formula to zoom.
ABSTRACT
Water hyacinth is classified as a high-risk invasive species but is a source of biomass to obtain bio-oil and biochar by pyrolysis reaction. The Kissinger- Akahira-Sunose model (KAS), Ozawa-Flynn Wall (OFW), and Friedman model, determined the pyrolysis activation energy to be 213.19 kJ mol−1, 222.55 kJ mol−1, and 248.09 kJ mol−1, respectively. Bio-oil was obtained with a 2.2% yield, and a maximum calorific value of 21,641 kJ kg−1. The composition was 44% hydrocarbons, 27% aromatic hydrocarbons, 6% alcohols and phenols, 4% acids, and 19% aldehydes, ketones, ethers, nitriles, and others. A 48.84 wt% biochar was also obtained, gaining energy and active carbon. Bio-oil could be a candidate for the production of refined chemical products.
1. Introduction
Due to the depletion of fossil fuels and the increase in greenhouse gases and other pollutants that drive climate change (Kumar et al. Citation2020), renewable energy sources such as solar, wind, and hydroelectric are becoming enormously important. Geothermal energy is highlighted, together with those derived from biomass, which has a good reputation for its abundance and carbon neutrality. It can be used to produce bioenergy and high value-added biomaterials (Chorazy et al. Citation2020). Pyrolysis of biomass involves the heating of solid biomass in an inert atmosphere to produce gaseous products, mainly carbon monoxide (CO), carbon dioxide (CO2), hydrogen (H2), methane (CH4), acetylene (C2H2), ethylene (C2H4), ethane (C2H6), benzene (C6H6), and others, liquid products (tars, hydrocarbons, and water), and solid products (biochar). Liquid products (bio-oil) are mainly composed of aliphatic and aromatic compounds with high amounts of phenol (Van de Velden et al. Citation2010).
Research has recently shown that bio-oil can be obtained by pyrolysis from different types of biomass, such as pine biomass (Tran et al. Citation2021), aquatic ferns and macroalgae (Wu et al. Citation2021), chili pepper residues (Ma et al. Citation2021), almond shells (Önal, Uzun, and Pütün Citation2014), oak, and abeo (Martin, Mullen, and Boateng Citation2014). Current alternative energy scenarios reveal that biomass is a promising approach for generating electricity, power, and heat and has become a focus of scientific research (Baloch et al. Citation2018); biomass could be used as raw material for biofuel production or a combustion process. There is a vast amount of available biomass; from this perspective, lignocellulose biomass is considered one of the most valuable and sustainable energy resources (Jahirul et al. Citation2012). Recently, it has been estimated that approximately 550 gigatons of biomass carbon are present on the planet, whereas plants contribute approximately 450 gigatons of carbon (Bar-On, Phillips, and Milo Citation2018). The existing diversity of woody, herbaceous, agricultural, aquatic, animal, human, and industrial biomass (Vassilev et al. Citation2010) guarantees its high availability.
The Fúquene lagoon is located in the department of Cundinamarca, Colombia (5°27'40.5"N 73°44'33.0"W). Its ecosystem has been altered for more than six decades by anthropic actions. Its area was approximately 10,265 ha in 1933 and 471 ha in 2015. Authors have reported that human activities have influenced the normal balance of the lagoon, turning it into an ecosystem that accumulates high concentrations of nutrients that generate eutrophication due to the proliferation of aquatic weeds such as water hyacinth (Gonzales Citation2015), which was introduced artificially (Thi Nguyen et al. Citation2015).
Water hyacinth, water lily, water violet, or nymph is one of the most invasive species, forming extensive layers on the surface (Thi Nguyen et al. Citation2015; Villamagna and Murphy Citation2010). With a fast growth rate, it covers freshwater bodies almost entirely, altering the quality and affecting the possibility of life in water (Villamagna and Murphy Citation2010). Water hyacinth is reported to have lignin, hemicellulose, and cellulose compositions of 3.5%, 48%, and 20%, respectively (Ajithram, Jappes, and Brintha Citation2021). Different applications have been evaluated for water hyacinth including fertiliser in agricultural systems (Ramirez et al. Citation2021), to produce biogas (Ganesh et al. Citation2005), biodegradable paper and animal feed (Ajithram, Jappes, and Brintha Citation2021), and even as a construction material (Philip and Rakendu Citation2020). One possibility of integrating water hyacinth into an industrial process is by using it as a raw material for the pyrolysis process.
Pyrolysis proposed to treat water hyacinth is striking because it presents a liquid conversion of approximately 44%. This liquid can be easily stored and transported (Wauton and Ogbeide Citation2022); however, this process can produce biogas and biochar, although these percentages can change according to the type of biomass and experimental conditions. Bio-oil is the main product of pyrolysis because it has been used as a source of fuels and energy. A wide range of reactor setups is necessary to improve the performance of biomass pyrolysis (Yaman Citation2004; Bridgwater and Peacocke Citation2000). However, in the case of water hyacinth, few studies have reported using this pyrolysis process. The pyrolysis of water hyacinth has been studied using and
catalysts, resulting in a bio-oil yiels of 34.4% and 26.6%, respectively (Hussain, Khadim, and Shahi Citation2016). Pyrolysis of water hyacinth without catalysts resulted in a bio-oil yield of between 15% and 44% (Wauton and Ogbeide Citation2022).
Additionally, water hyacinth is a promising material for obtaining biorefined compounds used in the chemical, pharmaceutical, and energy industries (Demirbas Citation2008; Wauton and Ogbeide Citation2021). The ONUs 2030 agenda needs new raw materials for obtaining solvents and fuels, which seeks to increase energy efficiency through advanced technologies, and less polluting fossil fuels.
This paper aims to evaluate the pyrolysis process of water hyacinth of Fúquene Lagoon using entire plants (stems, leaves, and roots) in a batch reactor for the production of bio-oil and biochar and to determine its activation energy. We are carrying out the first study of the pyrolysis of water hyacinth in Colombia, characterising bio-oil and analyzing its pyrolysis reaction.
2. Materials and methods
2.1. Collection of water hyacinth samples
The Biomass used in this study was water hyacinth (Eichhornia crassipes) extracted from Fúquene Lagoon in Colombia, latitude 5°28′0.01″ N and longitude 73°45′0″ W. Lagoon had the following environmental conditions: temperature of 11–18 °C and relative humidity of 73–92% air. A total of 20 kg of freshwater hyacinth was collected. The extracted sample was washed and stored in sealed plastic bags and transported to Universidad Santo Tomás in Bogotá, Colombia.
2.2. Preparation of water hyacinth sample
Water hyacinth samples were dried in an oven (VEB Kombinat, ref. WSU3, Germany) at 105 °C for 24 h. Subsequently, the samples were ground in a mill (Kalley, ref. K-MPA1004B01) with a 0.34 L capacity. Afterward, the particles were sieved to separate them into size ranges of (ø 850 µm – ø 601 µm) R1, (ø 600 µm – ø 301 µm) R2, (ø 300 µm – ø 151 µm) R3, and (< ø 150 µm) R4. All particles were stored in sealed plastic bags at room temperature (19 °C). Particles in the R1 range were used for the pyrolysis assays.
2.3. Chemical characterization of water hyacinth
The lignocellulosic composition of dry samples was characterised by proximate analysis and elemental analysis. Proximal analysis was performed under the Van Soest method (Van Soest, Robertson, and Lewis Citation1991). Elemental analysis of carbon (C), hydrogen (H), nitrogen (N), oxygen (O), and sulfur (S) for water hyacinth was performed under the ASTM D3178 standard (ASTM Citation2017).
Thermogravimetry was also performed in a Mettler Toledo (Switzerland) calorimetric analyzer (TGA Module). Masses between 5 and 6 mg were used in a temperature range of 30–1000 °C with heating rates of 2 °C min−1, 5 °C min−1, 7 °C min−1, 10 °C min−1, and 15 °C min−1. All samples were placed under a nitrogen environment with a flow rate of 50 mL min−1.
2.4 Pyrolysis equipment
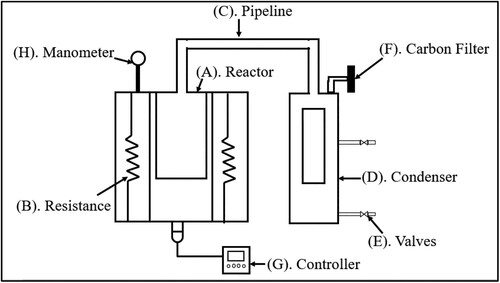
Tests were conducted in a batch pyrolyser designed by Universidad Santo Tomás, as reported previously (Londoño Feria, Nausa Galeano, and Malagón-Romero Citation2021). shows a diagram of the equipment, which has a reactor (A) made of AISI 316 stainless steel in which biomass is deposited. The pyrolyser has a capacity of 1 L and an electrical resistance around it (B) for heating (1.6 kW). Ceramic fibre insulation is provided to minimise heat loss. A pipe (C) in the upper part of the reactor allows gases to be delivered to the condenser (D), which has a capacity of 4.5 L and two ball valves (E) to control the water. In the condenser, condensable gases (bio-oil) can be collected. Noncondensable gases (biogas) cannot be collected; instead, they pass through an activated carbon filter (F). The pyrolyser has a commercial Maxthermo MC 5438 (G) controller that defines temperature, heating rate, and residence time parameters. Additionally, it has a manometer (H) to record pressure.
Figure 1. Schematic diagram of pyrolyser.
2.5 Experimental design
A factorial experimental design was conducted with two factors: temperature (°C) and heating rate (°C min−1). The temperature levels used were 450 and 600 °C, and the heating rate levels were 15 °C min−1and 30 °C min−1. For each test, 100 g of sieved biomass was used. Once the temperature selected according to the experimental design was reached, it was maintained for 3 h. As soon as this reaction time elapsed, pyrolyser was allowed to cool to room temperature (19 °C). Afterward, the reactor was opened, and the biochar and condensed products were collected to quantify the biogas produced, which was subsequently used for the analyses. Biogas was calculated by the difference in mass balance between the bio-oil and biochar. The mass yield was determined by the amount of product generated: biochar, bio-oil, and gas.
2.6 Bio-oil characterization
Bio-oil samples were characterised by calorific value analysis, chromatography analysis, and infrared analysis, as follows:
2.6.1. Calorific value analysis:
A Leco AC 350 calorimeter (United States) was used to analyze the following environmental conditions: temperature of 21.8 °C and atmospheric pressure of 0.9025 bar. The material used to calibrate the instrument was benzoic acid. Analysis was developed following the ASTM D5865/D5865M-19 standard.
2.6.3. Gas chromatography/mass spectrometry analysis (GC-MS):
Sample preparation for GC-MS analysis: Bio-oil extraction was performed by modifying the method described by Peña et al. (Gomez et al. Citation2021). A 1 mL aliquot was taken per sample and transferred to a separatory funnel. Subsequently, 20 mL of hexane was added (95% purity, J.T. Baker, Mexico). Then, it was vigorously stirred for 3 min and allowed to stand for 15 h. The organic phase was filtered through Whatman No. 1 filter paper (11 µm, with an efficiency of 98%). Then, 0.5 µL of the organic phase was diluted to 1.5 mL using hexane and passed through 0.2 µm PTFE (poly tetra-fluoro-ethylene) membrane disk filters (Pall, USA).
Chemical composition analysis: Chemical profiles of bio-oils were obtained in a gas chromatograph coupled to a mass spectrometer (Shimadzu QP-2020) equipped with a Shimadzu AOC-20i automatic injection port and a capillary column SH-Rxi-5Sil MS 30 m long, 0.25 mm ID, 0.25 μm film thickness (Restek, USA). The chromatographic conditions were as follows: injection volume of 2 µL with a division ratio of 10:1; split injection mode, injector temperature of 280 °C; helium (99.999% purity, Aga Fano, Colombia) was used as a carrier gas with a constant flow rate of 1.00 mL min− 1, purge flow of 2.0 mL min− 1, linear velocity of 36.5 cm s− 1 and, pressure of 57.5 kPa. The oven temperature was set at 60 °C for 3 min. Then, it was increased to 90 °C at a rate of 5 °C min− 1 and held for 10 min. Subsequently, it was increased to 120 °C at a rate of 10 °C min− 1 and maintained for 5 min. Finally, an additional temperature increase to 280 °C at a rate of 10 °C min− 1 was maintained for 5 min.
The mass spectrophotometry parameters were as follows: m/z 40–500 mass range, 70 eV electron impact ionisation mode. compounds were identified by comparison of their mass spectra with the NIST Library. Relative peak areas were used to determine the content of compounds.
Infrared analysis: The functional groups of the bio-oil components were determined using Agilent Cary 630 FT-IR equipment equipped with Agilent MicroLab software. The liquid transmittance measurement method was performed in this study.
2.7 Isoconversional analysis
Kinetic parameters, such as activation energy (Ea), preexponential factor (k), and reaction order (n), were determined based on thermogravimetric analysis (TGA) tests using integral and differential isoconversional methods. The activation energy of water hyacinth was determined using the Kissinger-Akahira-Sunose (KAS) and Ozawa-Flynn-Wall (OFW) models, according to the literature following the Arrhenius approximation (Baroni et al. Citation2016; Rueda et al. Citation2015) according to Equationequation (1(1)
(1) ). The adjusted model following the KAS and OFW integral method is given by equations (Equation2
(2)
(2) ) and (Equation3
(3)
(3) ), respectively (Rueda et al. Citation2015; White, Catallo, and Legendre Citation2011). In addition, the differential, isoconversional Friedman model was applied, where
is the temperature integral,
is the integrated reaction model, which was considered in this work to be represented by a first and second-order conversion function, β is the heating rate, A is the preexponential factor,
is the activation energy, R is the universal gas constant, T is the absolute temperature, and α is the conversion (Equationequation 4
(4)
(4) ).
(1)
(1)
(2)
(2)
(3)
(3)
(4)
(4)
3 Results and analysis
3.1 Characterisation of water hyacinth
shows the results of the characterisation of water hyacinth and a comparison to other studies. The present results are similar to those of another study conducted in Niger (Wauton and Ogbeide Citation2021). The cellulose content is comparable to that of a study conducted in India (Nigam Citation2002). Water hyacinth has percentages of hemicellulose and cellulose between 25-50% (Jahirul et al. Citation2012). This percentage implies low decomposition temperatures because hemicellulose and cellulose decompose in the range of 300 °C to 500 °C (Jahirul et al. Citation2012). This result was confirmed by the TGA results presented in . However, water hyacinth faces a disadvantage compared with timber, oak, pine, and cedar, which are richer in cellulose and hemicellulose (Kim et al. Citation2013). Even so, it compensates for this disadvantage by growing rapidly so it is possible to compete for an industrial process.
Table 1. Comparison of the component proximal analysis with previous studies (dry basis % by weight).
Water hyacinth, however, faces a disadvantage compared with timber, oak, pine, and cedar, which are richer in cellulose and hemicellulose (Kim et al. Citation2013). Even so, it compensates for this disadvantage by growing rapidly.
shows a comparison of elemental analysis compared with other water hyacinth studies. The elemental compositions are lower than those reported. This is attributed to the difference in the geographic location of each study (Wauton and Ogbeide Citation2022). The low concentration of sulfur reduces the combustion of toxic gases and allows consideration of a suitable raw material for the pyrolysis process (Asadullah et al. Citation2007).
Table 2. Comparison of the elemental analysis with previous studies (dry basis % by weight).
3.2 Thermogravimetry
TGA is shown in a. According to this figure, the thermal degradation of water hyacinth is divided into three main stages. The first stage is characterised by the decomposition of light hydrocarbons and the removal of remaining moisture from biomass, occurring from room temperature to 150.05 °C (Syafri et al. Citation2019). The second stage is described by the thermal degradation of hemicellulose and cellulose present in biomass (Vo et al. Citation2017; Mallick et al. Citation20AD). The highest weight loss occurred from 140.11°C to 467.59 °C. The main degradation ocurred between 300 and 350 °C, which is considered the highest peak of weight loss. The third stage is represented by the thermal degradation of lignin and heavy hydrocarbons (complex aromatic hydrocarbons) (Mallick et al. Citation20AD), which occurs from 435.4 °C to 1000 °C.
Figure 2. (a) TG and (b) DTG thermograms of the biomass obtained from water hyacinth samples at different heating rates. (c) Thermal decomposition conversion profiles of water hyacinth biomass as a function of temperature for five heating rates and (d) temperature range selected for analysis.
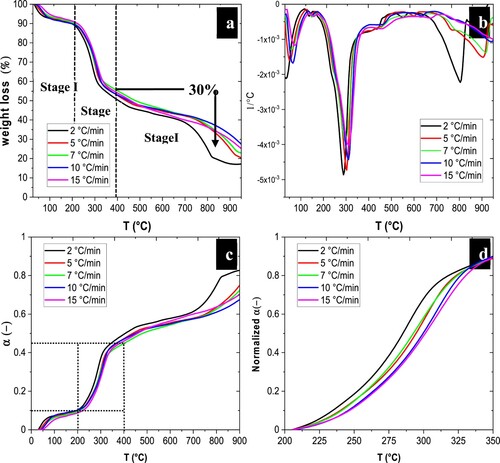
shows the temperature range and the highest weight loss at different heating rates for each stage. These results are similar to those from studies that conducted thermogravimetry with water hyacinth. Compared with the second stage (the most important stage in which the highest percentage of mass loss occurs), the results present a 40–50% mass loss in the second stage between 175 and 450 °C with heating rates of 10 °C min−1, 15 °C min−1, 20 °C min−1, and 30 °C min−1 (Mallick et al. Citation20AD). This study reported that after 400 °C, lignin decomposition begins up to 900 °C with an approximate mass loss of 20%.
Table 3. Temperature range and weight loss for water hyacinth thermogravimetric stages. It: Initial temperature, Ft: Final temperature.
The obtained results were valuable compared to those reported (Alves et al. Citation2019), where a mass loss of 24–29% in the second stage of degradation between 271 and 394 °C with heating rates of 5 °C min−1, 10 °C min−1, 20 °C min−1, 30 °C min−1, 40 °C min−1, and 50 °C min−1 was obtained (Alves et al. Citation2019). Additionally, lignin decomposition in the temperature range between 400 and 605 °C with a mass loss of approximately 12% to 14% was reported in the third stage. These results established that pyrolysis performance should occur at temperatures above 400 °C.
3.3 Fitting of isoconversional model
For the application of the isoconversional models, experimental data were adjusted to kinetic study using the equations proposed by Kissinger-Akahira-Sunose (KAS) (Equationequation 1(1)
(1) and Equationequation 2
(2)
(2) ) and Ozawa-Flynn-Wall (OFW) (Equationequation 3
(3)
(3) ) to estimate the activation energy (E) and the preexponential factor (A) from the TG analysis (Baroni et al. Citation2016; Rueda et al. Citation2015). A Friedman differential method is also used to validate the activation energies that were found (Equationequation 4
(4)
(4) ). a-b shows the thermal decomposition (TG) in weight loss percentage and the differential thermogravimetric (DTG) profiles of water hyacinth. From decomposition profiles, the main events and temperatures can be observed. At 100 °C, evaporated water and the primary volatiles formed. Degradation of cellulose, hemicellulose, and lignin occurred from 200 °C to 400 °C, along with other secondary volatiles. Over 600 °C, gas and biochar are generated with other polymerisation reactions (Bar-On, Phillips, and Milo Citation2018; Telfer, Heidenreich, and Zhang Citation1999).
The reaction is faster, as the temperature of decomposition tends to increase. b-c presents the normalised conversion profiles for analysis and the temperature range selected (200–400 °C). Based on the conversion mass loss curve thermal decomposition can be divided into three major events. Ranges of temperature between room temperature and approximately 100–200 °C for the first decomposition event, 200 °C to 400 °C for the second event, and 400 °C to 900 °C for the third decomposition event. provides a percentage of variations for the five heating rates in relation to these three decomposition events. Decomposition began with the release of water and extractives, which can also be seen as the first peak on the DTG curve. The second event produced the highest peak during the conversion mass. Hence, they were associated with the decomposition of hemicellulose, cellulose, and lignin (second and third peaks in DTG). Although lignin has a wider range of thermal stability, that is, it continues to decompose at temperatures higher than 500 °C, the third decomposition event was due to the decomposition of these intermediate lignin compounds and to the recombination of gaseous, liquid, and solid products.
shows the linearisation graphs for obtaining activation energy for the KAS and OFW models. Both models are marked by the parallelism between linear regressions obtained at each conversion level, as expected from the isoconversional models (Baroni et al. Citation2016). Likewise, shows the calculated conversion and temperatures in applying the isoconversional models.
Figure 3. Application of the KAS (a), OFW (b), and Friedman (c) isoconversion methods to obtain the activation energy Ea.
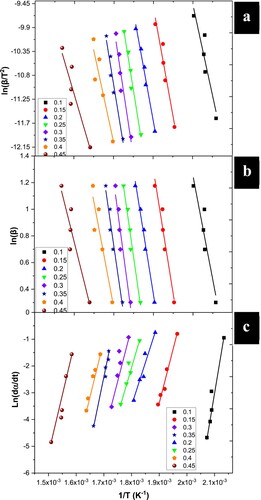
Table 4. Calculated temperature conversion for application of the isoconversional methods at different heating rates.
shows the activation energy as a function of conversion. shows the averages of the calculated parameters and their activation energy for each of the isoconversional models. Compared with other studies, the activation energy obtained using the OFW method is slightly lower, as it is reported to be 105.74 kJ mol−1 (Alves et al. Citation2019). However, the activation energy obtained using the KAS method is higher than in other reports (101.17 kJ mol−1)(Alves et al. Citation2019). Compared to the OFW and KAS methods, the Friedman method led to higher values of Ea, with a difference of 10–14%.
Figure 4. Activation energy as a function of conversion for the KAS and OFW models.
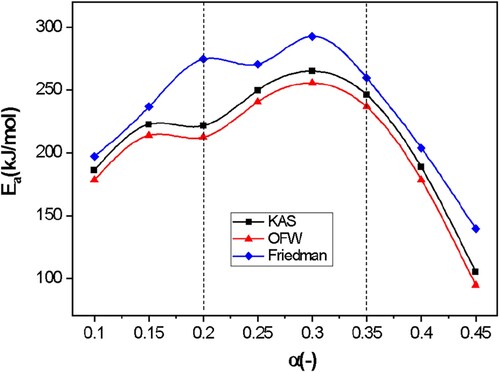
Table 5. Means of parameters calculated for each isoconversional method studied throughout the pyrolysis process.
In this way, the activation energy necessary for the system to start the thermal degradation reaction of the water hyacinth was obtained, specifically of hemicellulose and cellulose in the range of 200 °C to 400 °C. In addition, it was shown that by the OFW method, water hyacinth has higher activation energy values than algae such as Wolffia arrhiza (168.35 kJ mol−1) and Gracilaria lemaneiformis (153.79 kJ mol−1) (Alves et al. Citation2019). Similarly, the cost of the pyrolysis process is directly proportional to the activation energy required. Hence, a low activation energy value means a lower cost. Therefore, water hyacinth has better applicability than previously mentioned algae (Alves et al. Citation2019; Mallick et al. Citation20AD). Other comparisons are presented in .
Table 6. Comparison of water hyacinth from the present work with other biomass types.
3.4 Performance of pyrolysis products
shows the performance of biochar, bio-oil, and gas obtained with two temperatures and different heating rates in the pyrolysis equipment. Most products are gas, followed by biochar; bio-oil content is the lowest for all experiments. The best bio-oil performance was achieved at 450 °C (2.2%) with a 30 °C min−1 rate. This result is close to the TGA result (a), where the best thermal degradation occurred in a range of temperatures close to 200 °C to 400 °C. The highest thermal degradation peak was in the range of 300 °C to 350 °C (b).
Table 7. Pyrolysis performance, P-value of ANOVA statistical analysis and higher heating value of bio-oil for each of the tests.
On the other hand, the principal pyrolysis product was biochar; the best yield was 46.09% at 450 and 15 °C min−1. This result was different than that of TGA due to the scale-up and design of the pyrolysis equipment. Mass and heat transfer are important in pyrolysis industrial equipment, but at the TGA level, the process is not limited by these aspects. For pyrolysis equipment, the heating rate affects the conversion of biomass so an increase in the heating rate results in a decrease in the yield of charcoal. The period of rapid decomposition of biomass occurred at higher temperatures, and the onset of decomposition also occurred at higher temperatures. These results indicate that low heating rates favour low-temperature charcoal formation reactions, and initial charcoal acts as a catalyst for the primary decomposition of biomass. Lower heating rates are also associated with higher retention of pyrolysis vapours in biomass, resulting in a higher secondary charcoal production and higher charcoal yield (Telfer, Heidenreich, and Zhang Citation1999).
The effect of final temperature is similar to that reported in the literature where the best range of thermal degradation of TGA is between 200 and 450 °C for water hyacinth (Mallick et al. Citation20AD); in this sense, the result does not show a significant difference from previous reports. Compared to other studies, the bio-oil yield is low. Other studies conducted in Nigeria present a bio-oil yield of 44.5% at a temperature of 450 °C with a heating ramp of 50 °C min−1 and a nitrogen flow rate of 100 cm3 min−1, in which 15 g of water hyacinth (only stems and leaves) was used in a fluidised bed reactor (Wauton and Ogbeide Citation2022).
The principal difference between (Wauton and Ogbeide Citation2022) and the current study is the type of reactor because we use a batch reactor. The fact that they used only stems and leaves possibly has an impact because those specific parts of water hyacinth have higher percentages of hemicellulose and cellulose. In this research, roots were also used, having a high percentage of lignin, which degrades at temperatures above 500 °C. Similarly, the use of carrier gas and its speed improve the thermal degradation conditions of biomass (Somerville and Deev Citation2020). Furthermore, other studies in Pakistan used catalysts to improve the pyrolysis conditions of water hyacinth; Fe and CaCO3 catalysts resulted in bio-oil yields of 34.4% and 26.6%, respectively (Hussain, Khadim, and Shahi Citation2016). It was possible to determine that the P-value for each test was > 0.05 through the analysis of variance (ANOVA) (Dagnino S Citation2014), as shown in . Minimum differences between the factorial type tests were found.
The yield of bio-oil was lower than that in other studies. Environmental problems could be solved by the production of biochar. The results of this study show that water hyacinth is an ideal raw material for the production of biochar in the circular economy. By adsorbing chemical compounds, biochar has the potential to treat soil, water, and air. Fúquene Lagoon could benefit from pyrolysis for water recovery.
3.5 Characterisation of bio-oil
Calorific value, chromatography, and infrared techniques were used to characterise the bio-oil samples. For higher heating values, the results of this analysis can be seen in . Bio-oils have higher heating values, so they have applications as energy sources or chemical products. The results of the calorific values of pyrolytic oils are within the range of 13.10–31.4 MJ.kg−1 (Onay, Beis, and Koçkar Citation2004; Uddin, Joardder, and Islam Citation2012). Furthermore, these results are similar to those reported in the study by Wauton & Ogbeide (Wauton and Ogbeide Citation2022), who obtained a maximum calorific value of bio-oil of 28,350 kJ.kg−1 (Wauton and Ogbeide Citation2022). Gulab (Hussain, Khadim, and Shahi Citation2016) reported a bio-oil with a value of 14,218 kJ.kg−1 when using a Fe catalyst, 14,785 kJ.kg−1 with a catalyst, and finally, 15,672 kJ.kg−1 without any catalyst (Hussain, Khadim, and Shahi Citation2016).
Fourier transform infrared (FTIR) spectra of the bio-oil are shown in . The spectrum shows the functional group constituents of the bio-oil, which are shown in . Physico-chemical FTIR studies of corn cob bio-oil (Demiral, Eryazici, and Şensöz Citation2012), whose analysis shows a high abundance of oxygenated compounds, show a similarity in O – H stretching vibrations between 3200 and 3600 cm–1 of hyacinth bio-oil, which indicates the presence of phenols and alcohols. Other infrared reports indicate a high-intensity band for the bio-oil obtained from water hyacinth (Wauton and Ogbeide Citation2021).
Figure 5. FTIR spectrum of the water hyacinth bio-oil.
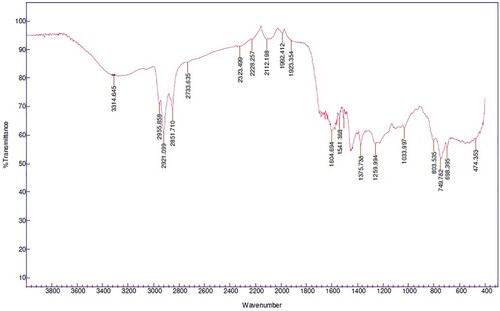
Table 8. Leading bands found in the typical infrared spectrum for bio-oil components.
In addition, shows the presence of alkanes, with peak absorbance of the C–H vibrations between 2800 cm–1 and 3000 cm– 1. Bands between 1350 cm–1 and 1475 cm− 1 correspond to C–H bending. The stretching vibrations between 1650 cm–1 and 1780cm − 1 indicated the presence of ketones, aldehydes, and carboxylic acids with an absorbance of the functional group C = O (Gomez-Serrano et al. Citation1996). The absorbance peaks between 1590 cm–1 and 1630 cm− 1 indicated the presence of alkenes and aromatics. Peaks between 900 cm–1 and 1300 cm− 1 are due to primary, secondary, and tertiary alcohols and phenols. In addition, they demonstrate C–O stretching and O-H bending and many well-defined bands observed in the spectrum of the cashew nut bio-oil (Das, Sreelatha, and Ganesh Citation2004). Likewise, absorption peaks between 650–900 cm–1 and 1420–1610 cm− 1 indicate mono-, polycyclic, and substituted aromatic groups. Water hyacinth bio-oil bond intensities C = O and O-H were smooth; this result has been reported for olive bagasse bio-oil, presenting an FTIR spectrum with sharper bands (Şensöz, Demiral, and Gerçel Citation2006).
Information obtained by FTIR is consistent. However, it does not specifically identify the bio-oil compounds. Therefore, a gas chromatography analysis coupled with mass spectrometry is necessary to identify the volatile and semivolatile fractions of bio-oil.
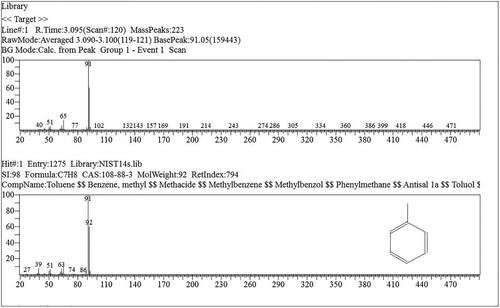
GC-MS was used to analyse the compositions of the pyrrolizidine alkaloid (PA) extracts of water hyacinth to identify hydrocarbons, alcohols, and acids. Its carboxyl and hydroxyl groups are involved in esterification processes during pyrolytic reactions. The relative contents of compounds were determined using the area normalisation method. shows the chromatogram with the number of components detected. The results were accepted when a match > 90% was obtained with the NIST library database of the mass spectrometer. shows, as an example, the mass spectrum of toluene, peak number 1, with a similarity index of 98%.
Figure 6. Typical chromatogram of water hyacinth bio-oil.
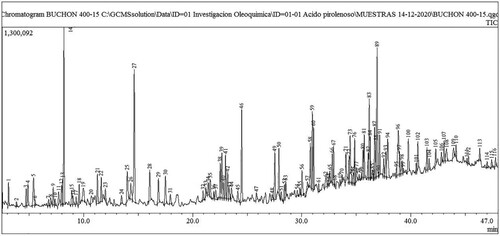
Figure 7. Mass spectrum of toluene.
Similarly, presents the detailed composition for the four main compounds (aromatics, hydrocarbons, alcohols, and acids) found by gas chromatography-mass spectrometry.
Table 9. Chemical compounds found in the water hyacinth bio-oil classified into its main families of functional groups (aromatics, hydrocarbons, alcohols and acids).
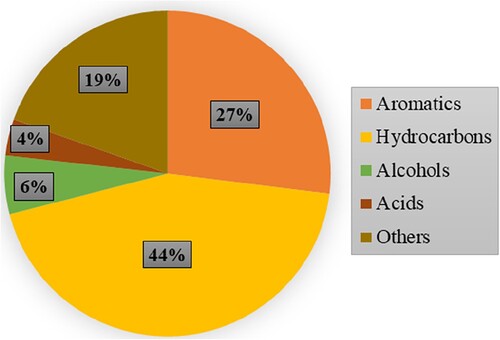
shows that most water hyacinth bio-oil components are made up of linear and derivative hydrocarbons (44%), followed by aromatic hydrocarbons (27%), alcohols (including phenols) (6%), and acids (4%). Other compounds (19%) are aldehydes, ketones, ethers, and nitriles.
Figure 8. Total percentage of the main functional groups from water hyacinth pyrolysis bio-oil.
According to previous studies, the thermal degradation characteristics of wood materials or plants are strongly influenced by their chemical composition (cellulose, hemicellulose, and lignin). For instance, from materials rich in cellulose, levoglucosan is obtained as the main reaction product from pyrolysis between 289°C and 314°C, for which a kinetic model has been developed (Bradbury, Sakai, and Shafizadeh Citation1979). The biomass that undergoes pyrolytic reactions at high temperatures forms different compounds such as saccharides, including cellulose, hemicellulose, and pectin, which degrade thermally to ketones, alcohols, furan, and pyran derivatives. However, lignin is converted into phenol, guaiacol, syringol, pyrocatechol, and their derivatives, which dissolve in the bio-oil layer (Ma et al. Citation2014).
This study demonstrated that the most apparent change during the pyrolysis of bio-oil compounds was the decrease in carboxylic acids that react with hydroxyl groups to give an appreciable number of esters. The reported reaction changed the concentration from 32% to 2.11% at 600 °C and disappeared at 700 °C (Cao et al. Citation2021). The present research, conducted with water hyacinth as the raw material, reported the reaction at 400 °C, indicating a high proportion of fatty acids and alcohols. Another possible way of converting the carboxylic acid should be the decarboxylation reaction, which results in hydrocarbons. Abundant compounds are in the bio-oil from water hyacinth (Wang et al. Citation2018). Neophytadiene is a typical compound of bio-oil produced from microalgae that are very rich in chlorophyll (Cao et al. Citation2021). The studied sample presented 1.98% neophytadiene from water hyacinth bio-oil.
In general, water hyacinth bio-oil composition is different from wood or other biomass due to its high content of linear and aromatic hydrocarbons compared to bio-oils richer in phenolic compounds, for example, in the bio-oil of Guadua angustifolia (Gomez et al. Citation2021) or of oak, pine, and cedar (Kim et al. Citation2013). Therefore, water hyacinth is an appropriate raw material for generating new compounds under the biorefinery model.
4. Conclusions
Water hyacinth has been a significant problem in rivers and lagoons worldwide. One solution for this problem is to use it as a raw material for bio-oil, biogas, and biochar. Integration of this raw material in a circular economy model could be a solution for rivers and lagoons. The results obtained in this paper showed that the principal product was biochar (48.84%) at 450 °C and a heating rate of 15 °C min−1, so this result confirms the possibility of using water hyacinth to obtain energy or activated carbon for soil recovery in the surroundings of the Fúquene lagoon. However, the production of bio-oil could be optimised with catalysts and other heating rates, and the possibility of integrating water hyacinth in a production process results in a solution for this lagoon in Colombia. It is possible to minimise the production of biochar by using a catalyst or redesigning the pyrolysis equipment to enhance mass and heat transfer.
Recommendation
For future research, it is recommended to use catalysts.
Declaration of Conflict of Interest
The authors do not express a conflict of interest in this research and publication.
Acknowledgments
The authors thank the Universidad Santo Tomás for funding the research, through the call for project funding in 2021, and the Technological University of Pereira for supporting the IR and GC-MS tests.
Disclosure statement
No potential conflict of interest was reported by the author(s)).
References
- Ajithram, A., J. T. W. Jappes, and N. C. Brintha. 2021a. “Investigation on Utilization of Water Hyacinth Aquatic Plants Towards Various Bio Products - Survey.” Materials Today: Proceedings 45: 2040–2045. doi: 10.1016/j.matpr.2020.09.498.
- Ajithram, A., J. T. W. Jappes, and N. C. Brintha. 2021b. “Water hyacinth (Eichhornia crassipes) Natural Composite Extraction Methods and Properties - A Review.” Materials Today: Proceedings 45: 1626–1632. doi: 10.1016/j.matpr.2020.08.472.
- Alhumade, H., Jean Constantino Gomes da Silva, Muhammad Sajjad Ahmad, Gülce Çakman, Ağah Yıldız, Selim Ceylan, and Ali Elkamel. 2019. “Investigation of Pyrolysis Kinetics and Thermal Behavior of Invasive Reed Canary (Phalaris arundinacea) for Bioenergy Potential.” Journal of Analytical and Applied Pyrolysis 140: 385–392. doi: 10.1016/J.JAAP.2019.04.018.
- Alves, J. L. F., J. C. Gomes da Silva, V. F. Da Silva Filho, R. F. Alves, W. V. De Araujo Galdino, and R. F. De Sena. 2019. “Kinetics and Thermodynamics Parameters Evaluation of Pyrolysis of Invasive Aquatic Macrophytes to Determine Their Bioenergy Potentials.” Biomass and Bioenergy 121: 28–40. doi: 10.1016/j.biombioe.2018.12.015.
- Asadullah, M., M. A. Rahman, M. M. Ali, M. S. Rahman, M. A. Motin, M. B. Sultan, and M. R. Alam. 2007. “Production of Bio-Oil from Fixed Bed Pyrolysis of Bagasse.” Fuel 86 (16): 2514–2520. doi: 10.1016/j.fuel.2007.02.007.
- ASTM. 2017. “Standard Test Method for Carbon and Hydrogen in the Analysis Sample of Refuse-Derived Fuel.” West Conshohocken, doi: 10.1520/E0777-17A.
- Baloch, H., N. Sabzoi, M. T. Siddiqui, S. Riaz, A. Jatoi, and D. Dumbre. 2018. “Recent Advances in Production and Upgrading of Bio-Oil from Biomass: A Critical Overview.” Journal of Environmental Chemical Engineering 6 (4): 5101–5118. doi:10.1016/j.jece.2018.07.050.
- Bar-On, Y. M., R. Phillips, and R. Milo. 2018. “The Biomass Distribution on Earth.” Proceedings of the National Academy of Sciences 115 (25): 6506–6511. doi: 10.1073/pnas.1711842115.
- Baroni, ÉDG, K. Tannous, Y. J. Rueda-Ordóñez, and L. K. Tinoco-Navarro. 2016. “The Applicability of Isoconversional Models in Estimating the Kinetic Parameters of Biomass Pyrolysis.” Journal of Thermal Analysis and Calorimetry 123 (2): 909–917. doi: 10.1007/s10973-015-4707-9.
- Bradbury, A. G. W., Y. Sakai, and F. Shafizadeh. 1979. “A Kinetic Model for Pyrolysis of Cellulose.” Journal of Applied Polymer Science 23 (11): 3271–3280. doi: 10.1002/app.1979.070231112.
- Bridgwater, A. V., and G. V. C. Peacocke. 2000. “Fast Pyrolysis Processes for Biomass.” Renewable and Sustainable Energy Reviews 4 (1): 1–73. doi: 10.1016/S1364-0321(99)00007-6.
- Cao, B., Jianping Yuan, Ding Jiang, Shuang Wang, Bahram Barati, Yamin Hu, Chuan Yuan, Xun Gong, and Qian Wang. 2021. “Seaweed-Derived Biochar with Multiple Active Sites as a Heterogeneous Catalyst for Converting Macroalgae into Acid-Free Biooil Containing Abundant Ester and Sugar Substances.” Fuel 285: 119164. doi: 10.1016/j.fuel.2020.119164.
- Chorazy, T., J. Čáslavský, V. Žvaková, J. Raček, and P. Hlavínek. 2020. “Characteristics of Pyrolysis Oil as Renewable Source of Chemical Materials and Alternative Fuel from the Sewage Sludge Treatment.” Waste and Biomass Valorization 11 (8): 4491–4505. doi: 10.1007/s12649-019-00735-5.
- Dagnino S, J. 2014. “Análisis de varianza.” Revista Chilena de Anestesia 43 (4): 306–310.
- Das, P., T. Sreelatha, and A. Ganesh. 2004. “Bio oil from Pyrolysis of Cashew Nut Shell-Characterisation and Related Properties.” Biomass and Bioenergy 27 (3): 265–275. doi: 10.1016/j.biombioe.2003.12.001.
- Demiral, I., A. Eryazici, and S. Şensöz. 2012. “Bio-Oil Production from Pyrolysis of Corncob (Zea mays L.).” Biomass and Bioenergy 36: 43–49. doi: 10.1016/j.biombioe.2011.10.045.
- Demirbas, A. 2008. “Biofuels Sources, Biofuel Policy, Biofuel Economy and Global Biofuel Projections.” Energy Conversion and Management 49: 2106–2116. doi: 10.1016/j.enconman.2008.02.020.
- Ganesh, P. S., E. V. Ramasamy, S. Gajalakshmi, and S. A. Abbasi. 2005. “Extraction of Volatile Fatty Acids (VFAs) from Water Hyacinth Using Inexpensive Contraptions, and the Use of the VFAs as Feed Supplement in Conventional Biogas Digesters with Concomitant Final Disposal of Water Hyacinth as Vermicompost.” Biochemical Engineering Journal 27 (1): 17–23. doi: 10.1016/j.bej.2005.06.010.
- Gomez-Serrano, V., J. Pastor-Villegas, A. Perez-Florindo, C. Duran-Valle, and C. Valenzuela-Calahorro. 1996. “FT-IR Study of Rockrose and of Char and Activated Carbon.” Journal of Analytical and Applied Pyrolysis 36 (1): 71–80. doi: 10.1016/0165-2370(95)00921-3.
- Gomez, J. P., J. P. A. Velez, M. A. Pinzon, J. A. M. Arango, and A. P. Muriel. 2021. “Chemical Characterization and Antiradical Properties of Pyroligneous Acid from a Preserved Bamboo, Guadua Angustifolia Kunth.” Brazilian Archives of Biology and Technology 64), doi: 10.1590/1678-4324-2021190730.
- Gonzales, N. 2015. Análisis Multitemporal Del Espejo De Agua En La Laguna De Fúquene Para El Periodo De 1985 A 2015.
- Hu, Z., X. Ma, and L. Li. 2015. “Optimal Conditions for the Catalytic and Non-Catalytic Pyrolysis of Water Hyacinth.” Energy Conversion and Management 94: 337–344. doi: 10.1016/j.enconman.2015.01.087.
- Hussain, M., Gulab. Khadim, and Hussain. Shahi. 2016. “Catalytic Co-pyrolysis of Eichhornia Crassipes Biomaѕѕ and Polyethylene Using Waste Fe and CaCO3 Catalysts.” International Journal of Energy Research, doi: 10.1002/er.
- Jahirul, M., M. Rasul, A. Ahmed, and N. Ashwath. 2012. “Biofuels Production Through Biomass Pyrolysis —A Technological Review.” Energies 5 (12): 4952–5001. doi:10.3390/en5124952.
- Kim, K. H., Tae-Seung Kim, Soo-Min Lee, Donha Choi, Hwanmyeong Yeo, In-Gyu Choi, and Joon Weon Choi. 2013. “Comparison of Physicochemical Features of Biooils and Biochars Produced from Various Woody Biomasses by Fast Pyrolysis.” Renewable Energy 50: 188–195. doi: 10.1016/j.renene.2012.06.030.
- Kumar, R., V. Strezov, H. Weldekidan, J. He, S. Singh, T. Kan, and B. Dastjerdi. 2020. “Lignocellulose Biomass Pyrolysis for Bio-Oil Production: A Review of Biomass Pre-Treatment Methods for Production of Drop-in Fuels.” Renewable and Sustainable Energy Reviews 123), doi: 10.1016/j.rser.2020.109763.
- Londoño Feria, J. M., G. Nausa Galeano, and D. H. Malagón-Romero. 2021. “Production of Bio-Oil from Waste Cooking Oil by Pyrolysis.” Chemical Engineering & Technology 44 (12): 2341–2346. doi: 10.1002/ceat.202100018.
- Ma, Y., H. Bao, X. Hu, R. Wang, and W. Dong. 2021. “Productions of Phenolic Rich Bio-Oil Using Waste Chilli Stem Biomass by Catalytic Pyrolysis: Evaluation of Reaction Parameters on Products Distributions.” Journal of the Energy Institute 97: 233–239. doi: 10.1016/j.joei.2021.05.004.
- Ma, C., W. Li, Y. Zu, L. Yang, and J. Li. 2014. “Antioxidant Properties of Pyroligneous Acid Obtained by Thermochemical Conversion of Schisandra Chinensis Baill.” Molecules 19 (12): 20821–20838. doi: 10.3390/molecules191220821.
- D. Mallick, B. J. Bora, D. Baruah, S. A. Barbhuiya, R. Banik, and J. Garg. 20AD “Mechanistic investigation and thermal degradation of Eichhornia crassipes using Thermogravimetric analysis,” SSRN, pp. 1–28.
- Martin, J. A., C. A. Mullen, and A. A. Boateng. 2014. “Maximizing the Stability of Pyrolysis Oil/Diesel Fuel Emulsions.” Energy & Fuels 28 (9): 5918–5929. doi: 10.1021/ef5015583.
- Nigam, J. N. 2002. “Bioconversion of Water-Hyacinth (Eichhornia Crassipes) Hemicellulose Acid Hydrolysate to Motor Fuel Ethanol by Xylose-Fermenting Yeast.” Journal of Biotechnology 97 (2): 107–116. doi: 10.1016/S0168-1656(02)00013-5.
- Önal, E., B. B. Uzun, and A. E. Pütün. 2014. “Bio-Oil Production Via Co-pyrolysis of Almond Shell As Biomass and High Density Polyethylene.” Energy Conversion and Management 78: 704–710. doi: 10.1016/j.enconman.2013.11.022.
- Onay, Ö, S. H. Beis, and ÖM Koçkar. 2004. “Pyrolysis of Walnut Shell in a Well-Swept Fixed-Bed Reactor.” Energy Sources 26 (8): 771–782. doi: 10.1080/00908310490451402.
- Philip, S., and R. Rakendu. 2020. “Thermal Insulation Materials Based on Water Hyacinth for Application in Sustainable Buildings.” Materials Today: Proceedings 33: 3803–3809. doi: 10.1016/j.matpr.2020.06.219.
- Plis, A., J. Lasek, and A. Skawińska. 2017. “Kinetic Analysis of the Combustion Process of Nannochloropsis Gaditana Microalgae Based on Thermogravimetric Studies.” Journal of Analytical and Applied Pyrolysis 127: 109–119. doi: 10.1016/J.JAAP.2017.08.017.
- Ramirez, A., S. Pérez, E. Flórez, and N. Acelas. 2021. “Utilization of Water Hyacinth (Eichhornia Crassipes) Rejects as Phosphate-Rich Fertilizer.” Journal of Environmental Chemical Engineering 9 (1), doi: 10.1016/j.jece.2020.104776.
- Rueda-Ordoñez, Y. J., and K. Tannous. 2015. “Isoconversional Kinetic Study of the Thermal Decomposition of Sugarcane Straw for Thermal Conversion Processes.” Bioresource Technology 196: 136–144. doi: 10.1016/j.biortech.2015.07.062.
- Y. Rueda, L. Tinoco, É. Godois, and K. Tannous, “Modeling the Kinetics of Lignocellulosic Biomass Pyrolysis,” in Katia Tannous Innovative Solutions in Fluid-Particle Systems and Renewable Energy Management, IGI Global pp. 92–130, 2015, doi: 10.4018/978-1-4666-8711-0.
- Şensöz, S., I. Demiral, and H. F. Gerçel. 2006. “Olive Bagasse (Olea europea L.) Pyrolysis.” Bioresource Technology 97 (3): 429–436. doi: 10.1016/j.biortech.2005.03.007.
- Somerville, M., and A. Deev. 2020. “The Effect of Heating Rate, Particle Size and Gas Flow on the Yield of Charcoal During the Pyrolysis of Radiata Pine Wood.” Renewable Energy 151 (xxxx): 419–425. doi: 10.1016/j.renene.2019.11.036.
- Syafri, E., Sudirman, Mashadi, Evi Yulianti, Deswita, Mochamad Asrofi, Hairul Abral, et al. 2019. “Effect of Sonication Time on the Thermal Stability, Moisture Absorption, and Biodegradation of Water Hyacinth (Eichhornia crassipes) Nanocellulose-Filled Bengkuang (Pachyrhizus erosus) Starch Biocomposites.” Journal of Materials Research and Technology 8 (6): 6223–6231. doi: 10.1016/j.jmrt.2019.10.016.
- Telfer, M. A., C. A. Heidenreich, and D. K. Zhang. 1999. “The Effect of Particle Size and Heating Rate on the Transformation of Sulphur during Pyrolysis of a South Australian Low-rank Coal.” Developments in Chemical Engineering and Mineral Processing 7 (3): 409–426. doi: 10.1002/apj.5500070312.
- Thi Nguyen, T. H., Pieter Boets, Koen Lock, Minar Naomi Damanik Ambarita, Marie Ane Eurie Forio, Peace Sasha, Luis Elvin Dominguez-Granda, Thu Huong Thi Hoang, Gert Everaert, and Peter L.M. Goethals. 2015. “Habitat Suitability of the Invasive Water Hyacinth and Its Relation to Water Quality and Macroinvertebrate Diversity in a Tropical Reservoir.” Limnologica 52: 67–74. doi: 10.1016/j.limno.2015.03.006.
- Tran, Q. K., M. L. Le, H. V. Ly, H. C. Woo, J. Kim, and S. S. Kim. 2021. “Fast Pyrolysis of Pitch Pine Biomass in a Bubbling Fluidized-Bed Reactor for Bio-Oil Production.” Journal of Industrial and Engineering Chemistry 98: 168–179. doi: 10.1016/j.jiec.2021.04.005.
- Uddin, M., M. U. H. Joardder, and M. N. Islam. 2012. “Design and Construction of Fixed Bed Pyrolysis System and Plum Seed Pyrolysis for Bio-Oil Production.” International Journal of Renewable Energy Research 1 (7): 405–409.
- Van de Velden, M., J. Baeyens, A. Brems, B. Janssens, and R. Dewil. 2010. “Fundamentals, Kinetics and Endothermicity of the Biomass Pyrolysis Reaction.” Renewable Energy 35 (1): 232–242. doi: 10.1016/j.renene.2009.04.019.
- Van Soest, P. J., J. B. Robertson, and B. A. Lewis. 1991. “Methods for Dietary Fiber, Neutral Detergent Fiber, and Nonstarch Polysaccharides in Relation to Animal Nutrition.” Journal of Dairy Science 74: 3583–3597. doi:10.3168/jds.S0022-0302(91)78551-2.
- Vassilev, S. V., D. Baxter, L. K. Andersen, and C. G. Vassileva. 2010. “An Overview of the Chemical Composition of Biomass.” Fuel 89 (5): 913–933. doi: 10.1016/j.fuel.2009.10.022.
- Villamagna, A. M., and B. R. Murphy. 2010. “Ecological and Socio-Economic Impacts of Invasive Water Hyacinth (Eichhornia crassipes): A Review.” Freshwater Biology 55 (2): 282–298. doi: 10.1111/j.1365-2427.2009.02294.x.
- Vo, T. K., Hoang Vu Ly, Ok Kyung Lee, Eun Yeol Lee, Chul Ho Kim, Jeong-Woo Seo, Jinsoo Kim, and Seung-Soo Kim. 2017. “Pyrolysis Characteristics and Kinetics of Microalgal Aurantiochytrium sp. KRS101.” Energy 118: 369–376. doi: 10.1016/j.energy.2016.12.040.
- Wang, S., Bin Cao, Xinlin Liu, Lujiang Xu, Yamin Hu, Stephen Afonaa-Mensah, Abd El-Fatah Abomohra, Zhixia He, Qian Wang, and Shannan Xu. 2018. “A Comparative study on the Quality of Bio-Oil Derived from Green Macroalga Enteromorpha Clathrata Over Metal Modified ZSM-5 Catalysts.” Bioresource Technology 256: 446–455. doi: 10.1016/j.biortech.2018.01.134.
- Wauton, I., and S. E. Ogbeide. 2021. “Characterization of Pyrolytic Bio-Oil from Water Hyacinth (Eichhornia crassipes) Pyrolysis in a Fixed Bed Reactor.” Biofuels 12 (8): 899–904. doi: 10.1080/17597269.2018.1558838.
- Wauton, I., and S. E. Ogbeide. 2022. “Investigation of the Production of Pyrolytic Bio- Oil from Water Hyacinth (Eichhornia crassipes) in a Fixed Bed Reactor Using Pyrolysis Process.” Biofuels 13 (2): 189–195. doi: 10.1080/17597269.2019.1660061.
- White, J. E., W. J. Catallo, and B. L. Legendre. 2011. “Biomass Pyrolysis Kinetics: A Comparative Critical Review with Relevant Agricultural Residue Case Studies.” Journal of Analytical and Applied Pyrolysis 91 (1): 1–33. doi: 10.1016/j.jaap.2011.01.004.
- Wu, P., Xia Zhang, Jing Wang, Jia Yang, Xuanwei peng, Li Feng, Bo Zu, Yudong Xie, and Mengke Li. 2021. “Pyrolysis of Aquatic Fern and Macroalgae Biomass Into Bio-Oil: Comparison and Optimization of Operational Parameters Using Response Surface Methodology.” Journal of the Energy Institute 97: 194–202. doi: 10.1016/j.joei.2021.04.010.
- Yaman, S. 2004. “Pyrolysis of Biomass to Produce Fuels and Chemical Feedstocks.” Energy Conversion and Management 45 (5): 651–671. doi: 10.1016/S0196-8904(03)00177-8.