
 ?Mathematical formulae have been encoded as MathML and are displayed in this HTML version using MathJax in order to improve their display. Uncheck the box to turn MathJax off. This feature requires Javascript. Click on a formula to zoom.
ABSTRACT
The overwhelming effects of climate change on the living environments has prompted several countries, including India into rolling out different carbon neutrality agenda. On this background, this study activated policy framework towards the attainment of India’s 2070 net-zero emission target via energy efficiency. The roles of green-technology, affluence and population were also rectified. With quarterly series spanning 1997Q1–2021Q4 and estimates of the novel wavelet quantile correlation technique, the following insights sufficed. Energy-intensity generated significant carbon de-escalation effects mainly in the medium and long term. There were evidence of long-term asymmetric effects between them. Carbon intensity as well as green technology aggravated carbon emissions in both short and medium term, however, over the long term, they generated carbon neutrality effects. The empirical estimates also validated the environmental Kuznets curve (EKC) ideology given the long-term environmental quality enhancing attributes of GDP. India’s population represents a major challenge for the net-zero emission target. But this can be curtailed through adequate orientations as prescribed in the LiFE progrmme. Among other considerations, India’s net-zero target is realisable if the country extends its low-carbon energy profiles and deploy more green technologies.
1. Introduction
Several experts within the field of environmental economics and environmental science are currently providing appreciable empirical narratives pertaining to climate change mitigation strategies. The plausibility of such empirical inferences and its consequential policy guidelines are highly acknowledged considering the current state of global warming and environmental decay. Regrettably, climate change and environmental pollution are observed in all global economies. Both developed and developing countries are all saddled with certain degrees of environmental challenges. However, an obvious fact remains that some countries are more prone to climate change than others, which can be explained by several factors. Accordingly, the state of technology, economic expansions, environmental protocols, energy policies, population, finance, urbanisation, among others have been identified as factors shaping the degree and nature of climate change in different countries (Opuala, Omoke, and Uche Citation2023; Sharif et al. Citation2023; Su et al. Citation2023; Uche et al. Citation2023).
In a bid to cultivate clean environment, India recently set for itself an ambitious target of net-zero emissions by the year 2070. This policy stance was made public by the country’s Prime Minister – Narendra Modi during the 26th edition of the Conference of the Parties (COP26) held at Glasgow, United Kingdom in 2021 under the auspices of the United Nations Framework Convention on Climate Change (UNFCCC). Accordingly, the country’s drive towards carbon neutrality is outlined in five nectar elements for climate actions. This includes; (i) the commitment to attain 500GW non-fossil energy capacity by 2030, (ii) ensure that by 2030, 50% of its energy are sourced from renewable resource, (iii) ensure that total carbon emissions are reduced by one billion tonnes before 2030, (iv) embarking on programmes to reduce carbon intensity by 45% by 2030, (v) and finally attain the net-zero emissions status by 2070.Footnote1
It is noteworthy to highlight that India is among the first developing countries to set for itself a carbon neutrality target. This further portrays India as a leading voice for other developing countries particularly on issues bothering on climate actions. Furthermore, India is a notable emerging economy and the world’s fourth largest carbon emitter coming behind China, the United States, and European Union (Das et al. Citation2022; Uche, Das, and Bera Citation2023). It is also forecasted that energy demand will surge by approximately 90% by 2035 (Addai et al. Citation2022). Likewise, the country is burdened by its large population. When these issues are put in perspective, it is only rationale to commend, as well as appraise the country’s climate action and its carbon neutrality agenda.
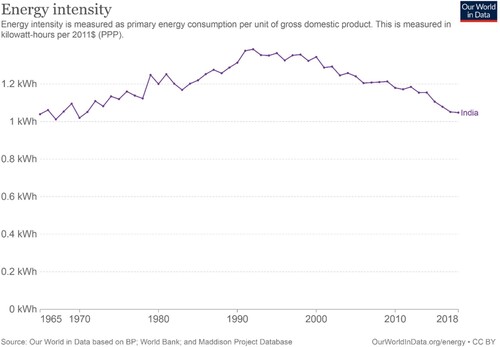
Remarkably, India’s commitment and drive towards climate change mitigation is becoming more glaring through its energy efficiency stance. On the purview of , there are appreciable upwards adjustments in the country’s energy efficiency milieu which has increased significantly and consistently since 2003. India has improved its energy efficiency from 57 terawatt/hour in 1980 to 1027 terawatt/hour in 2021. This trend represents an absolute change of 970 terawatt/hour and 1,911% terawatt/hour improvements.Footnote2 Likewise, the country’s energy intensity trend () reveals appreciable decline in recent times. In another move to combat climate change, India has recently launched the Lifestyle for environment (LiFE) initiative. The LiFE agenda seeks to promote lifestyles that could ensure sustainable society in India and at the global stage. The LiFE programme proposes an integration of several energy transitions protocols that aligns with behavioural changes and conscientious actions that promote green growth.Footnote3 This action which entails a change towards the adoption of electric vehicles (EV) and increased public transportation patronage is expected to ensure appreciable decline in global carbon emissions by 2 billion tonnes (Gt) in 2030.
Figure 1. Trend of Low-carbon energy use (energy efficiency) in India. Source: Our World in Data.
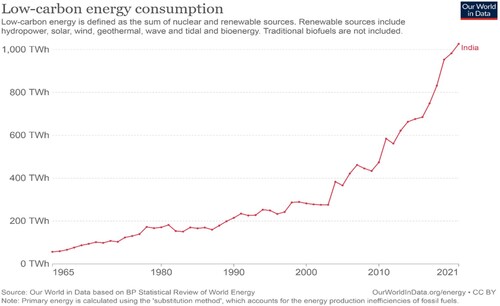
Figure 2. India’s energy intensity profile. Source: Our World in Data.
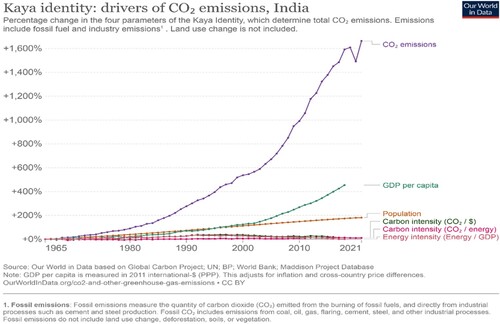
On the other hand, the country’s carbon emission profile () suggests that the country needs to double its energy efficiency drive if it must attain the 2070 net-zero emission target. Accordingly, India’s carbon intensity (CO2/energy) profile has increased from 0.25 kg/kWh in 1980 to 0.28 kg/kWh in 2021. This represents about 11% increased carbon intensity in absolute values. The carbon emission profile of India has maintained an increasing trend since 1965 leading to a relative change of about 1.663% increase as of 2021. Obviously, the coast is not yet clear for India. In this regards, it is expedient to galvanise policy frameworks that could effectively drive and aid the attainment of the carbon neutrality target. This, in line with the LiFE initiative, probing all possible and potential climate change inhibitive factors, both the familiar and unfamiliar ones are expedient.
Figure 3. Drivers of carbon emissions in India. Source: Our World in Data.
Interestingly, experts have probed the dimensions of several enabling factors of climate change as well as potential mitigation enablers (see, Ding, Khattak, and Ahmad Citation2021; Kirikkaleli, Sowah, and Addai Citation2023; Obiakor, Uche, and Das Citation2022; Uche Citation2022; Uche et al., Citation2002; Uche, Chang, and Effiom Citation2022). Surprisingly, very little is known about the dimension of energy efficiency particularly for India. In this perspective, energy efficiency, which measures the overall economic benefits of low energy utilisations is considered a veritable pathway towards sustainable environmental ecosystem (Addai et al. Citation2022; Alola and Stephen Taiwo Onifade Citation2022). The consideration of energy efficiency as a critical decarbonization pathway is justified given that about two-thirds of global carbon emissions are associated with energy utilisation (Su et al. Citation2023). Therefore, it is envisaged that through efficient energy process, the two negative externalities of fossil fuel energy dependence (greenhouse gas emissions and environmental pollution) are minimised. In this perspective, it behoves on environmental strategists to critically and conscientiously x-ray the potentiality of effective energy utilisation process towards the prospects of net-zero emissions. Forthwith, policy insights for cleaner environments both for India and other developing countries will emerge.
On this score, the main thrust of this investigation is to establish empirically and emphatically policy framework for the enthronement of energy efficiency path. By so doing, the study explores how energy efficiency adaptation can aid India’s drive towards net-zero emissions. As stated earlier, this critical step is premised on several essential factors including the lack of clear-cut empirical narratives pertaining to energy efficiency – carbon neutrality dimensions with particular reference to India. Furthermore, the existing studies (Alola and Joshua Citation2020; Khan et al. Citation2022) failed to establish convincing empirical narratives to push the net-zero treaty. They also failed to identify the contributions of green-technology on climate change mitigation processes. Accordingly, the current study presupposes effective climate change mitigation prospects of energy efficiency in India. Likewise, the study considers the promotion and adoption of green-technology essential for the attainment of the net-zero emission propagations.
To project the updated insights in clearer perspective, this study, for the first time, traced the history of CO2 emissions in the contexts of energy intensity, carbon intensity, and CO2 emission within the framework of KAYA identity and STIRPAT with a special emphasis on India. Realising the link between energy intensity, carbon intensity, and CO2 emissions is vital for emerging market economies to achieve greener environment in line with the LiFE agenda. Therefore, this research fills a critical void in literature by examining how energy efficiency affects CO2 emissions with India as a case study considering her net-zero emission target. Likewise, the study also explored the dimension of green-technology as a potent climate change mitigation factor. Last but not least, this work experimentally contributes to the literature by employing the recently developed wavelet quantile correlation (WQC) econometric toolkit akin to Kumar and Padakandla (Citation2022). Notably the WQC is a robust and an enhanced quantile correlation procedure, which among other several advantages, explores the tail dependence across different time spectrum. Intuitively, neglecting the time varying and tail dependence structures of carbon emission and energy efficiency may produce unreliable estimates. Thus, this study represents the first that explored the time-varying and tail dependence of energy intensity and carbon intensity on environmental quality particularly for India. Expectedly, the empirical outcomes of this investigation will form a critical policy template to guide India towards her carbon neutrality drive and compliance to the LiFE initiative. It will also serve as a handy blueprint for other emerging economies in the perspective of climate change mitigation alternatives.
The other parts of the investigation follows thus: the literature review comprising of theoretical orientations and empirical overview is provided in section 2. The research methodology is articulated in section 3. The penultimate section elicits the data analysis and discussions, while the last section unveils the conclusions and policy prescriptions.
2. Literature review
2.1. Theoretical orientation
The conceptual and theoretical explanation of environmental impact is anchored on the anthropogenic drivers of economic agents as domiciled in the foremost holistic assessment of environmental effect (Ehrlich and Holdren Citation1972; York, Rosa, and Dietz Citation2003). These drivers are combination of Population (P), Affluence (A), and Technology (T) (PAT) which might have direct or indirect effects on the environment via energy productivity. In subsequent debates, the model’s effect frameworks have been enlarged to considerably more complex standards and variables. Among these standards is the Kaya Identity, recognised as one of the most important IPAT identity extensions (Yamaji, Fujino, and Osada Citation2000). The Kaya Identity describes cleaner energy productivity-technology (T) through the lens of two energy policy variables: Carbon intensity measures how much carbon dioxide is released for every kilowatt hour of energy production, while energy intensity measures how much energy is consumed per unit of economic strength (Lin and Ahmad Citation2017). In this case, the carbon intensity idea, at first hand, involves lowering environmental problems while allowing economic growth (i.e. lowering carbon dioxide is released for every kilowatt hour of energy production). As a metric for evaluating economic strategies through the lens of CO2 emissions per unit of GDP can help policymakers foster a more sustainable economy and greener world (UN Citation2016).
Many factors could influence the path to greener environment through energy efficiency outlay. One such phenomenon is the famous EKC hypothesis which describes degree of economic growth that generates clean environment. Secondly, energy intensity is a measure of energy efficiency that avails the ratio of energy consumption to economic output. It is used to measure the amount of energy used to produce a unit of economic output (Shokoohi, Dehbidi, and Tarazkar Citation2022). It is also a key instrument for alleviating environmental degradation within the ecosystem. Often, ethical problems impair the efficacy of some of the identities, such as population (Apeaning, Citation2021) and economic growth path (Frodyma, Papież, and Śmiech Citation2022), leading to environmental trajectory. However, the environmental Kuznets curve (EKC) hypothesis has provided a corridor for a greener environment through energy effectiveness if countries are only willing to decouple CO2 emissions from economic output after their per capita income reaches a particular threshold (Frodyma, Papież, and Śmiech Citation2022). Undoubtedly, enhancing efficiency in energy productivity and implementing green energy technology have continued to be the most reliable means of cultivating a greener environment vis-à-vis reducing carbon emissions (Apeaning, Citation2021).
A similar theory distilled from the above narration is the carbon curse. This theory postulates that fossil fuel abundance drives carbon intensity. This makes it difficult for countries naturally endowed with fossil fuels to control carbon emissions and drive a greener environment. A notable explanation of this research output is domicile in Friedrichs and Inderwildi (Citation2013), who conducted an exploratory analysis of data from 41 countries to identify four possible causes. One is that inefficient procedures, like gas flaring, are often used during the extraction of fossil fuels, all of which add to the release of greenhouse gases which restrict the cultivation of a greener environment through energy productivity. Two, a carbon-intensive energy structure results from a reliance on cheap, readily available fossil fuels that has stunted the growth of renewable alternatives. Another is that there are fewer motivations to invest in energy efficiency when economies are so dependent on the ‘rent’ from fossil fuels. Lastly, consumption subsidies promote unsustainable needs for fossil fuels. Collectively, these effects limits carbon neutrality drives in countries that are highly endowed with fossil fuel..
2.2. Empirical review
2.2.1. Energy intensity and CO2 emission
On the empirical front, studies have tested Kaya Identity metrics, carbon curse, and EKC hypothesis by examining the connection between environmental decay, economic growth, energy intensity, and carbon intensity. However, there is no consensus on whether or not it holds for all countries (Tiba and Omri Citation2017; Lin and Raza Citation2019; Shokoohi, Dehbidi, and Tarazkar Citation2022; Khan et al. Citation2022). Emerging reasons have reiterated that these hypotheses vary subject to extended variables (energy intensity, carbon intensity, economic growth, and environmental decay), study period, and statistical technique adopted in the investigation.
Extant studies indicate that there are two key ways via which energy intensity affects CO2 emissions: While numerous studies find that increasing energy efficiency lowers carbon dioxide emissions; other academics claim that this finding is merely temporary. For instance, Paul and Bhattacharya (Citation2004) probed into India’s overall and sectorial CO2 emissions during the years 1980 and 1996. Based on the application of the decomposition technique for this study, they show that economic expansion intensifies environmental decay in both overall and sectorial CO2, while energy efficiency and efficient fuel substitution mitigate it. Wang, Chen, and Zou (Citation2005) employed a data from 1957 to 2000 and reported that China’s environmental sustainability is considerably accelerated by access to renewable energy, energy intensity, and carbon intensity.
In a recent study, Ortega-Ruiz, Mena-Nieto, and García-Ramos (Citation2020) used an expanded version of the Kaya identity to look at how the main sources of pollution in India changed from 1990 to 2016. Under the rules of LMDL, they documented that economic expansion remains the major reason for the escalation of carbon emissions, while improving energy intensity has slowed the damage to the environment. Abbasi, Kirikkaleli, and Altuntaş (Citation2022) investigated the criticality of carbon intensity and environmental degradation in Turkey from 1990 to 2018. Using the NARDL model, they found the possible increased effects of CO2 intensity on the quality of the environment in Turkey. Other results showed that a drop in CO2 intensity reduces environmental decay, while economic growth is an important part of making this country sustainable. Ulucak and Khan (Citation2020) employed annual data between 1985 and 2017 to verify the interaction between carbon emissions and energy intensity in the case of the United States. The researchers tested the EKC hypothesis using the dynamic ARDL and reported that access to energy intensity worsens environmental quality by raising CO2 emissions. In a similar study, Shokoohi, Dehbidi, and Tarazkar (Citation2022) reported that the pace of carbon emissions is considerably accelerated by energy intensity and economic growth in Iran, Iraq, and Turkey by testing the environmental Kuznets Curve hypothesis.
Using an autoregressive distributed lag model, Yang et al. (Citation2022) reported that energy intensity in China has considerable positive impacts on CO2 and further validates the EKC hypothesis. In view of the need of reducing carbon emissions to achieve sustainability objectives, this research provided theoretical reasoning and practical suggestions. Pui and Othman (Citation2019) investigated the primary drivers of rising pollution in Malaysian transport and manufacturing sector. The scholars confirmed that economic size and the effect of energy intensity, are responsible for a decrease in environmental degradation. In a similar scope, El Anshasy and Katsaiti (Citation2014) reported a long-term relationship between fuel mix, energy intensity, and per capita carbon emissions. The scholar employed data between 1972 and 2010 for 131 nations and confirmed that energy efficiency has a potential of reducing CO2 levels in the long run. Okere et al. (Citation2021) assessed the influence of economic expansion and fossil fuel intensity on CO2 emission between 1971 and 2018 in Argentina by verifying the validity of EKC. Using the DARDL, the study highlighted that the energy sources from fossil intensity of fossil fuel aggravate environmental pollution.
Khan et al. (Citation2022) documented the diverse influence of energy intensity on environmental sustainability in APEC member states from 1990 to 2016. The research discovered, among other things, evidence to support EKC hypothesis and a strong linear relationship between energy intensity and ecological footprint. Using Panel Autoregressive Distributive Lag (PARDL), Sultana et al. (Citation2022) analysed the correlation between the level of environmental pollution and the energy intensity in five South Asian nations from 1974 to 2017. They established that the intensity of energy usage exacerbates environmental degradation. Focusing on Group of Seven (G7) between 1997 and 2015, Chu and Le (Citation2022) highlighted the significance of renewable energy and energy intensity on the environmental pressure and found that energy intensity exacerbates environmental contamination. Namahoro et al. (Citation2021) experimentally evaluated the environmental sustainability effect of energy intensity and economic growth among other variables on CO2 emissions across geographies and socioeconomic levels utilising data from more than 50 African countries from 1980 to 2018. Under the MG, CCEMG, and CS-DL frameworks, the results indicate that increasing environmentally friendly energy sources and renewable energy consumption could be a game changer in reducing environmental pollution in Africa, while, increasing energy intensity and economic growth had the opposite effect.
2.2.2. Carbon intensity and CO2 emission
Further on, discussing the detrimental effects of carbon emissions on the environment and the need to examine the factors contributing to CO2 emissions in the developing nations. Rahman, Sultana, and Velayutham (Citation2022), for example, used the Pool Mean Group (PMG) estimation technique to look at the correlations between carbon emissions and the dynamic effects of energy intensity on certain variables in the 25 largest emerging economies from 1990 to 2018. The study proved that the EKC is correct and showed that the amount of energy used increases the amount of carbon used. Solaymani (Citation2019) looked at a lot of research on the United States, China, India, Canada, Russia, Japan, and Brazil from 2000 to 2015 and found that fossil fuels and the amount of carbon in the air are the main factors that affect global CO2 emissions. By focusing on the content of analysis under the Logarithmic Mean Divisia Index (LMDI), the study argued that carbon intensity reduces CO2 emissions while environmental degradation is a function of the structure of electricity and the effects of economic output. Lin and Raza (Citation2019) looked at the change in CO2 emissions in Pakistan from 1978 to 2017 using the Logarithmic Mean Divisia Index method. They found that population growth, activity effects, and GDP increase CO2 emissions, but carbon intensity and energy intensity help lower CO2 emissions.
In their study, Lin and Ahmad (Citation2017) used the Logarithmic Mean Divisia Index (LMDI) method and extended the Kaya identity to look at the relationship between CO2 emissions, GDP per capita, population, carbon intensity, and energy intensity in Pakistan from 1990 to 2014. There were interesting research results that have policy implications. The research showed that rising levels of population and GDP per capita were to blame for rising levels of emissions, while rising levels of carbon intensity were to blame for a drop in emissions. On the other hand, the intensity of the energy had a variety of impacts, some of which were unstable, on the reduction potentials. Lastly, developing a greener environment through energy productivity means shifting away from fossil-based energy sources and toward renewable sources such as solar and wind energy technologies to meet the increased demand for energy while simultaneously reducing CO2 emissions. A study by Hasan and Chongbo (Citation2020) analyses the CO2 emissions of Bangladesh’s energy industry from 1979 to 2018 using the logarithmic mean division index (LMDI) technique and applies this to three possible future emission scenarios. Study findings indicate that population growth, government action, and substitution have positive effects on reducing carbon emissions, whereas both CO2 intensity and power intensity have negative effects. Raza and Lin (Citation2022) looked at the main causes of carbon dioxide equivalent CO2 emissions from electricity production in Pakistan from 1990 to 2019. They found that the decrease in carbon dioxide emissions is due to better energy use.
Recent studies also explored the dimensions of energy efficiency and climate change mitigation pathways. In this perspective, Kirikkaleli, Sowah, and Addai (Citation2022) rectified the carbon neutrality component of energy efficiency in the Republic of Ireland based on the estimates of the nonlinear ARDL procedure. In very recent investigations, Kirikkaleli, Sowah, and Addai (Citation2023) and Kirikkaleli and Sowah (Citation2023) also affirm the climate change mitigating attributes of energy efficiency for the United Kingdom and Finland, respectively. Unarguably, these studies that relied on estimates of the nonlinear ARDL estimation procedure also failed to consider the peculiarity of the Indian economy, thereby paving the way for further probe.
2.2.3. Green-technology and CO2 emission
Another form of controversy that has attracted policymakers’ attention towards cultivating a greener environment through energy productivity is technological innovation (green-technology). Technological innovation involves introducing new environmental-related technologies into existing systems with better performance characteristics than previous ones while using fewer input materials/energy, resulting in lower GHG emission levels. Recent scholars, Raihan et al. (Citation2022) employed annual data from 1980 to 2019 and applied ARDL bounds testing and DOLS method. The key finding is that technological innovation has a significant negative impact on CO2 emissions in Bangladesh, which translates into a greener environment. Mirziyoyeva and Salahodjaev (Citation2022) used data from 2000 to 2015 in their analysis of the 50 most carbon-intensive countries to determine the extent to which the adoption of energy-related technology contributed to achieving a Greener Environment. Findings demonstrated that a reduction in carbon dioxide emissions could be attained with a corresponding increase in the utilisation of energy-related technology sources.
By comparing results across regions, Obobisa (Citation2022) discovered that with an increase in the deployment of energy-related technology, CO2 emissions are reduced in Europe, Asia, and the Pacific. Likewise, Uche, Das, and Bera (Citation2023) probed the potential climate mitigation effects of green-technology in India via the multiple threshold nonlinear ARDL technique. The study suggests that green-technology provided only but short-term appealing effects on carbon emissions. However, it is pertinent to highlight that the study did not probe the dimension of energy efficiency, neither was the moderating effects of green-technology on energy efficiency – climate change mitigation nexus considered. In recent studies, Sharif et al. (Citation2023) and Su et al. (Citation2023) explored the efficacy of green-technological innovation on carbon emission mitigations in the case of five Nordic countries and the US, respectively. Interestingly, the former submits that green-technology and green energy are significant carbon abatement strategies. However, the latter posit that green-technology eliminates and also promotes carbon emissions. Certainly, this is another empirical puzzle that requires further clarifications if the net-zero emission target must be realised.
2.2.4. Gap in related empirical studies
In spite of the extensive impact of previous work, a number of critically important information gaps remain; filling these gaps is a top priority for this inquiry. The following gaps have been identified: To begin, there needs to be more literature that examines the relationship between energy intensity, carbon intensity, and CO2 emission in India, much alone sheds light on the processes of cultivating greener environment through energy productivity in India. Second, there is a lack of consensus among existing research on the relationship between energy intensity, carbon intensity, and CO2 emission. This is largely attributable to the fact that not enough studies have employed the appropriate model and technique for this relationship, such as the KAYA identity metrics and the novel WQC method. Thirdly, numerous studies have been conducted to determine the primary causes of environmental degradation. However, an efficient energy productivity system is often overlooked in research because of its indirect influence on the pathways to a greener environment, which is difficult to quantify.
3. Research methodology
3.1. Data sources and description
This study employs annual time series from 1997 to 2021 which was subsequently updated into quarterly series (see Muoneke, Okere, and Onuoha Citation2022; Uche, Chang, and Effiom Citation2022). The drivers of CO2 emissions in a selection of Indian economy are based on KAYA identity metrics. Kaya identity dataset is compiled by ourworldindata.org (OWD). Series from the dataset and their notations in this study include: carbon dioxide emissions (CO2), energy intensity (EI) and carbon intensity (CI), green technology (EVCT) patent on environmental control technology, GDP per capita (GDPC), and population size (POP). Notably, while other series are obtainable from Our World in Data (OWD), green technology data are extracted from Organization for Economic Cooperation and Development (OECD) data stream. To calculate total emissions on the basis of aggregate consumption, the estimates are based on production and consumption paths. The selection of the data range is strictly on the basis of data availability over the study period and India’s strategic path towards net-zero emission by 2070. To aid policy formulation and extend the frontier of academic readership, carbon dioxide emissions (CO2), energy intensity (EI), and carbon intensity (CI) are computed as thus:
The permutation of the Kaya Identity equation is x-rayed in Equations (1)–(4) as thus: (i) Total CO2 emissions are driven by population, income per capita and technology (see Equation (1)). (ii) The energy efficiency effect is determined by two factors: energy intensity which is defined by the amount of energy consumed per unit of GDP and carbon intensity which denotes the amount of CO2 emitted per unit of energy
(see Equation (3)). (iii.) Together, the Kaya identity provides four fundamental factors for explaining total CO2 emissions (see Equation (4)).
(1)
(1)
(2)
(2)
(3)
(3)
(4)
(4)
3.2. Analytical technique
3.2.1. Wavelet quantile correlation
To analyse the relationship between components of KAYA identity and carbon emission, employed a novel time series estimation technique. Accordingly, following Chishti, Azeem, and Khan (Citation2023), we extend the trajectory of empirical literature space by adopting the newly proposed WQC technique akin to Kumar and Padakandla (Citation2022). The WQC procedure is a notable extension of the quantile correlation estimator inspired by Percival and Walden (Citation2006) and Li, Li, and Tsai (Citation2015). Interestingly, the WQC procedure has attracted the interest of recent studies including Chishti, Azeem, and Khan (Citation2023) who explored the connectedness and drivers of energy transition via this advanced econometric technique. The benefits of the WQC estimator encompasses the ability to identify information over different quantile frequencies as well as different time horizons (Kumar and Padakandla Citation2022). This innovative model also considers tail and structure dependence across differing time dimensions. Likewise, the WQC procedure has the ability to expose the dynamic dependence structure over varying time scales. Additionally, the potentiality of asymmetric association among the enlisted series and over their distributions can be adequately captured by the WQC procedure. The model also converts the effects of potential outliers to momentary shocks by splitting them into quantiles (Chishti et al. Citation2023).
(5)
(5) The term above,
, stands for the unbiased estimator of the wavelet covariance between CO2 emission (Y) and energy efficiency (X) coefficients
and
, whereas the expressions
and
stand for the unbiased estimators of the wavelet variances X and Y associated with the scale
. Here, we provide a definition for the WQC-based unbiased wavelet variance estimator:
(6)
(6) where
is the jth coefficient level of WQC,
is the length of scale
(wavelet filter), and
is the number of coefficients that are unaffected by the boundary. Based on their research, Kumar and Padakandla (Citation2022) wavelet coherence confidence interval at the 95th percentile can be written as
, where
depicting the number of standard deviations from the mean, 100p%, and
is the Fisher Z-transformation (Li, Li, and Tsai Citation2015).
4. Results and discussion
This portion of the study unveils the specific characteristics of the relevant dataset, including the mean, minimum, and maximum values. Specific outcomes indicate among other things varying positive and negative tails among the series. Accordingly, whereas CO2, CI, EVCT, and GDP are skewed to the right, EI and P are skewed to the left. In this instance, the adoption of inappropriate estimation techniques that do not explore the tail dependence across different time spectrums will produce misleading estimates, thereby, constraining the attainment of the policy target ().
Table 1. Descriptive statistics.
On the basis of the above notion, the inferences of the current investigation emerged through the implementation of the novel WQC econometric procedure that is efficient in handling issues that border on tail dependence structures. Accordingly, the quantile correlation between carbon emission in India and the enlisted explanatory factors are illustrated in . Correspondingly, exhibit the quantile correlation between carbon emission (CO2) and energy intensity (EI), carbon intensity (CI), green technology (EVCT), economic expansion (GDP), and population (P). In line with Chishti, Azeem, and Khan (Citation2023), the relevant information pertaining to the quantile distributions are split into the three scales of 1997Q1-1999Q4, 2000Q1-2005Q4, 2006Q1-2021Q4 representing the short term, medium term, and the long term relationships. In all, the data stretches over 100 quarter points. Following these processes, we are able to explore and explain more information pertaining to the behaviours of both the explained and explanatory series.
Figure 4. QC CO2/Energy intensity.
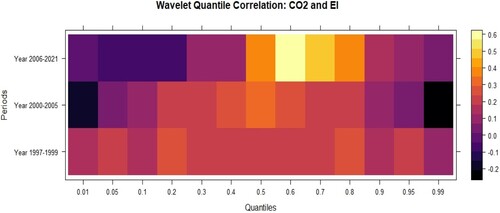
Figure 5. QC CO2/Carbon intensity.
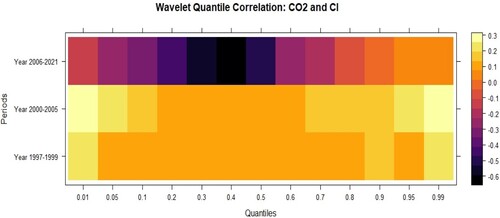
Figure 6. QC CO2/Green technology.
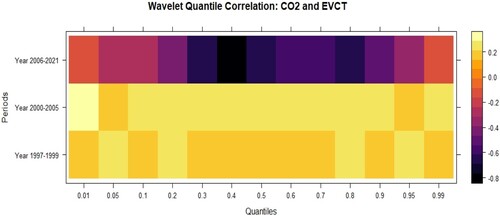
Figure 7. QC CO2/Economic expansion.
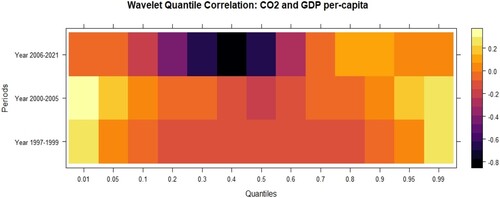
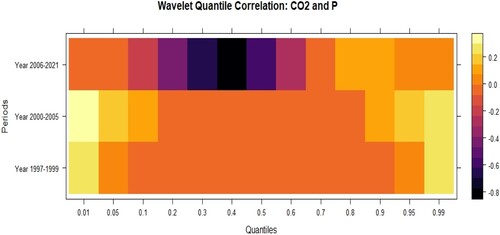
Figure 8. QC CO2/Population.
Notably, reports the quantile correlation between carbon emissions and energy intensity. Instructively, the deep black colour boxes denote strong negative quantile correlation representing advantageous effects for carbon neutrality. On the other side, the extreme yellow colour represents strong positive association thereby denoting significant carbon escalating effects. In this instance, the quantile correlation (QC) between carbon emission (CO2) and energy intensity (EI) reveals varying effects of energy intensity in India across the quantile distributions of carbon emissions. In specific terms, the plot suggests some degrees of varying negative and positive effects from the short, medium, and long terms. During the short term, EI failed to ensure significant carbon-reducing effects across the quantiles. Notably, within the medium term, EI effectively ensured significant reductions in carbon emission at the lower and upper quantiles of carbon emission distributions. Likewise, at the long term, EI provided varying degrees of carbon de-escalating and escalating effects across the quantiles of carbon emissions. This outcome suggests that EI avails more prominent asymmetric effect on CO2 emission in the long term. Overall, the evidence which aligns with Shokoohi, Dehbidi, and Tarazkar (Citation2022) presupposes that EI is a potential decarbonisation tool, however, it is imperative to highlight that it is not fully aligned for India’s drive towards net-zero emission. Implicatively, India is therefore encouraged to further deepen its low-carbon energy utilisation if it must attain its carbon neutrality target. The development and adoption of appliances that use less energy are encouraged in this perspective for the realisation of the net-zero agenda.
and indicate the quantile associations between CI – CO2 and EVCT – CO2 nexuses, respectively. Specifically, suggests significant carbon escalating effects of carbon intensity (CI) on CO2 both in the short and medium term and across all the quantile distributions. On the other hand, CI profile of India portrays varying degrees of carbon neutrality effects in the long term and across the quantiles. The long-term soothing effects are more prominent within the middle quantile of carbon emission. Similar to the association of EI and CO2, there is also evidence of prominent asymmetric association between CI and CO2 in the long run. Interestingly, similar outcomes have been established in some extant literature. For instance, Lin and Raza (Citation2019) and Rahman, Sultana, and Velayutham (Citation2022) discovered varying positive and negative associations between CI and CO2 in Pakistan and Bangladesh. Supposedly, environmental strategy that emphasises low-carbon intensity is pertinent to propel the carbon neutrality of India. The association between green technology (EVCT) and CO2 is very similar to that of CI and CO2 in India. Here, there is evidence of significant carbon emission effects in both the short and medium terms arising from EVCT. This could be seen as the embryotic stage of such technology. Interestingly, EVCT was able to generate some varying carbon mitigation effects in the long term and across the quantiles of CO2 distributions. Likewise, the case of long-term prominent asymmetric effects cannot be ruled out in the association between green-technology and CO2 emission in India. It is also worthy of note that such effects have been established in some prior studies (Uche, Das, and Bera Citation2023). Thus, given its long-term significant carbon mitigation effects, it is most sensible to ensure that such technology is sustained and appropriately deployed towards the net-zero emission projections.
Relating to the association between economic expansion (GDP) and carbon emission (), some interesting and policy-relevant outcomes suffice. In tandem with the submissions of several prior studies (Das et al. Citation2022; Okere et al. Citation2021; Yang et al. Citation2022), GDP escalated CO2 emissions both in the short and medium terms. Interestingly, the outcome exhibited the EKC paradigm given that GDP ensured varying degrees of carbon deescalating effects in the long term. Thus it is imperative to underscore that the submissions of some prior studies (Mirziyoyeva and Salahodjaev Citation2022; Gangopadhyay et al. Citation2023) relating to EKC for the Indian economy are validated. Meanwhile, it is also vital to highlight the presence of long-term strong asymmetric effects between GDP and CO2. Given this, policies that are targeting both growth and carbon emission must have a balanced overview and ensure that all available options are considered before implementation. In this respect, India stands the chance of maintaining its prospects of economic prosperity without jeopardising the environmental ecosystem.
In the instance of , the quantile association between population and carbon emission in India is rectified. Similar to the effect of GDP and in alignment with the submissions of some extant studies (Opuala, Omoke, and Uche Citation2023), growing population deteriorates environmental quality by escalating CO2 emissions in both the short term and medium term. In the long term, population explosion also ensured significant carbon emissions except within the middle quantiles (0.2–0.5). Thus, the presence of long-term asymmetric effect suffices between the association of population and quantile distributions of CO2 emissions in India. Given this undesirable effects of population on carbon emission and the ambitious carbon neutrality target in India, it behoves on policymakers to effectively push the LiFE initiative and ensures that it is embraced by all. Unarguably, such behavioural changes and conscientious environmental protection actions among the populace is essential for the net-zero agenda. In the instance that majority of the population embrace the public transportation infrastructure and most consider EV, the country’s net-zero target is prominently realisable.
5. Conclusion and policy options
In this study, we made effort to scrutinise the potentiality of energy efficiency to drive India’s net-zero emission target of 2070. On the premise to provide novel evidence and to circumvent the drawbacks of extant literature, we explore the dimensions of energy and carbon intensities within the KAYA identity towards this ambition. As such, the influence of economic expansion, population, as well as green technology was also explored. Efforts were also expended to further update the trajectory of knowledge by the adoption of the newly proposed WQC econometric toolkit for the analysis of quarterly data spanning 1997Q1 to 2021Q4. It is noteworthy to highlight that previous studies never considered this directions and the perspective of India was grossly underrepresented. Expectedly, the new insights availed in this study are critical for the actualisation of India 2070 carbon neutrality agenda.
On the bases of holistic approaches adopted in the current investigation, several profound policy insights essential for the realisation of the net-zero emission target sufficed. Overall, energy efficiency generated varying degrees of soothing and some undesirable carbon emission effects across the distributions of CO2 emissions. Notably, the undesirable effects were mainly prominent in the short term, whereas in the medium and long term, its decarbonisation potential was activated significantly. Likewise, there was evidence of prominent asymmetric effect particularly in the long term. For carbon intensity and green technology, the empirical evidence denotes varying positive and negative effects across the distributions and over time. Both series generated some degrees of environmental degrading effects in the short and medium term. Fortunately, in the long term, both series exhibited varying degrees of carbon neutrality tendencies.
Additionally, it was established that GDP escalates CO2 in the short and medium terms, whereas it generated some varying degrees of carbon emission mitigation effects in the long term. In this perspective, the EKC hypothesis resonates for the case of India thereby suggesting that in the long term, India can reap the full benefits of economic expansion and green environments. However, there is notable evidence of long term asymmetric effects of GDP on carbon emission across the quantile of CO2 distributions. Population provided more significant carbon escalating effects both in the short, medium, and long terms. But there are few instances where population generated some significant carbon deescalating effects particularly in the long term.
The above revelations avail several policy options for the country towards the realisation of the decarbornisation pursuit. Critical among them is that India must ensure more efficient use of energy. This can be achieved by consistent reliance on low-carbon emission energies that are critical for reduced energy and carbon intensities. The net-zero agenda is also attainable without undermining the prospects of economic prosperity. This is evident on the basis of the established long-term soothing effects of economic expansion on CO2 emission in the country. In this respect, policies that ensure that the industries and manufacturing outlets conduct their activities in eco-friendly processes are critical. Likewise, India’s teeming population could aid the carbon neutrality programme if they are adequately conscientised on the benefits of clean environments, as well as its negative consequences. Considerably, the LiFE programme which encapsulates behavioural changes towards the environment and the adoption of EV suffices here.
Further, this research output shows that when the energy and carbon intensity of a country’s consumption pattern rise, they generate varied environmental implications. This suggests that India may be able to further lessen its environmental impacts by changing its energy mix to one with a lower carbon intensity and by enhancing energy efficiency. According to the present energy mix in India, fossil fuels provide over 75% of the countries’ total energy consumption. So, it’s important to make a conscious shift in the mix of policies being implemented. If sufficient action is not made to increase the amount of green energy sources in the consumption mix, continuing with the current policy will only make a tiny contribution to the carbon neutrality target in India. Key legislative initiatives to take include increasing the efficiency of buildings, attracting private funding for energy projects, and eventually ending the production and sale of new gasoline and diesel vehicles.
6. Limitations and future directions
Although this study has significant restrictions, it does pave the way for additional work in this area. At the outset, it should be noted that India serves as a sample for this research. So, other countries or regions may be the focus of subsequent research. The Kaya identity metrics were used to estimate the non-parametric link between energy and CO2 emissions. Consequently, the correlation can be expanded to analyse environmental repercussions in other regions for comparison evidence and may be valuable in comprehending CO2 emissions in India. To cap it all off, this research defines the efficacy of the energy consumption mix through the use of energy and carbon intensity indicators. To learn more about the environmental effects of oil, natural gas, solar, wind, and nuclear power, researchers can look into more decentralised energy arrangements in the future.
Disclosure statement
No potential conflict of interest was reported by the author(s).
Notes
References
- Abbasi, K. R., D. Kirikkaleli, and M. Altuntaş. 2022. “Carbon Dioxide Intensity of GDP and Environmental Degradation in an Emerging Country.” Environmental Science and Pollution Research 29 (56): 84451–84459. https://doi.org/10.1007/s11356-022-21679-9.
- Addai, K., R. D. Ozbay, R. A. Castanho, S. Y. Genc, G. Couto, and D. Kirikkaleli. 2022. “Energy Productivity and Environmental Degradation in Germany: Evidence from Novel Fourier Approaches.” Sustainability 14: 16911. https://doi.org/10.3390/su142416911.
- Alola, A. A., and U. Joshua. 2020. “Carbon Emission Effect of Energy Transition and Globalization: Inference from the low-, Lower Middle-, Upper Middle-, and High-Income Economies.” Environmental Science and Pollution Research 27: 38276–38286. https://doi.org/10.1007/s11356-020-09857-z.
- Alola, A. A., and S. T. Stephen Taiwo Onifade. 2022. “Energy Innovations and Pathway to Carbon Neutrality in Finland.” Sustainable Energy Technologies and Assessments 52 (Part D): 102272. https://doi.org/10.1016/j.seta.2022.102272.
- Apeaning, R., and W. kg/kWh. 2021. “Technological Constraints to Energy-Related Carbon Emissions and Economic Growth Decoupling: A Retrospective and Prospective Analysis.” Journal of Cleaner Production 291: 125706. https://doi.org/10.1016/j.jclepro.2020.125706.
- Chishti, M. Z., H. S. M. Azeem, and M. K. Khan. 2023. “Asymmetric Nexus Between Commercial Policies and Consumption-Based Carbon Emissions: New Evidence from Pakistan.” Financial Innovation 9: 33. https://doi.org/10.1186/s40854-022-00421-x.
- Chishti, M. Z., A. Sinha, U. Zaman, and U. Shahzad. 2023. “Exploring the Dynamic Connectedness among Energy Transition and its Drivers: Understanding the Moderating Role of Global Geopolitical Risk.” Energy Economics 119: 106570. https://doi.org/10.1016/j.eneco.2023.106570.
- Chu, L. K., and N. T. M. Le. 2022. “Environmental Quality and the Role of Economic Policy Uncertainty, Economic Complexity, Renewable Energy, and Energy Intensity: The Case of G7 Countries.” Environmental Science and Pollution Research 29 (2): 2866–2882. https://doi.org/10.1007/s11356-021-15666-9.
- Das, N., M. Murshed, S. Rej, A. Bandyopadhyay, Md. E. Hossain, H. Mahmood, V. Dagar, and P. Bera. 2022. “Can Clean Energy Adoption and International Trade Contribute to the Achievement of India’s 2070 Carbon Neutrality Agenda? Evidence Using Quantile ARDL Measures.” International Journal of Sustainable Development & World Ecology, 119: 384–401. https://doi.org/10.1080/13504509.2022.2139780.
- Ding, Q., S. I. Khattak, and M. Ahmad. 2021. “Towards Sustainable Production and Consumption: Assessing the Impact of Energy Productivity and eco-Innovation on Consumption-based Carbon Dioxide Emissions (CCO2) in G-7 Nations.” Sustainable Production and Consumption 27: 254–268. https://doi.org/10.1016/j.spc.2020.11.004.
- Ehrlich, P. R., and J. P. Holdren. 1972. “Critique.” Bulletin of the Atomic Scientists 28 (5): 16–27. https://doi.org/10.1080/00963402.1972.11457930.
- El Anshasy, A. A., and M. S. Katsaiti. 2014. “Energy Intensity and the Energy mix: What Works for the Environment?” Journal of Environmental Management 136: 85–93. https://doi.org/10.1016/j.jenvman.2014.02.001.
- Friedrichs, J., and O. R. Inderwildi. 2013. “The Carbon Curse: Are Fuel Rich Countries Doomed to High CO2 Intensities?” Energy Policy 62: 1356–1365. https://doi.org/10.1016/j.enpol.2013.07.076.
- Frodyma, K., M. Papież, and S. Śmiech. 2022. “Revisiting the Environmental Kuznets Curve in the European Union Countries.” Energy 241: 122899. https://doi.org/10.1016/j.energy.2021.122899.
- Gangopadhyay, P., N. Das, G. M. M. Alam, U. Khan, M. Haseeb, and Md. E. Hossain. 2023. “Revisiting the Carbon Pollution-Inhibiting Policies in the USA Using the Quantile ARDL Methodology: What Roles Can Clean Energy and Globalization Play?” Renewable Energy 204: 710–721. https://doi.org/10.1016/j.renene.2023.01.048.
- Hasan, M. M., and W. Chongbo. 2020. “Estimating Energy-Related CO2 Emission Growth in Bangladesh: The LMDI Decomposition Method Approach.” Energy Strategy Reviews 32: 100565. https://doi.org/10.1016/j.esr.2020.100565.
- Khan, I., F. Hou, A. Zakari, M. Irfan, and M. Ahmad. 2022. “Links among Energy Intensity, non-Linear Financial Development, and Environmental Sustainability: New Evidence from Asia Pacific Economic Cooperation Countries.” Journal of Cleaner Production 330: 129747. https://doi.org/10.1016/j.jclepro.2021.129747.
- Kirikkaleli, D., and J. K. Jr Sowah. 2023. “The Asymmetric and Long run Effect of Energy Productivity on Quality of Environment in Finland.” Journal of Cleaner Production 383: 135285. https://doi.org/10.1016/j.jclepro.2022.135285.
- Kirikkaleli, D., J. K. Sowah, and K. Addai. 2023. “The Asymmetric and Long-run Effect of Energy Productivity on Environmental Degradation in the United Kingdom.” Energy & Environment 0 (0). https://doi.org/10.1177/0958305X231152485.
- Kumar, A. S., and S. R. Padakandla. 2022. “Testing the Safe-Haven Properties of Gold and Bitcoin in the Backdrop of COVID-19: A Wavelet Quantile Correlation Approach.” Finance Research Letters 47 (Part B): 102707. https://doi.org/10.1016/j.frl.2022.102707.
- Li, Guodong;, Yang; Li, and Chih-Ling Tsai. 2015. “Quantile Correlations and Quantile Autoregressive Modeling.” Journal of the American Statistical Association 110 (509): 246–261. https://doi.org/10.1080/01621459.2014.892007.
- Lin, B., and I. Ahmad. 2017. “Analysis of Energy Related Carbon Dioxide Emission and Reduction Potential in Pakistan.” Journal of Cleaner Production 143: 278–287. https://doi.org/10.1016/j.jclepro.2016.12.113.
- Lin, B., and M. Y. Raza. 2019. “Analysis of Energy Related CO2 Emissions in Pakistan.” Journal of Cleaner Production 219: 981–993. https://doi.org/10.1016/j.jclepro.2019.02.112.
- Mirziyoyeva, Z., and R. Salahodjaev. 2022. “Renewable Energy and CO2 Emissions Intensity in the top Carbon Intense Countries.” Renewable Energy 192: 507–512. https://doi.org/10.1016/j.renene.2022.04.137.
- Muoneke, O. B., K. I. Okere, and F. C. Onuoha. 2022. “Extreme Exchange Rate Dynamics and Export Trade in the Selected oil-Exporting Countries in Africa. Multiple Asymmetric Threshold non-Linear ARDL Approach.” The Journal of International Trade & Economic Development, – (Article-in-production). https://doi.org/10.1080/09638199.2022.2139405.
- Namahoro, J. P., Q. Wu, N. Zhou, and S. Xue. 2021. “Impact of Energy Intensity, Renewable Energy, and Economic Growth on CO2 Emissions: Evidence from Africa Across Regions and Income Levels.” Renewable and Sustainable Energy Reviews 147: 111233. https://doi.org/10.1016/j.rser.2021.111233.
- Obiakor, R. T., E. Uche, and N. Das. 2022. “Is Structural Innovativeness a Panacea for Healthier Environments? Evidence from Developing Countries.” Technology in Society 70: 102033. https://doi.org/10.1016/j.techsoc.2022.102033.
- Obobisa, E. S. 2022. “Achieving 1.5 C and net-Zero Emissions Target: The Role of Renewable Energy and Financial Development.” Renewable Energy 188: 967–985. https://doi.org/10.1016/j.renene.2022.02.056.
- Okere, K. I., F. C. Onuoha, O. B. Muoneke, and A. M. Oyeyemi. 2021. “Towards Sustainability Path in Argentina: The Role of Finance, Energy mix, and Industrial Value-Added in low or High Carbon Emission – Application of DARDL Simulation.” Environmental Science and Pollution Research 28 (39): 55053–55071. https://doi.org/10.1007/s11356-021-14756-y.
- Opuala, C. S., P. C. Omoke, and E. Uche. 2023. “Sustainable Environment in West Africa: The Roles of Financial Development, Energy Consumption, Trade Openness, Urbanization and Natural Resource Depletion.” International Journal of Environmental Science and Technology 20. https://doi.org/10.1007/s13762-022-04019-9.
- Ortega-Ruiz, G., A. Mena-Nieto, and J. E. García-Ramos. 2020. “Is India on the Right Pathway to Reduce CO2 Emissions? Decomposing an Enlarged Kaya Identity Using the LMDI Method for the Period 1990–2016.” Science of The Total Environment 737: 139638. https://doi.org/10.1016/j.scitotenv.2020.139638.
- Paul, S., and R. N. Bhattacharya. 2004. “CO2 Emission from Energy use in India: A Decomposition Analysis.” Energy Policy 32 (5): 585–593. https://doi.org/10.1016/S0301-4215(02)00311-7.
- Percival, D. B., and A. T. Walden. 2006. Wavelet Methods for Time Series Analysis, 4. Cambridge: Cambridge University Press.
- Pui, K. L., and J. Othman. 2019. “The Influence of Economic, Technical, and Social Aspects on Energy-Associated CO2 Emissions in Malaysia: An Extended Kaya Identity Approach.” Energy 181: 468–493. https://doi.org/10.1016/j.energy.2019.05.168.
- Rahman, M. M., N. Sultana, and E. Velayutham. 2022. “Renewable Energy, Energy Intensity and Carbon Reduction: Experience of Large Emerging Economies.” Renewable Energy 184: 252–265. https://doi.org/10.1016/j.renene.2021.11.068.
- Raihan, A., D. A. Muhtasim, M. N. A. Khan, M. I. Pavel, and O. Faruk. 2022. “Nexus Between Carbon Emissions, Economic Growth, Renewable Energy Use, and Technological Innovation Towards Achieving Environmental Sustainability in Bangladesh.” Cleaner Energy Systems 3: 100032. https://doi.org/10.1016/j.cles.2022.100032.
- Raza, M. Y., and B. Lin. 2022. “Analysis of Pakistan’s Electricity Generation and CO2 Emissions: Based on Decomposition and Decoupling Approach.” Journal of Cleaner Production 359: 132074. https://doi.org/10.1016/j.jclepro.2022.132074.
- Sharif, A., M. T. Kartal, F. V. Bekun, U. K. Pata, C. L. Foon, and S. K. Depren. 2023. “Role of Green Technology, Environmental Taxes, and Green Energy Towards Sustainable Environment: Insights from Sovereign Nordic Countries by CS-ARDL Approach.” Gondwana Research 117: 194–206. https://doi.org/10.1016/j.gr.2023.01.009.
- Shokoohi, Z., N. K. Dehbidi, and M. H. Tarazkar. 2022. “Energy Intensity, Economic Growth and Environmental Quality in Populous Middle East Countries.” Energy 239: 122164. https://doi.org/10.1016/j.energy.2021.122164.
- Solaymani, S. 2019. “CO2 Emissions Patterns in 7 top Carbon Emitter Economies: The Case of Transport Sector.” Energy 168: 989–1001. https://doi.org/10.1016/j.energy.2018.11.145.
- Su, C. W., F. Liu, P. Stefea, and M. Umar. 2023. “Does Technology Innovation Help to Achieve Carbon Neutrality?” Economic Analysis and Policy 78: 1–14. https://doi.org/10.1016/j.eap.2023.01.010.
- Sultana, N., M. M. Rahman, R. Khanam, and K. Z. Islam. 2022. “The Causative Factors of Environmental Degradation in South Asia.” Journal of Asian Economics 79: 101452. https://doi.org/10.1016/j.asieco.2022.101452.
- Tiba, S., and A. Omri. 2017. “Literature Survey on the Relationships Between Energy, Environment and Economic Growth.” Renewable and Sustainable Energy Reviews 69: 1129–1146. https://doi.org/10.1016/j.rser.2016.09.113.
- Uche, E. 2022. “Strategic Pathways to Combating Remittance-Induced Carbon Emissions; the Imperatives of Renewable Energy, Structural Transformations, Urbanization and Human Development.” Energy Sources, Part B: Economics, Planning, and Policy 17 (1): 2141375. https://doi.org/10.1080/15567249.2022.2141375.
- Uche, E., B. H. Chang, and L. Effiom. 2022. “Household Consumption and Exchange Rate Extreme Dynamics: Multiple Asymmetric Threshold non-Linear Autoregressive Distributed lag Model Perspective.” International Journal of Finance & Economics, 28, 3437- 3454–. https://doi.org/10.1002/ijfe.2601.
- Uche, E., N. Das, and P. Bera. 2023. “Re-examining the Environmental Kuznets Curve (EKC) for India via the Multiple Threshold NARDL Procedure.” Environmental Science and Pollution Research 30: 11913–11925. https://doi.org/10.1007/s11356-022-22912-1.
- Uche, E., N. Das, P. Bera, and J. Cifuentes-Faura. 2023. “Understanding the Imperativeness of Environmental-Related Technological Innovations in the FDI – Environmental Performance Nexus.” Renewable Energy 206: 285–294. https://doi.org/10.1016/j.renene.2023.02.060.
- Uche, E., N. Das, N. C. Nwaeze, and P. Bera. 2022. “Navigating the Paths to Sustainable Environments via Energy Security, Renewable Energy and Economic Complexity: Evidence from Array of Pollution Metrics.” Energy & Environment (Article-in-production), https://doi.org/10.1177/0958305X221140571.
- Ulucak, R., and S. U. D. Khan. 2020. “Relationship Between Energy Intensity andCO2 Emissions: Does Economic Policy Matter?” Sustainable Development 28 (5): 1457–1464. https://doi.org/10.1002/sd.2098.
- United Nations 2016. Greening Africa’s Industrialization, United Nations Economic Commission for Africa. Addis Ababa.
- Wang, C., J. Chen, and J. Zou. 2005. “Decomposition of Energy-Related CO2 Emission in China: 1957–2000.” Energy 30 (1): 73–83. https://doi.org/10.1016/j.energy.2004.04.002.
- Yamaji, K., J. Fujino, and K. Osada. 2000. “Global Energy System to Maintain Atmospheric CO2 Concentration at 550 ppm.” Environmental Economics and Policy Studies 3: 159–171. https://doi.org/10.1007/BF03354035.
- Yang, Z., J. Cai, Y. Lu, and B. Zhang. 2022. “The Impact of Economic Growth, Industrial Transition, and Energy Intensity on Carbon Dioxide Emissions in China.” Sustainability 14 (9): 4884. https://doi.org/10.3390/su14094884.
- York, R., E. A. Rosa, and T. Dietz. 2003. “STIRPAT, IPAT and ImPACT: Analytic Tools for Unpacking the Driving Forces of Environmental Impacts.” Ecological Economics 46 (3): 351–365. https://doi.org/10.1016/S0921-8009(03)00188-5.
