
 ?Mathematical formulae have been encoded as MathML and are displayed in this HTML version using MathJax in order to improve their display. Uncheck the box to turn MathJax off. This feature requires Javascript. Click on a formula to zoom.
ABSTRACT
Kuwait’s policy of achieving 15% renewable energy by 2030, announced in 2012, has been diverted from its original intent. Today, Kuwait’s renewable energy goal is to meet 15% of its projected peak load by 2030. To examine the actual outcomes, a comparison is offered between the original policy: annual energy share, the current policy: peak capacity share, and two other policies: installed capacity share and peak load share. The results demonstrate how these policies lead to drastically different outcomes. The total installed renewable energy capacity ranges from 4 GW to 27 GW; the total produced energy from renewables ranges from 8 TWh to 44 TWh; and the flexibility requirements ranges from 1.6 GW to 20 GW per hour.
Nomenclature
Indices and Sets
| = | Set of generators | |
| = | Set of scenarios for wind and solar | |
| = | Set of hours | |
| = | Set of years | |
| g | = | Index of generators, |
| = | Index of renewables scenarios, | |
| t | = | Index for hours, |
| = | Index for years, |
Parameters
| = | Potential | |
| = | Potential | |
| = | Load in hour | |
| = | Peak load in year, | |
| = | Maximum production of generator | |
| = | Maximum production of generator | |
| = | Maximum production of generator | |
| = | Maximum production of generator | |
| = | Generator type, |
Variables
| = | Normalised hourly load in hour | |
| = | Average load percent in hour | |
| = | Forecasted average load normalised load in hour | |
| = | Forecasted hourly load | |
| = | Power production for generator | |
| = | Power production for generator | |
| = | Power production for generator | |
| = | Power production for generator | |
| = | Status variable for commitment of generator |
Introduction
Kuwait, a small nation with a geographical area of approximately 17,800 km2 and a population of 4.1 million, sits upon vast crude oil reserves. Exports of oil products contribute to 90% of government revenue. Since there is an abundance of energy, the country provides both water and electricity at heavily subsidised rates (Alabdullah, Shehabi, and Sreenkath Citation2020; Malyshev, Alabdullah, and Sreenkath Citation2019) through its state-owned utility operator, the Ministry of Electricity, Water, and Renewable Energy (MEWRE). Due to its extreme desert climate and abundance of available energy to provide its citizens with subsidies, Kuwait, while small, has one of the highest rates of per capita energy consumption globally. Electricity consumption per capita reached 16.4 MWh in 2021 with a mean annual growth rate of 1.6% over 10 years (Ministry of Electricity and Water Citation2022). Electricity demand in Kuwait is continuously rising, reaching a peak load of 15.67 GW with an installed capacity of 20.2 GW in 2021 (Ministry of Electricity and Water Citation2022). In comparison, California with a population of approximately 39.4 million exhibited per capita electricity consumption of 7.06 MWh for 2021 (Nyberg Citation2023), less than half of the electricity consumption of Kuwait. Furthermore, approximately 31% of California’s energy mix is from renewables. In Kuwait, there is only one renewable power station and there are eight oil- and gas-fired power stations in Kuwait. The generation fleet consists of 48% steam turbines (ST), 40% gas turbines (GT) and 12% combined cycle gas turbines (CCGT) that use primarily oil products and natural gas for fuel. If Kuwait continues to grow at this level of electricity consumption, it will be unsustainable and derived oil export revenues will be affected because resources will need to be diverted to meet local needs.
Since the current power system consists mostly of conventional generation units powered by natural gas and oil products, the fuel demand is reaching levels that are affecting oil exports and thus government revenues. To counter the impact of the continuously rising electricity demand on oil export revenue, Kuwait has sought to invest in renewable energy (RE) to diversify its power generation mix. The late Amir of Kuwait, H.H. Sheikh Sabah Al-Ahmad Al-Sabah, set a goal of meeting 15% electricity demand from RE by 2030 (Alabdullah, Shehabi, and Sreenkath Citation2020; Malyshev, Alabdullah, and Sreenkath Citation2019). The Kuwait Institute for Scientific Research led this effort and supervised the completion and installation of the first phase of the Shagaya Renewable Energy Plant (SREP), consisting of a 50 MW parabolic trough concentrated solar power (CSP) plant with a 10-hour molten salt storage, a 10-MW photovoltaic (PV) plant, and a 10-MW wind power plant. This was part of a government initiative supported 100% by public funds. Along with this initiative, the initial consultancy studies and the development of a national energy strategy were sponsored by the Kuwait Foundation for Sciences (Alsayegh et al. Citation2017). It was followed by (Alabdullah, Shehabi, and Sreenkath Citation2020; Malyshev, Alabdullah, and Sreenkath Citation2019) which described future upcoming energy projects in Kuwait, including the construction of the second phase of SREP, planned to be a 1500 MW PV plant originally to be overseen by Kuwait Petroleum Corporation (KPC) and its subsidiary Kuwait National Petroleum Company (KNPC). However, the second phase was cancelled due to legislative reasons. The MEWRE and the Kuwait Authority for Partnership Projects (KAPP) are the only entities that have the mandate to construct power plants in the country (without a government initiative); that is KNPC did not have the authority to build electric generation without a government initiative providing it the mandate. Instead, the planned 1500 MW PV plant of phase 2 has been transferred to phase 3, to be overseen by KAPP. Efforts to diversify the generation mix of Kuwait, initially slowed by the collapse of oil prices in 2015, were exacerbated by the effects of the COVID-19 crisis on Kuwait’s economy. As a result, all projects in Kuwait, including RE projects, are likely to be delayed. Therefore, Kuwait is unlikely to meet its stated RE targets.
While there have been delays with adopting RE in Kuwait, eventually the third phase of SREP will be implemented. Kuwait will likely adopt a mix of PV and wind, especially in the subsequent phases. According to (Al-Rasheedi et al. Citation2020), photovoltaics and wind are the preferred RE technologies. Recently, PV technologies have reached a point where the levelised cost of energy (LCOE) can compete with gas-fired peak power plants (Kost et al. Citation2021; Lazard Citation2023). On-shore wind is a mature technology that shows promise in Kuwait. According to (Al-Rasheedi et al.), the capacity factor of the SREP wind turbines was around 40% in 2019.
The adoption of solar PV and wind technologies has rapidly increased worldwide. It is, thus, important to discuss some of the costs associated with commissioning these technologies. The levelised cost of energy (LCOE) of solar PV decreased from 0.417 $/kWh to 0.048 $/kWh in a global scale between 2010 and 2021. It is also estimated that the operation and maintenance (O&M) cost has declined due to the module efficiency improvements reducing the area required for every MW capacity of a utility-scale PV installed (International Renewable Energy Agency (IRENA) Citation2022). In the US, the O&M costs in 2020 were estimated 12$ kW/year compared to 29 $ kW/year in 2010. Reference (Pereira et al. Citation2013) estimates a construction time of 2 years for 100 MW solar PV plant while (U.S. Energy Information Administration (EIA) Citation2021) estimates that a 150 MW solar PV plant requires a construction time of 2 years. The construction cost of solar PV is estimated to be $1.3 million/MW and a fixed O&M cost of $15,970 /MW/year.
With wind RE technology, there is a vast difference in terms of cost. IRENA report highlighted that onshore wind LCOE prices declined from 0.102 $/kWh to 0.033 $/kWh from 2010 to 2021 in the global scale. The O&M cost of wind makes up around 30% of wind LCOE. In the US the O&M went from around $65 /kW/year to around $43 /kW/year (International Renewable Energy Agency (IRENA) Citation2022). Reference (Pereira et al. Citation2013) estimates a 2 year construction time for a 50 MW wind plant, while (U.S. Energy Information Administration (EIA) Citation2021) estimates a 3-year construction time to build a 200 MW plant. The construction cost of a wind plant ranges around $1.7 million /MW with fixed O&M cost of $27,570 /MW/year.
The integration of RE systems into Kuwait’s electric grid poses challenges that must be addressed. Without the availability of energy storage systems, RE technologies remain a variable source of electric generation. Greater flexibility in the system will be necessary in order to accommodate the variability introduced by RE generation (Bird, Milligan, and Lew Citation2013). System operators must constantly adjust the output levels of conventional generation units to match the load. Therefore, conventional generation units must be able to quickly adjust output levels to balance the system. The extent of required flexibility greatly depends on and is proportional to, the capacity of RE integrated into the system. In this paper, a visual representation of the ramping events that could occur under each scenario is presented and details regarding the need for flexibility are discussed.
Flexibility is defined as the ability of the system to quickly alter its output level to match the net load at any given time. It tends to become an issue with increasing shares of RE and is defined by the properties of the system (Crabtree et al. Citation2020), such as available inertia and ramping. Thus, systems with low initial flexibility tend to reach problematic stages earlier than systems with high initial flexibility. Balancing the electricity demand due to changes in the supply caused by the intermittent RE resources is an issue that can lead to decreased deployment of RE (Lund Citation2005). Failing to meet the system, required flexibility can lead to power balance violation, frequency deviation, and unavoidable curtailment of RE. Thus, given the stochastic nature of large-scale RE embedded in the grid, the need for increased system flexibility is essential (Nikolaidis, Chatzis, and Poullikkas Citation2019). Furthermore, power system operators should have sufficient accessible resources for significant up and down ramping. The integration of higher penetration from RE sources also requires more operating reserves; however, reserve levels should be carefully studied and optimised for the system to lower overall costs. Having increasingly more operating reserves is not always the best solution since reserve costs are high and could be minimised by a better understanding of the system (Bird, Milligan, and Lew Citation2013). An optimised solution could have lower operating reserves while still maintaining a balance of the system even during extreme events.
While Kuwait will not likely meet its original renewable energy goal, instead, the revised goal will be to meet 15% of the projected peak load demand in 2030 with renewable capacity. In this paper, we simulate the original goal (15% of annual energy generation), the new goal (15% of the peak RE capacity share), and two other policies (15% of peak load energy generation and 15% of total installed capacity) to show how different goals can affect outcomes.
It is important to note that this issue of interpretation of renewable targets is not specific to Kuwait. Generally, unless specified in the text of the law, the easiest interpretation is implemented by utilities. Different interpretations have vastly different outcomes. California is an example where aggressive renewable targets have become more specific over time, as policy makers have observed the consequences of misinterpretation by stakeholders (Cullenward and Weiskopf Citation2013; De León et al. Citation2018; Williams, Hancock, and McCarty Citation2015). California redefined its goal to meet retail sales, increasing from 20% in 2013 to 33% in 2020, then setting a goal of meeting 50% by 2030. California's interpretation of meeting the renewable portfolio standard is the relatively easier one, and the criteria is the ratio of total renewable generation to net load. The results presented in this paper highlight the need for careful definition of the target at the time of policy making.
The issue of targets ambiguity has been addressesed before, and the importance of a clear vision in setting renewable energy targets should always be the case to allow for an organised efforts that help adhering to these targets. Reference (Verhaegen et al. Citation2007) shows how the EU Europeans Commission targeted 21% of total community electricity consumption and the legislative process has resulted in confusion on the nature (absolute or proportional figures) and the subject (consumption or production) of the renewable energy electricity sources causing an obstacle on how the targets are being set in the most cost-efficient way. Reference (Ferroukhi et al. Citation2015), on the other hand, shows the importance of target settings for easier decision makings. The report also discusses the issue of target metric design and whether it should be established in a specific unit (capacity, energy) or relative moving baseline (Percentage). Advantages and disadvantages of each target metric are also discussed showing the monitoring and performance issues, while also affecting the investors’ and private operators’ decisions. The report suggests that different metric options could be merged and used to formulate a better understanding of the targets rather than leaving them ambiguous. This will lead to a more robust action plan. Therefore, the need for a persistent, clear, ambitious, accurate, non-confusing target is essential to drive a country from the position of target ambiguity to the position of target clarity.
This paper provides an analysis of how different policies can lead to vastly different outcomes through simulations that demonstrate the capacity size requirements to meet each of these policies and their associated effects on system operation. Since Kuwait will likely adopt PV and wind only, which are not dispatchable and lack large-scale energy storage, flexibility will be needed. To mimic the reality of the situation, there is no provision for energy storage in this paper. Rather, to demonstrate how much flexibility is needed, this paper assumes the required RE capacity to achieve policy targets will not have energy storage, key to the strategy of adopting renewables, especially at first when there is little or no energy storage. The paper calculates the flexibility needs of the grid based on different levels of PV and wind integration.
The remainder of this paper is organised as follows: section 2, methodology, describes the load forecast, dispatch protocols, and scenarios for the model, section 3, discusses the results of simulations, and section 4 conclusion provides our insight into the results of our simulations.
Methodology
Load forecast
This study focuses on the impact of adding RE to Kuwait’s power system in 2030 considering the current and future generation fleet. The first step in conducting this analysis is to forecast the electricity demand in 2030. Using 8 years of historical hourly load data (2008–2016), along with (1)–(4), the 2030 hourly load forecast was calculated. From (1), the historical hourly load data is normalised to the peak load for that particular year and a normalised yearly load curve is produced. This normalised yearly load curve is averaged by the hour, as seen in (2). By using (3), the shape of the load curve can be calculated, which then is multiplied by the MEWRE’s predicted peak load in 2030. Thus, we can obtain the forecasted 2030 hourly load curve (Alazmi Citation2018), shown in (4).
(1)
(1)
(2)
(2)
(3)
(3)
(4)
(4)
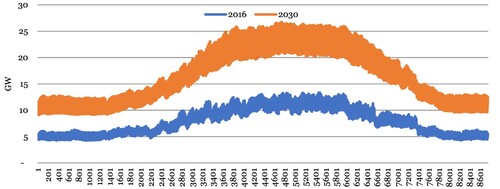
shows Kuwait’s load pattern in 2016 with the forecasted load shape for 2030. Even though updated data from 2020 and 2021 are available, we chose to use 2016 data due to anomalies present in 2020 and 2021 because of COVID-19 lockdowns. The main focus of this paper is to address the impact of increased RE penetration into Kuwait’s grid under several different interpretations of the RE targets. Updating the load data will likely have only minor impacts on this analysis and comparison of the scenarios. Peak load occurs usually during the summer period due to the extensive use of A/C units for space cooling. Kuwait’s harsh summer climate means that approximately 70% of the peak load is due to space cooling (Wood and Alsayegh Citation2014). In 2030, it is expected that the installed capacity will reach 32 GW, while the peak load is expected to reach 26.7 GW and the minimum load is expected to be 9.9 GW.
Figure 1. 2016 load shape with the forecasted 2030 load shape.
The next step in our analysis is to model the generation fleet of the MEWRE in 2030. The conventional generation fleet in 2030 is based upon plants that are not planned for decommissioning as well as planned capacity additions by the MEWRE reported in (Alabdullah, Shehabi, and Sreenkath Citation2020; Malyshev, Alabdullah, and Sreenkath Citation2019), (Alsayegh et al. Citation2017), and (Alazmi Citation2018). Since Kuwait has a goal to meet some of its electricity demand from renewables in 2030, solar photovoltaic and wind capacities are also added to the model (Alazmi Citation2018; Wood and Alsayegh Citation2014), (Kuwait News Agency Citation2018).
Dispatch model
The dispatch mechanism used in this model is based on the MEWRE’s communicated merit order approach according to the National Control Center (NCC) of the MEWRE. Baseload power plants are dispatched first, which are designed not for flexibility, but to ensure constant generation. Baseload production in Kuwait is achieved by conventional oil and gas-fired steam turbines (ST). The fleet of ST is expected to drop slightly in capacity from 8.9 GW in 2016 to 8.6 GW in 2030 (Malyshev, Alabdullah, and Sreenkath Citation2019). Furthermore, ST baseload generation serves another purpose in Kuwait, which is to produce water as part of a co-generation product. Thus, half of the ST generation is designated in the model as must-run generation to ensure sufficient water production. In the dispatch model, any renewable generation is curtailed even if it is available if the load falls below this must-run capacity.
MEWRE then utilises CCGT and simple-cycle (SC) gas turbines for load following and peak power demand. Both CCGT and SC units are designed with more flexibility and are thus dispatched after baseload ST. Regarding the dispatch of RE in Kuwait, the MEWRE has not communicated any guidelines. It currently accommodates any RE produced from SREP. In the model, generation from RE is the second highest merit to take advantage of the free available energy when available. The dispatch of solar PV is based on historical solar irradiance measurements at SREP (Al-Rasheedi et al. Citation2020). The dispatch from wind was based on wind speed, calculated at the hub height of current wind turbines built in Kuwait (Al-Nassar et al. Citation2020). The output was based upon these wind turbines, which are Gamesa G97 with a hub height of 78 m. Thus, in the model, the first half of ST generators are dispatched followed by RE generation, then the remainder of the ST generators, followed by the CCGTs, and finally by the OCGTs.
(5)
(5)
(6)
(6)
(7)
(7)
(8)
(8)
(9)
(9)
(10)
(10)
(11)
(11)
(12)
(12)
(13)
(13)
Note that in the model, the dispatch enforcement was based upon prioritising renewables. Thus, curtailment of renewables is allowed and is split evenly between solar and wind. This paper examines the potential needs for the Kuwaiti grid.
Scenarios
In this analysis, we simulate four policies. In 2030, the scenarios that have been simulated to represent these policies include meeting 15% of RE based on the Annual Energy Share (AES), Installed Capacity Share (ICS), Peak Capacity Share (PCS), and Peak Load Share (PLS).
The AES scenario was modelled to acquire RE capacity until 15% of the electricity demand in 2030 was met by RE generation. That is, PV and wind capacity is added to the 2030 generation fleet until the 15% energy requirement is met, which is based upon the forecasted 2030 electricity demand. The second scenario investigated was ICS, whose criteria was meeting 15% of installed capacity from renewables (PV and wind) by 2030. According to MEWRE (Alazmi Citation2018), it is expected that the installed capacity in 2030 will be approximately 30 GW. For this scenario, the model simply takes 15% of installed capacity and dispatches the RE generation based upon such acquired RE capacity. Similarly, the third scenario is based on capacity, however, the capacity is based upon the expected peak load in 2030 for the PCS scenario, 26.7 GW. Finally, the last scenario, PLS, makes sure that the installed renewable capacity is able to generate 15% of the load during the peak hour. shows and compares the differences between each of the scenarios simulated.
Table 1. Comparison of each of the simulated scenarios.
Each of these scenarios was simulated with both PV and wind supplying a proportion of the energy or capacity (depending upon the scenario’s metric). Therefore, for each scenario, PV was simulated to fulfil 100% to 0% and wind served the remainder.
Results and discussion
The foundation of our investigation begins with the forecasted load for 2030, which was based on the hourly load curve from the MEWRE (Wood and Alsayegh Citation2014). The forecasted energy demand in 2030 is expected to be 148.7 TWh. Using this forecast, four distinct scenarios (AES, ICS, PCS, and PLS) were simulated. In this section, these scenarios are compared based on the capacity required, the energy produced, and the percent share of energy supplied. Furthermore, details are given on the effects each scenario has on operations of the power system and the resulting ramping requirement due to each scenario’s percent of RE penetration as a metric to quantify the impacts of each scenario.
The AES was predicated on meeting 15% of the annual energy demand from RE in 2030. Based on this criterion, the model acquired approximately 22 TWh of renewable energy. However, results vary greatly depending on the proportion of wind versus PV. When wind is the only renewable technology, Kuwait requires 9.7 GW of installed wind capacity. Furthermore, Kuwait is unable to accommodate all the wind and thus 1.47 TWh is curtailed and ramping events are significantly high, reaching a maximum of approximately 15.5 GW/hr. The average ramp up requirement is 1.3 GW/hr. Ramping is calculated as the difference in net load (load minus renewable generation) between hours. The Average Ramp Rate (ARR) is calculated using Equation (14) (for ramp-up events >0, for ramp-down events <0).
(14)
(14) The ramping rate can be calculates using Equation (15).
(15)
(15) The ramping rate in time t is calculated by subtracting the net load in hour t with the net load in the previous hour. The maximum and minimum ramp up and down can be calculated by taking the highest value and the lowest value for the ramping events in all t hours of simulation respectively.
If PV is the only renewable technology, Kuwait requires 11.43 GW of installed PV capacity, but curtailment is only 0.8 TWh. In addition, ramping events are significantly fewer compared to only having wind. The maximum ramp event is approximately 4.5 GW/hr and the average ramping up is 1.2 GW/hr. This is due to the fact that generation from PV is more predictable than wind power generation. PV energy production is based upon the solar irradiance available, which increases from sunrise to midday and then decreases until sunset, whereas wind power production is much more variable and ramps up and down based on wind speed.
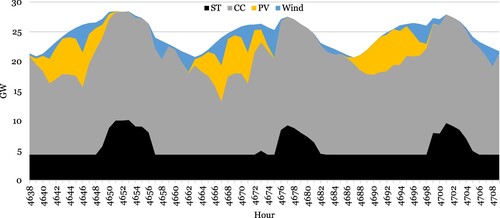
If the mix from renewables is approximately even (50% from PV and 50% wind), the total wind capacity needed is 4.5 GW and the total PV capacity is 5.5 GW. This solution is even more desirable because curtailment is only 0.23 TWh. Finally, the maximum ramping event is approximately 8.8 GW/hr and the average ramp up is 9.9 GW/hr. All of these results can be viewed in . Additionally, the effects of the AES scenario on the load curve simulated for 50% PV and 50% wind can be viewed in , which displays three winter days, and , which displays three summer days. In , multiple ramp events occur due to the variability in PV energy, which is likely due to dust or cloud. A ramp event, as shown in , is a sharp ramp down or ramp up by thermal generation. There was also some curtailment of wind. Furthermore, in the AES scenario with the mix of renewable energy being split evenly, RE reaches a maximum fulfilment of approximately 75% of electricity demand. At that particular hour, 23% of the RE is supplied by PV and the remainder by wind. The high penetration of RE means that Kuwait’s power system will require more ramping capability.
Figure 2. AES simulated for three winter days where the total electricity demand was fulfilled with 50% PV and 50% wind.
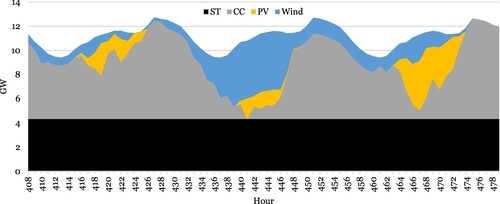
Figure 3. AES simulated for three summer days where the total electricity demand was fulfilled with 50% PV and 50% wind.
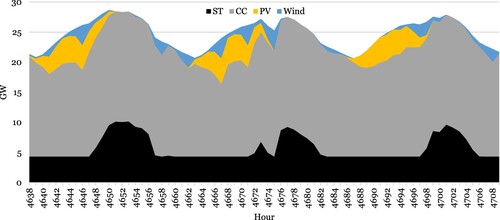
Table 2. Simulation results comparing all three scenarios in terms of expect energy, required capacity, and percent share of total energy.
The second scenario, ICS, acquired 4.24 GW of renewable capacity. When this capacity was exclusively wind, 10.27 TWh of renewable energy was produced and thus approximately 7% of the load was met from renewables. Furthermore, there was a small amount of curtailment, which amounted to 0.04 TWh. Additionally, with the capacity being exclusively wind, the maximum ramping event was 7.7 GW/hr and the average ramp up was 0.7 GW/hr.
Alternatively, when the capacity was exclusively PV, 8.52 TWh of renewable energy was produced, fulfilling approximately 5.8% of demand. There was no curtailment when renewable capacity was only PV and the maximum ramping event was approximately 1.9 GW/hr with an average ramp up of 0.5 GW/hr.
When the ICS scenario acquired PV and wind capacity evenly, the amount of energy supplied from renewables was 9.42 TWh, which is less than that of wind exclusively. However, under this evenly distributed capacity simulation, there was no curtailment, similar to the exclusive PV simulation. Finally, the ramping events were more severe where the maximum was approximately 4.1 GW/hr and the average ramp up was 0.5 GW/hr. For the ICS scenario simulated with capacity distributed evenly between PV and wind, the dispatch can be seen in (winter day) and (summer day). With the capacity split in half between wind and PV, the ICS scenario witnesses a maximum, meeting 56% of total electricity demand in a particular hour where 17% is supplied by PV and 39% by wind.
Figure 4. ICS simulated for three winter days where the RE capacity was fulfilled with 50% PV and 50% wind.
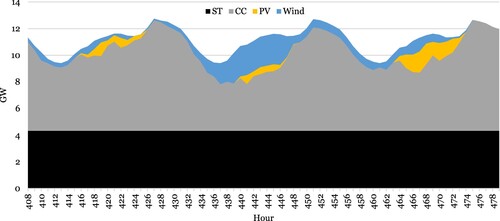
Figure 5. ICS simulated for three summer days where the RE capacity was fulfilled with 50% PV and 50% wind.

Comparatively, the ICS and PCS were similar. However, the PCS scenario needs slightly less capacity to meet its target. Thus, the annual energy generated from RE is lower. Both scenarios are easily achieved under current RE development plans devised by Kuwait. Under this PCS scenario, approximately 4 GW of renewable capacity is acquired. When the PCS scenario is simulated exclusively with wind capacity, the energy from renewables is 9.73 TWh, fulfilling 6.58% of demand. In addition, when PCS is simulated with wind capacity only, there is 0.03 TWh of curtailment. As for the ramping, when the capacity was exclusively wind, the maximum was 7.3 GW/hr and the average ramp up was 0.7 GW/hr.
Conversely, when PCS is simulated with PV capacity only, the energy from renewables is 8.06 TWh, which supplies approximately 5.5% of total electricity demand. Ramping due to renewables was significantly lower when the capacity was exclusively PV with the maximum being 1.8 GW/hr and the average ramp up was 0.5 GW/hr.
When the PCS scenario was simulated with half the capacity coming from PV and half from wind, the amount of energy from renewables was 8.91 TWh. This fulfilled 6.03% of total electricity demand. Under this arrangement, there was no curtailment. Regarding the ramping due to renewables, the maximum was 3.9 GW/hr and the average ramp up was 0.5 GW/hr. and display how renewables are dispatched under the PCS scenario when the capacity is split evenly for PV and wind. Finally, under the PCS scenario where the capacity was split evenly, the maximum energy supplied from RE was 53%, supplied by 16% PV and 37% wind.
Figure 6. PCS simulated for three winter days where the peak capacity was fulfilled with 50% PV and 50% wind.

Figure 7. PCS simulated for three summer days where the peak capacity was fulfilled with 50% PV and 50% wind.
The final scenario, PLS, was based on having 15% RE supply the peak load in 2030. Due to this criterion, the PLS scenario had the greatest variation in results. When the PLS scenario was simulated with only wind fulfilling 15% of peak load, the model had to acquire 26.7 GW of wind. This is due to wind energy production not being correlated with peak demand. However, under this arrangement, the system supplied a high amount of energy, reaching 43.74 TWh, which fulfilled 29.59% of total energy demand. Yet when the scenario had wind exclusively, there was a great amount of curtailment, reaching 21.18 TWh. Furthermore, the maximum ramp was 20.1 GW/hr and the average ramp up was 2.5 GW/hr. Obviously, this is not an appropriate solution for Kuwait, but neither is exclusive adoption of PV.
When this scenario was simulated with PV exclusively, the model needed to acquire 10.2 GW of capacity. As a result, this supplied 20.14 TWh or rather 13.62% of total electricity demand. With exclusive PV, there was still some curtailment, which amounted to 0.36 TWh. Finally, the ramping under the PLS scenario with PV exclusively reached a maximum of 4.7 GW/hr and the average ramp up was 1.1 GW/hr.
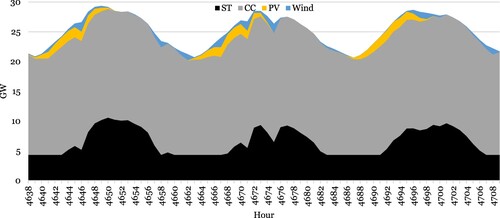
The PLS scenario became more reasonable when the peak load was fulfilled from PV and wind evenly. As a result, the model acquired 7.8 GW of PV and 6.25 GW of wind capacity. From this capacity, energy generated from renewables reached 29.72 TWh, which supplied 20.11% of total electricity demand. With regards to ramping needs due to renewables, under this composition the maximum ramping event was 11.1 GW/hr and the average ramp up was 1.4 GW/hr. In and , the PLS scenario with PV and wind supplying the peak load evenly is displayed for three winter and summer days, respectively. Due to the increased capacity needed to meet this metric, the operations are similar to the AES. Finally, the highest penetration of renewables under the PLS scenario where the energy was split evenly between PV and wind reached 81%. PV supplied 28% and wind supplied 53% of the electric energy in that particular hour.
Figure 8. PLS simulated for three winter days where the peak load was fulfilled with 50% PV and 50% wind.
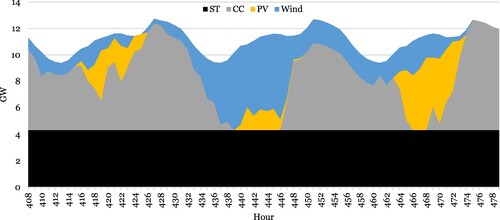
Figure 9. PLS simulated for three summer days where the peak load was fulfilled with 50% PV and 50% wind.
Potential reduction in CO2 emissions
With a fleet of conventional generators comprised of steam turbines, open-cycle gas turbines, and combined-cycle gas turbines, the MEWRE provides electricity and water to Kuwait. This fleet is fuelled by heavy fuel oil, gas oil, crude oil, and natural gas (Ministry of Electricity and Water Citation2022), (Kuwait National Petroluom Company Citation2019; Wood and Alsayegh Citation2014). Natural gas is not endogenous to Kuwait, which began importing liquified natural gas starting in 2009 (U.S. Energy Information Administration Citation2015, July 16). Furthermore, natural gas has become the dominant fuel for electric generation. In 2019, natural gas accounted for approximately 60% of primary fuel for electric generation (Joint Organisations Data Initiative Oil and Gas, Joint Organisations Data Initiative (JODI) Jan. Citation2021). In below, data are aggregated from (Ministry of Electricity and Water Citation2022), (Kuwait National Petroluom Company Citation2019; Wood and Alsayegh Citation2014) to provide the yearly consumption of fuels by the MEWRE.
Table 3. Report fuel consumed by MEWRE power stations total (Kuwait National Petroluom Company Citation2019; Ministry of Electricity and Water Citation2022; Wood and Alsayegh Citation2014) as well as average energy content and emission factors used to calculate CO2 emissions (Ministry of Electricity and Water Citation2018; Ministry of Electricity and Water Citation2019; U.S. Environmental Protection Agency Citation2023).
Utilising this fuel data and the emission factors provided in (British Petroleum Energy Economics Team Citation2020; U.S. Environmental Protection Agency Citation2023), which are 53.06 tons of CO2 per TJ for natural gas, 74.92 tons of CO2 per TJ for gas oil, 75.1 tons of CO2 per TJ for heavy fuel oil, and 74.54 tons of CO2 per TJ for crude oil. The avoided emission from each scenario is calculated. With the integration of natural gas into the fuel mix, emissions in Kuwait due to electric power generation have been trending lower and, in 2019, emissions were approximately 68 tons of CO2 per TJ. In comparison, emissions were approximately 62 tons of CO2 per TJ in 2010. For the purposes of this paper, we utilise the average emissions of 65 tons of CO2 per TJ over the period of 2010 to 2019. To calculate the CO2 per TJ, Equation (16) is used.
(16)
(16) The CO2_per_TJ calculates CO2 emissions per terajoules (TJ), ECi is the average energy content of fuel product i. FCi is the fuel consumption of fuel product i, and CFi is the conversion factor for fuel product i. Note that the conversion factors used are as follows: 1 Thousand cubic feet = 28.316 m3, 1 gas oil barrel = 0.133 m3, 1 heavy fuel oil barrel = 0.149 m3, and 1 crude oil barrel = 0.137 m3. The total CO2 emissions can be calculated using Equation (17). In the equation, FC is the fuel consumption for year y, Ec is the average energy content for fuel product, and CF is the conversion factor for the fuel product.
(17)
(17) In the future, Kuwait is expected to make further reduction in emissions with the Kuwait National Petroleum Corporation’s (KNPC) Clean Fuel Project Initiative, where KNPC will provide the MEWRE with low sulphur fuel oil (Al-Mutairi Citation2018).
To calculate the expected emission reduction in the scenarios, Equation (18) is used.
(18)
(18) The total RE energy that is produced in TWh is converted to Peta joules and multiplied by the average CO2 emissions in TJ. The output is divided by 1000 to get the emission reductions in million tons of CO2 as shown in .
Table 4. Derived emission reductions by scenario.
In terms of emission savings, the PLS scenario reduced emissions the most, which is expected because this scenario produces the most renewable energy, replacing conventional generation. Followed by the PLS scenario, the AES scenario, which was the original goal of Kuwait, reduces emissions by approximately 5 million tons of CO2. Finally, the ICS and PCS scenarios reduce emissions the least due to the lower renewable energy generation in these scenarios. Remarkably, across all scenarios, simulations with more wind energy production reduce emissions more than simulations with higher PV production. This is due to the need for increased wind energy capacity needed to meet the related scenario’s criteria. Thus, with more wind capacity, more renewable energy generation is produced over the year, resulting in lower emissions overall. below details the reduction in CO2.
Conclusions and policy implications
Kuwait has a goal of incorporating renewables into its power system. Originally, the statement of H.H. the Amir of Kuwait at the UNFCC conference in Doha, Qatar in 2012 was to meet 15% of electricity demand from renewables in 2030. Today, the Higher Council of Energy has set the goal to have renewable capacity meet 15% of the forecasted peak load in 2030. While this is the goal set today, Kuwait will eventually adopt more renewables. To demonstrate the potential effects of higher penetration of renewables on the Kuwaiti power system, this paper developed a model to simulate four scenarios: annual energy share, annual capacity share, peak capacity share, and peak load share. The model was based on a forecast of the load shape using Kuwait’s load curve for 7 years and MEWRE’s peak load forecast for 2030.
The results show that the AES scenario, the original goal from H.H. the Amir of Kuwait, leads to the second-highest installed capacity of renewables. This is due to the criterion to meet 15% of annual electric energy demand from renewables in 2030. The ICS and PCS (the current policy to be adopted in Kuwait) were similar. These two scenarios are easier targets for Kuwait today and could serve as a catalyst for increased adoption of renewables. The PCS had the lowest installed capacity and thus served the load with the least amount of RE. When the metric was based on the ICS scenario, the amount of energy fulfilled from RE was even higher than the PCS. This is due to RE not being fully correlated with the peak and thus the model must acquire more RE capacity to have available during the peak load hour.
The results in each of these scenarios varied based on the amount of PV versus wind acquired. From these results, it can be seen that RE from wind, while not able to fulfil the peak as well as PV, is very good at supplying a higher amount of energy overall with lower overall capacities needed. In contrast, PV is correlated with the peak, which is due to the correlation between high solar irradiance and the need for space cooling. The right combination of these technologies in the power supply mix leads to minimal curtailment regardless of which scenario Kuwait chooses to embark upon. Under the current circumstances, Kuwait has adopted the PCS scenario as its goal. However, the mix of PV and wind has yet to be decided. This paper clearly demonstrates that wind is very desirable because it does provide more energy over the year compared to non-dispatchable PV. Thus, if the PCS scenario is to be formally adopted, Kuwait should consider the mix of 75% PV and 25% wind.
Regardless of the policy adopted, Kuwait will eventually include more and more renewables in its power system. The simulations confirmed that adoption of increased shares of renewables requires more flexibility. Operators will have to adjust conventional generation outputs to meet fluctuating production from RE, especially non-dispatchable RE. In winter, while demand is low and the availability of renewables is still high, the variability of RE generation is high as well. Thus, electric power generation from RE will fluctuate more in winter. The solution is either curtailment, demand-response, or re-dispatching conventional generation. However, in summer, RE generation (from PV especially) correlates well with electricity demand in Kuwait due to the need for space cooling in the harsh summer months and the high availability of solar irradiance. Regardless of the goal today, to move Kuwait into a more sustainable energy future, renewables are required and thus operators and decision-makers of Kuwait need to be aware of the issues that have been presented in this paper.
Acknowledgments
This work was partially supported by the Kuwait Foundation for Advancement of Sciences under Grant # PR18-15EC-01. Support from the General Secretariat of the Supreme Council of Planning and Development of Kuwait and the United Nations Development Programme of Kuwait are also appreciated.
Disclosure statement
No potential conflict of interest was reported by the authors.
Additional information
Funding
References
- Al-Mutairi, K. 2018. “KNPC Tech International Symposium on Residue Hydrotreating 2017 Special Edition,” Kuwait National Petroleum Company Corporate Communication Department, vol. 2. April 2018. [Online] https://www.knpc.com/KNPC/media/pdf/Issue02.pdf.
- Al-Nassar, W., S. Al-Hajraf, A. A. Al-Enizi, and J. Al-Awadhi. 2020. Potential Wind Power Generation in the State of Kuwait.” Renewable Energy 30: 2149–2161. https://doi.org/10.1016/j.renene.2005.01.002
- Al-Rasheedi, M., et al. 2020. “Optimization of the Technology Mix Master Plan for Kuwait’s Shagaya Renewable Energy Park until 2030,” Sept. 2020 – submitted for review.
- Alabdullah, Y. M., M. Shehabi, and K. J. Sreenkath. 2020. “Kuwait Energy Outlook 2020,” Kuwait Institute for Scientific Research, Kuwait City, Kuwait, Feb. 2020. Online - Accessed July 09, 2020. http://www.kisr.edu.kw/en/facilities/energy-building/?research=1.
- Alazmi, A. 2018. “Energy in Kuwait,” Ministry of Electricity and Water – Private Sector Projects Dept., Kuwait City, Kuwait, 2018.
- Alsayegh, O., W. Albazzaz, A. Alasfour, and W. Malek. 2017. “The future of Kuwait’s energy system: mitigating threats and seizing opportunities-white paper on a sustinable national energy strategy”, Kuwait Institute for Scientific Research, Kuwait City, Kuwait, Tech. Report. EU061C, Apr. 2017.
- Bird, L., M. Milligan, and D. Lew. 2013. “Integrating Variable Renewable Energy: Challenges and Solutions” NREL, USA, Tech. Report. NREL/TP-6A20-60451, Sep 2013. Online - Accessed July 09, 2020]. https://www.nrel.gov/docs/fy13osti/60451.pdf.
- British Petroleum Energy Economics Team. 2020 “Energy Outlook 2020 Edition,” British Petroleum. Jan. 2021. [Online]. https://www.bp.com/content/dam/bp/business-sites/en/global/corporate/pdfs/energy-economics/energy-outlook/bp-energy-outlook-2020.pdf.
- Crabtree, G., et al. 2020. “Integrating Renewable Electricity on the Grid,”, “American Physical Society, Washington D.C., USA, 2011. [Online- Accessed July 09, 2020. https://www.aps.org/policy/reports/popa-reports/upload/integratingelec.pdf.
- Cullenward, D., and D. Weiskopf. 2013. “Resource Shuffling and the California Carbon Market,” Environmental and Natural Resources Law & Policy Program – Stanford School of Law, July 18, 2013. Online – Accessed Nov. 2020. https://law.stanford.edu/wp-content/uploads/sites/default/files/publication/440262/doc/slspublic/Resource%20Shuffling%20-%20Cullenward%20and%20Weiskopf.pdf.
- De León, et al. 2018. “SB-100 California Renewables Portfolio Standard Program: emissions of greenhouse gases,” California Legislative Information, Sept. 10, 2018. Online – Accessed Nov. 2020. https://leginfo.legislature.ca.gov/faces/billTextClient.xhtml?bill_id=201720180SB100.
- Ferroukhi, R., S. Vinci, D. Nagpal, D. Hawila, A. Khalid, A. Lopez-Peña, and T. Hodges. 2015. Renewable Energy Target Setting. International Renewable Energy Agency.
- International Renewable Energy Agency (IRENA). 2022. Renewable Power Generation Costs in 2021. Abu Dhabi, United Arab Emirates: IRENA, 2022. Online- Accessed May 1 2023. https://www.irena.org/publications/2022/Jul/Renewable-Power-Generation-Costs-in-2021.
- Joint Organisations Data Initiative Oil and Gas, Joint Organisations Data Initiative (JODI). Jan. 2021. [Online]. http://www.jodidb.org/ReportFolders/reportFolders.aspx?sCS_referer=&sCS_ChosenLang=e.
- Kost, C., S. Shammugam, V. Fluri, D. Peper, A. Davoodi Memar, and T. Schlegl. 2021. Current and Future Cost of Photovoltaics: Long-term Scenarios for Market Development, System Prices and LCOE of Utility-Scale PV Systems [PDF]. Fraunhofer Institute for Solar Energy Systems ISE. 2021. [Online- Accessed May 2023. https://www.ise.fraunhofer.de/content/dam/ise/en/documents/publications/studies/Current-and-future-cost-of-photovoltaics.pdf.
- Kuwait National Petroluom Company. 2019. “Al-Dibdibah Solar Project Team Receives British Embassy Delegation,” KNPC, Al-Ahmadi City, Kuwait, Mar 2019 [Online - Accessed July 09, 2020. https://www.knpc.com/en/media/news/2019/al-dibdibah-solar-project-team-receives-british-embassy-delegation.
- Kuwait News Agency. 2018. “Kuwait eyes 15 pct-sourced power by 2030,”, KUNA, Kuwait, Sep 2018. [Online - Accessed July 09, 2020. https://www.kuna.net.kw/ArticleDetails.aspx?id=2748072&language=en#.
- Lazard. 2023. “Lazard's LCOE+ analysis,” April 2023. Online- Accessed May 01, 2023. https://www.lazard.com/media/typdgxmm/lazards-lcoeplus-april-2023.pdf.
- Lund, H. 2005. “Electric Grid Stability and the Design of Sustainable Energy Systems.” International Journal of Sustainable Energy 24 (1): 45–54. https://doi.org/10.1080/14786450512331325910.
- Malyshev, T., Y. M. Alabdullah, and K. J. Sreenkath. 2019. “Kuwait Energy Outlook 2019,” Kuwait Institute for Scientific Research, Kuwait City, Kuwait, Feb. 2019. [Online - Accessed: Jul 09, 2020] Available: http://www.kisr.edu.kw/en/facilities/energy-building/?research=1.
- Ministry of Electricity and Water. 2018. “Electrical Energy 2018”, Statistics Dept. & Information Centre, Kuwait City, Kuwait, 2019.
- Ministry of Electricity and Water. 2019. “Electrical Energy 2019”, Statistics Dept. & Information Centre, Kuwait City, Kuwait, 2020. Online - Accessed July 09, 2020. https://www.mew.gov.kw/media/m3xhaphz/%D9%83%D8%AA%D8%A7%D8%A8-%D8%A7%D9%84%D8%B7%D8%A7%D9%82%D8%A9-%D8%A7%D9%84%D9%83%D9%87%D8%B1%D8%A8%D8%A7%D8%A6%D9%8A%D8%A9-%D8%A5%D8%B5%D8%AF%D8%A7%D8%B1-2020.pdf.
- Ministry of Electricity and Water. 2022. “Electrical Energy 2022”, Statistics Dept. & Information Centre, Kuwait City, Kuwait, 2018. Online - Accessed May 01, 2023. https://www.mew.gov.kw/media/ux0htsox/electricity-annual-report-21.pdf.
- Nikolaidis, P., S. Chatzis, and A. Poullikkas. 2019. “Renewable Energy Integration Through Optimal Unit Commitment and Electricity Storage in Weak Power Networks.” International Journal of Sustainable Energy 38 (4): 398–414. https://doi.org/10.1080/14786451.2018.1516669.
- Nyberg, M. 2023. “2021 Total System Electric Generation,” California Energy Commission. Online - Accessed May 01, 2023. https://www.energy.ca.gov/data-reports/energy-almanac/california-electricity-data/2021-total-system-electric-generation.
- Pereira, A. O., R. C. da Costa, C. do V. Costa, J. de M. Marreco, and E. L. La Rovere. 2013. “Perspectives for the Expansion of new Renewable Energy Sources in Brazil.” Renewable and Sustainable Energy Reviews 23: 49–59. https://doi.org/10.1016/j.rser.2013.02.020.
- U.S. Energy Information Administration. 2015, July 16. Kuwait, a leading oil exporter, relies on imports of liquefied natural gas. Online- Accessed May 01, 2023. https://www.eia.gov/todayinenergy/detail.php?id=2310.
- U.S. Energy Information Administration (EIA). 2021. “Table 8.2. Cost and performance characteristics of new electricity generating technologies,” Annual Energy Outlook 2021, Online – Accessed May 1 2023. https://www.eia.gov/outlooks/aeo/assumptions/pdf/table_8.2.pdf.
- U.S. Environmental Protection Agency. 2023. “GHG Emission Factors Hub,” EPA. Online- accessed May 3, 2023]. chromeextension://efaidnbmnnnibpcajpcglclefindmkaj/https://www.epa.gov/system/files/documents/2023-03/ghg_emission_factors_hub.pdf.
- Verhaegen, K., L. Meeus, B. Delvaux, and R. Belmans. 2007. “Electricity Produced from Renewable Energy Sources—What Target are we Aiming for?” Energy Policy 35 (11): 5576–5584. https://doi.org/10.1016/j.enpol.2007.06.004.
- Williams, Allen, Monning Hancock, and McCarty. 2015. “Clean Energy and Pollution Reduction Act of 2015,” Official California Legislative Information, Feb. 24, 2015. Online - Accessed Nov. 2020. http://www.leginfo.ca.gov/pub/15-16/bill/sen/sb_0301-0350/sb_350_bill_20151007_chaptered.html.
- Wood, M., and O. A. Alsayegh. 2014. “Impact of Oil Prices, Economic Diversification Policies and Energy Conservation Programs on the Electricity and Water Demands in Kuwait.” Energy Policy 66: 144–156. https://doi.org/10.1016/j.enpol.2013.10.061
