
 ?Mathematical formulae have been encoded as MathML and are displayed in this HTML version using MathJax in order to improve their display. Uncheck the box to turn MathJax off. This feature requires Javascript. Click on a formula to zoom.
ABSTRACT
This study evaluates the techno-economic feasibility of integrating fuel cells into stand-alone power generation systems, combined with different technologies such as diesel generators, wind turbines, and batteries. An optimisation analysis was performed using the Hybrid Optimization Model for Multiple Energy Resources (HOMER) software to minimise energy costs and several system architectures were obtained for different operating scenarios. The performance and cash flow of the selected system were included. The results suggest that the combination of traditional technologies for fuel cell power generation could be feasible for a country like Colombia, depending on economic factors such as the Consumer Price Index (CPI), the discount rate, and the availability of renewable resources. The proposed system achieves a Levelized Cost of Electricity (LCOE) of $0.112/kWh, comparable to state-of-the-art systems in the literature. This research contributes to the global effort of transitioning to alternative energy sources and reducing carbon emissions.
1. Introduction
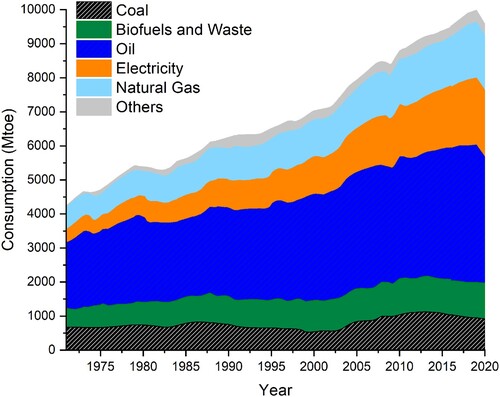
In 2019, approximately 81% of the total energy consumed globally came from fossil fuels, namely coal, natural gas, and oil (IEA Citation2021). In four decades, humanity has doubled its energy consumption (see ), starting from 194 EJ in 1973 to 418 EJ in 2019, and this trend is expected to continue in the coming years. The intensive use of fossil fuels has been linked to the increase in Greenhouse Gas (GHG) emissions causing global warming (Duman and Güler Citation2018). Renewable energy is considered one of the mitigation options available to reduce the emissions of the electricity sector.
Figure 1. World total final consumption (TFC) by fuel (Mtoe).
The consumption of electric energy in the last four decades has quintupled. It represented 20.4% of the total world energy consumption in 2020 compared to the 9.48% share in 1973. This increase means that it is necessary to improve technologies for generating and storing electrical energy, mainly those with a sustainable operation and whose negative impact on the environment is as low as possible.
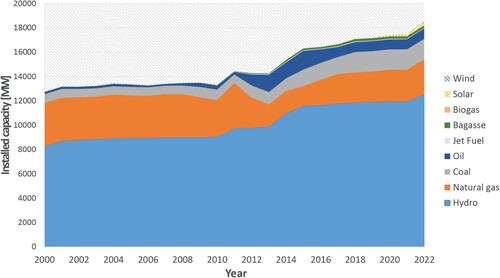
The Colombian electricity sector has maintained a long-standing tradition of reliance on hydro and thermal generation as its primary sources of energy production. On average, hydro generation accounts for 71% of the total energy production while thermal generation constitutes 28%. The utilisation of other renewable energy sources, including wind and biomass, is limited and constitutes a mere 1% of the annual energy production. presents a visual representation of the evolution of the installed capacity in the country based on fuel type from 2000 to 2022.
Figure 2. Historical installed capacity by fuel type in Colombia.
Adapted from (UPME Citation2023).
Regarding the costs, the Levelized Cost of Electricity (LCOE) is a parameter usually considered. This cost refers to the calculation of the current value of electricity generation over the lifespan of the system, in comparison to the total amount of energy produced. These costs include the initial investment and operating expenses (maintenance, fuel, among others). For hybrid power systems, which do not serve thermal load, the LCOE is defined in Equation 1
(1)
(1) In Equation 1,
is the total annualized cost, which depends on the NPC (Net Present Cost), the annual real discount rate
, and the project lifetime.
is the total electrical load served; in this study, it is the AC primary load served by the hybrid power system, because DC primary loads and deferrable loads are not considered.
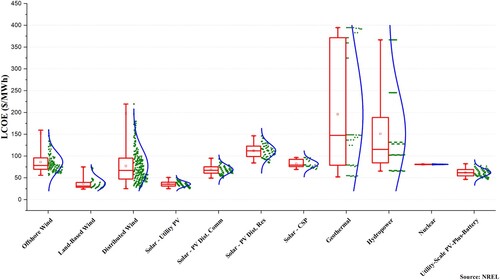
shows the costs of different technologies. Among these, wind energy, hydro, and fuel cells stand out due to their low costs.
Figure 3. LCOE of different types of technology in the period 2020–2022.
Adapted from (NREL Citation2022).
Fuel cells are considered a promising technology for electricity generation using renewable sources, and they can be integrated with traditional generation systems based on fossil fuels. Stand-alone systems using Diesel generators are usually implemented in off-grid areas in Colombia to supply energy to small communities. However, the increasing trend in production and the fuel cost itself requires introducing the region with environment-friendly and low-cost energy production systems. Hybrid system design requires the evaluation of technical factors related to the equipment power and performance. economic factors, which define the cost of energy also require consideration. In the present techno-economic study, the authors assessed these factors jointly to evaluate if a proposed hybrid system is suitable for a specific location.
Amutha and Rajini (Citation2015) have presented a study of the performance of hybrid systems used to supply power to telecommunication systems in remote locations in India, considering economic and technical factors. According to this study, the integration of fuel cells with solar, wind, and battery generation systems are technically and economically viable. For applications oriented to telecommunication systems in remote areas, specifically an island in the Adriatic Sea, Bezmalinović, Barbir, and Tolj (Citation2013) carried out a study in which the authors indicate that although Diesel generators still have a slight advantage in terms of the LCOE, the uncertainty of the oil market could change this situation in the future. Considering the environmental effects of oil emissions, fuel cells, which are zero-emission engines, are desirable. However, they need to overcome the limitations in the storage of hydrogen and the high costs of the components.
Napoli et al. (Citation2015) reviewed the integration of polymer electrolyte fuel cells (PEMFC) and solid oxide fuel cells (SOFC) in residential-scale cogeneration systems, considering sustainability objectives proposed in EU 2020 (European Commission Citation2010). The simulation results show that fuel cells reduce electric and thermal primary energy requirements and reduce households’ dependence on the grid.
Silva, Severino, and De Oliveira (Citation2013) conducted a study focused on evaluating the use of a system based on photovoltaic cells integrated with fuel cells and batteries installed in an isolated community of the Amazon in Brazil. In this case, due to the high costs of fuel cells, the use of batteries for the storage of the energy produced by the photovoltaic cells is still a feasible option.
In the case of South America, there have been some investigations related to PEM fuel cells, both experimental and modelling. For example, (Carvajal-Osorio, Babativa, and Alonso Citation2010) in 2010, Carvajal-Osorio, Babativa, and Alonso (Citation2010) carried out a technical-economic study to evaluate hydrogen production in a future hydrogen economy in Colombia. They took as a reference the Amoyá power station, located in Tolima, under the hypothesis that hydrogen generation was carried out by electrolysis. They concluded that there are positive indications of the technical, economic, and environmental feasibility of using hydrogen produced in Colombia.
In 2013 Montoya García and Reyes Pineda (Citation2013) proposed the optimisation of a fuel cell. They carried out an experimental study on a cylindrical fuel cell used to perform an electrolysis process oriented to hydrogen production. In the same year, the Colombian newspaper El Espectador published a news item that mentions a study carried out at the Universidad Nacional (Universidad Nacional de Colombia Citation2013) referencing the work from Aguilar (Aguilar-Arias and Hotza Citation2013). They stated that they had found a way to optimise solid oxide fuel cells by modifying the electrode supports, which increased cell efficiency.
In Egypt (Samy, Barakat, and Ramadan Citation2020), India (Singh, Baredar, and Gupta Citation2017), Nigeria (Onwe, Rodley, and Reynolds Citation2020), and Iran (Baniasad Askari et al. Citation2014; Fakour, Behbahani-Nia, and Torabi Citation2018), techno-economic studies for hybrid systems, which include fuel cells, have shown that these systems can reliably supply energy for unconnected areas.
Although many research works have been published around the fuel cell operation, modelling, experimental characterisation, and techno-economic assessment for South American countries, considered emerging economies, these have not been widely studied. In addition, renewable resource availability differs in global and local contexts. For these reasons, detailed studies focused on this region are required. So far, research on hybrid power systems using fuel cells in South America is almost inexistent. According to Web of Science USA, Italy, China, and England, are the countries with many publications about techno-economic/feasibility studies for fuel cells integrated with hybrid power systems. On the other hand, publications from countries like Brazil and Mexico represent less than 5% of the studies; therefore, more research is required to analyze the Latin American scenario.
It is necessary to define optimal configurations, including technical and economic factors considering the local resources and economic variables.
Hybrid systems are a potential solution for countries with multiple available energy sources, like solar power, wind power, hydropower, and biomass, but economic feasibility must be assessed (Barik, Jaiswal, and Das Citation2022; Pujari and Rudramoorthy Citation2022).
Diesel generators require a lower initial capital expenditure than most renewable energy-based generation systems, including fuel cells. However, they have higher operational costs, primarily due to fuel consumption. Due to their inherent variability, renewable energy sources like wind and solar radiation introduce uncertainty in the system availability under load changes. Merging dynamic supply and dynamic demand is a critical challenge. Thus, it is necessary to include storage equipment like batteries, supercapacitors, and storage tanks. The integration of systems that include energy storage in hydrogen is of particular interest in the current paper. This hydrogen can be generated from water using an electrolyzer powered by excess energy coming from renewable energy sources. The stored hydrogen can be used to power a fuel cell to mitigate variations in renewable sources.
This paper analyzes the techno-economic factors related to the inclusion of integrated renewable systems with those of conventional generation. Firstly, it considers the initial investment capital and the costs associated with the operation, maintenance, and replacement of components that reach their life before completing the estimated life of the project. Secondly, the techno-economic assessment of PEM fuel cells for the case of Colombia as an alternative source of electricity generation for stationary applications is performed.
The main objective of the study is to compare different sources of power generation and assess their feasibility for off-grid areas of Colombia. Finally, a sensitivity analysis is performed considering the effect of inflation, discount rates, and the fuel price on the system selection.
2. Analysis of the hybrid system
A hybrid system is defined as one that integrates more than one source of electric power generation, conventional or non-conventional. The hybrid system utilised for this case study includes the following components: the demand, a Diesel generator (conventional source of power generation), a fuel cell, and its auxiliary elements. Additionally, alternative hybrid systems were defined to complement the integration of the fuel cells.
schematises a typical hybrid system comprising an AC bus and a DC bus. The AC bus connects the system with the network, the AC generators (e.g. Diesel generator and wind turbine), and the load (usually AC). On the other hand, the DC bus allows the connection of the fuel cell bank and auxiliary equipment (e.g. battery banks, electrolyzers, and solar panels).
Figure 4. Schematic of the hybrid system in HOMER.
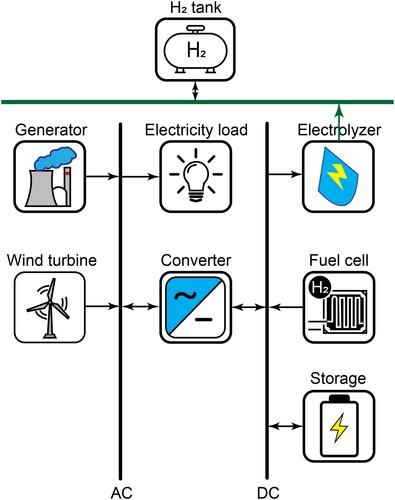
The feasibility of implementing a specific system’s configuration depends on many economic, technical, and environmental factors. For instance, the average wind speed of is a variable highly dependent on the location. The components of the hybrid system are described in detail in the following figure.
2.1. HOMER modelling tool
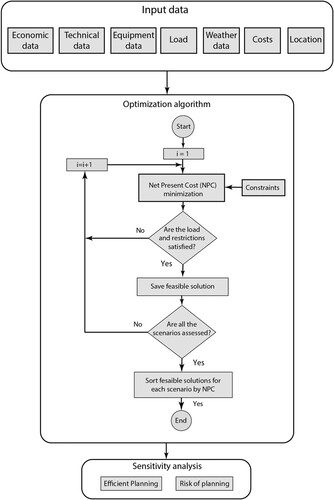
HOMER is a user-friendly energy-modelling tool developed by the National Renewable Energy Agency in the US (HOMER Energy LLC Citation2022). The tool can perform simulations and optimizations for power systems, including different generation technologies, such as wind turbines, solar photovoltaics, hydropower, bioenergy, fossil fuel generators, fuel cell, batteries, and hydrogen storage (Canales, Beluco, and Mendes Citation2017; Khare, Nema, and Baredar Citation2017). It can be used for stand-alone systems or those connected to a grid, and it can match both electrical and thermal loads, either for individual consumers or through district-heating systems (Bahramara, Moghaddam, and Haghifam Citation2016). The simulation time steps consider a one-year period with minimum resolutions of up to one minute. In this phase, the tool assesses and sorts the sized system and presents the most cost-effective solutions to the user. In addition, it performs sensitivity analysis, enabling the analyst to perform ‘what-if’ analyses and examine the impact of any uncertainties or variations on the input variables. The purpose of the optimisation phase is to assess the financial and technical viability of numerous technology options, considering fluctuations in technology costs and energy resource availability (Duman and Güler Citation2018). In this study, HOMER is used to run the simulations and optimisation of a Hybrid Renewable Energy System (HRES) for stand-alone applications (Afzal, Mohibullah, and Kumar Sharma Citation2010). The technologies included in the analysis consist of a Diesel generator, wind turbine, batteries, electrolyzer, fuel cells, and a hydrogen storage tank, as illustrated in .
Hybrid System optimisation usually includes the steps shown in . The process starts with the input data. This data definition starts with the project location. The project location will define renewable energy resources and economic indicators. In this study, inflation and discount rate were proposed as the main economic indicators. Another input is the load. This is a key input, and equipment size will depend on it. For this research, only the electric load is considered, although, in the general case, the HOMER capabilities allow the inclusion of heat and hydrogen loads. The equipment data required for the analysis are technical data (power, operational life, efficiency, etc.) and costs (capital, replacement, and operation). For each piece of equipment in this work, all the data is included. For the dispatch strategy, the Load Following (HOMER Citation2018) and Cycle Charging strategies were considered (HOMER Citation2022b). These strategies will define which equipment must be used at every moment, according to the logic defined by HOMER.
Figure 5. HOMER algorithm scheme.
2.2. Electricity demand
According to the UPME (Citation2019), the average electricity demand in a four inhabitants Colombian household is approximately 157 kWh each month. Therefore, the analysis was designed for a small rural town of 765 households with a total load demand of 4 MWh/day. The analyzed rural area is classified as a non-interconnected zone (NIZ), meaning it lacks access to a centralised power grid. In these areas, there is a pressing need for alternative sources of energy supply that can provide a continuous and reliable power source. This is especially important as the current reliance on fossil fuels, such as diesel, poses several challenges. Diesel-based systems not only have higher operating costs due to the expense of fuel, but they also contribute to higher emissions of greenhouse gases. By transitioning to sustainable energy sources, rural areas can reduce their dependence on fossil fuels, lower operating costs, and significantly decrease harmful greenhouse gas emissions (Atsonios et al. Citation2021).
An average power load for a community in a non-interconnected rural area was specified. This community load profile reflects the load peaks occurring mainly at the end of the afternoon when higher energy demand is expected as people are back in their homes using household appliances. shows the power load profile used for the analysis. Due to the geographic location of Colombia in the Equatorial zone, similar profiles could be expected during a year as there is no seasonality in the country. This profile can be also scaled up to include more inhabitants if the trend of the load profile remains the same.
Figure 6. Community load profile, including workdays and weekends.
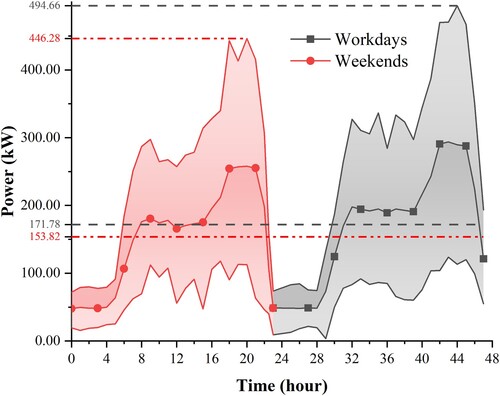
In a typical year, the average power demand on workdays is around 171.78 kW, reaching a peak of 494.66 kW. On weekends, the average power demand decreases to approximately 153.82 kW, with occasional peaks reaching up to 446.28 kW.
2.3. Diesel generator
Given the rural zones typical infrastructure, this study case assessed the possibility of integrating renewable energy sources with Diesel generators. The price of Diesel has been increasing recently, and this is due to the current energy crisis worldwide. Simulations included this equipment under different scenarios, depending on the availability of other energy sources. The unitary cost for Diesel-based power generation is $ 665/kW according to (Kumar, Pal, and Sharma Citation2021).
2.4. PEM fuel cell
Fuel cells are electrochemical devices that convert chemical energy into electricity, water, and heat, as a byproduct, when a fuel and an oxidant are supplied in the absence of a combustion process (Hoogers Citation2003). These devices are of great interest to the scientific community and emerge as a technological alternative to generate electricity from renewable resources with virtually zero emissions.
From a global level perspective, many countries have made strong efforts in fuel cell research and development. According to the IEA (Citation2017), countries like Germany, Denmark, Norway, and France, have initiatives focused on Fuel Cell Electric Vehicles (FCEVs), including hydrogen refueling stations (HRS). The German National Innovation Program (NIP), extended to 2026, funds the NOW (National Organisation Hydrogen and Fuel Cell Technology). Some of the programmes that contribute to significantly boosting this technology were the NASA Apollo, Gemini, and Space Shuttle programmes, and the research carried out by the US Department of Energy (DOE) (Fuel Cell Technologies Office Citationn.d.).
With headquarters in Canada, Denmark, and the United States, companies such as Ballard stand out worldwide with a build-up capacity of supplying fuel cells with commercial technology. DOE is currently funding projects oriented to improve the performance of fuel cells by developing novel ionomers for fuel cell membranes, like the work presented by Lindell et al. (Citation2018) from the 3 M company. In addition, the Argonne Laboratory has improved the fuel cell performance based on their research on novel catalysts (Wang et al. Citation2018), being the area with the highest funding schemes as reported by the DOE (Papageorgopoulos Citation2018) with around $ 14 M granted in 2018.
The following equation yield the hydrogen consumption (kg/h) of a fuel cell:
(2)
(2) where,
is the load power (kW),
is the cell stack voltage,
is the hydrogen molar mass,
is the Faraday’s constant, and a conversion factor to calculate the mass flow rate in kg/h.
The integration of a hybrid system considered several PEM fuel cells with an estimated capacity of 200–600 kW. This type of fuel cell can be obtained from industrial suppliers and has an equipment lifetime of 15,000–40,000 h (Ceylan and Devrim Citation2021; Pal and Mukherjee Citation2021; Rastayesh et al. Citation2019) and a price of $450/kW (Pal and Mukherjee Citation2021). In certain cases, equipment replacement is required to reach the useful life of the fuel cells, therefore, the membrane electrode assembly (MEA) must be replaced, representing about 80% of the cell cost (Ceylan and Devrim Citation2021; Pal and Mukherjee Citation2021). The replacement cost was specified at $ 400/kW (Pal and Mukherjee Citation2021) with an operation and maintenance cost (O&M) of $ 0.15/op-h (Pal and Mukherjee Citation2021), given the absence of moving parts and fuel supply to the electrolyzer system.
This study considered current technology costs. However, it is crucial to acknowledge that the future costs of fuel cells are expected to decrease rapidly. According to the IEA (Citation2019), future cost reductions will be impacted by technological innovations, including the development of more cost-effective materials, as well as the economies of scale achieved through improved manufacturing processes.
2.5. Battery bank
Batteries are needed to assist the system during abrupt load changes by allowing transitions between the generator, turbines, and fuel cells or even to support the power supply if other energy resources are insufficient to provide electricity for an unexpected peak load. The capacity of the system under analysis is very close to the maximum capacity estimated in the load profile. Therefore, the number of batteries required during the system optimisation was calculated. We selected Hitachi reference batteries LL1500-W, designed to be integrated into applications with wind energy (Hitachi Chemical Citation2018) as a basis for battery performance; the system could also be operated with lithium-ion batteries depending on their costs and durability. The investment cost for these batteries is $ 5,406 per battery (Tebibel Citation2021). This cost also corresponds to the battery replacement cost; once the battery reaches its useful life, it must be replaced entirely.
2.6. Hydrogen production and storage
The system can obtain hydrogen through electrolysis and store it in tanks or acquire it in high-purity, pressurised cylinders. The first option was selected to avoid using hydrogen obtained from processes that involve fossil fuels that increase the emissions of the process. It was assumed that hydrogen is produced using an industrial electrolyzer and stored at a pressure close to the operating pressure of the fuel cell. The amount of energy contained in the tank can be estimated from the following equation:
(3)
(3) where,
is the tank volume,
is the hydrogen density, and
is the lower heating value of the hydrogen.
Given the availability of renewable energy sources, as is the case of wind energy, hydrogen production from an electrolyzer is suggested. The cost of this equipment is around $1,060/kW. Its replacement is like that of the fuel cell; a value of approximately $825/kW was set. The cost of O&M was set at $10/yr and the efficiency at 85% (Pal and Mukherjee Citation2021).
The cost of hydrogen production is implicit in the operating cost of the system. The energy used by the electrolyzer for hydrogen production cannot be used to meet the load, and thus affects the sizing of the generators and indirectly the system LCOE.
Many electrolyzer cost reductions can be achieved through research and development efforts, particularly focusing on stacks. In order to reduce stack costs, it is necessary to conduct research that improves existing technologies and advances on emerging ones (Cammeraat, Dechezleprêtre, and Lalanne Citationn.d.). IRENA (Citation2020) identifies multiple aspects where stack costs can be decreased through enhancements in their design, aiming for improved efficiency, increased durability, or higher density. The specific technical challenges vary depending on the technology used, which are currently at different Technology Readiness levels (TRL). Over the past decade, there has been an increase in the installation of new electrolysis systems that produce hydrogen from water, with PEM technology gaining significant market share (Cammeraat, Dechezleprêtre, and Lalanne Citationn.d.). The average size of these added electrolyzers has grown in recent years, transitioning from small pilot projects (TRL 4) and demonstrations (TRL 5) to commercial-scale applications (TRL 8–9). According to the IEA (Citation2019), this shift towards larger installations should lead to economies of scale, resulting in reduced capital costs and the expansion of the electrolyzer industry supply chain. Experts estimate that increased funding for research and development can reduce capital costs by up to 24%, and simply scaling up production alone can have an impact of up to 30% (Schmidt et al. Citation2017).
2.7. Wind turbine
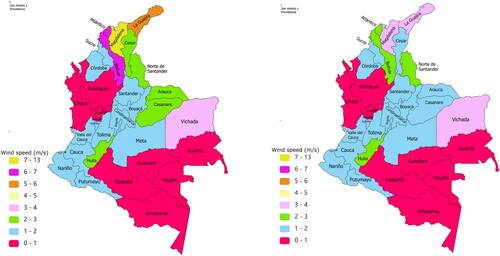
The electrical power that a turbine can generate is directly related to the wind speed available on the installation site. Therefore, the analyzed scenario considered that the turbines are installed in the northern area of Colombia, in the department of La Guajira. As shown in , only the north of La Guajira has sufficient potential for installing wind turbines. Although there are variations in the average wind speed during the year, according to the records found in the IDEAM (Instituto de Hidrología, Meteorología y Estudios Ambientales) (IDEAM Citation2015), the average wind speed is expected to oscillate between 4 and 8 m/s during the year, and peak speeds oscillate around 17 m/s, as shown in .
Figure 7. Average speed wind map from Colombia in February (left) and October (right) (m/s).
Although the location in the Guajira is an appropriate area for wind generation, the variability of the wind speed is an aspect that prevents generation exclusively from the wind.
The use of turbines with reference XANT M-24-ETR and a nominal power of 95 kW was considered with the power curve shown in . Considering the typical wind availability at the location (see ), this turbine is expected to generate about 250 MWh annually. For this turbine, this value is between 100 and 400 MWh/year (). These turbines are designed to operate in conditions of extreme temperatures, as is the case of La Guajira, whose average temperature throughout the year is close to 30 °C.
Figure 8. Wind speed (m/s) in the municipality of Uribia-Guajira.
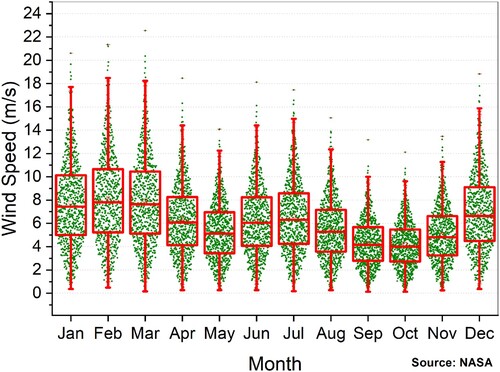
Figure 9. XANT M-24-ETR power curve.
Data adapted from (XANT Citation2017).
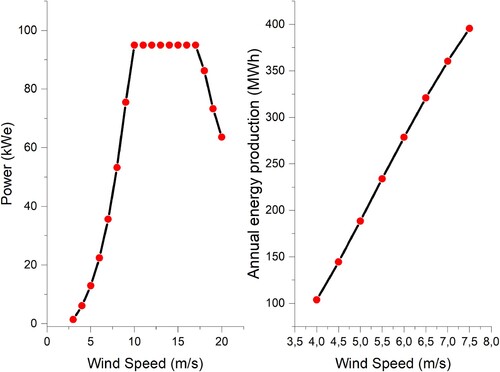
The turbines typically reach their maximum power with winds close to 10 m/s (see ), so on average, the turbines will be operating below their maximum power.
2.8. Converter/inverter system
Due to the technical characteristics of the equipment, it is necessary to include AC and DC converters to connect the buses that supply the power to the load and auxiliary equipment. The DC bus supports the fuel cell stack and the battery bank. The remaining components can be connected to the AC bus (see ). The typical cost of a converter/inverter system is on the order of $ 600/kW with replacement costs of $ 600/kW (Tebibel Citation2021).
3. Optimisation
Different combinations of equipment that can be used to satisfy the load demand were obtained. About 16 million configurations were evaluated during the sensitivity analysis, of which 11.74 million were feasible solutions, which means the solution system has all the required elements that allow it to operate correctly. These configurations correspond to all the possible system combinations based on the specifications of the equipment considered during this study. includes the equipment considered in the analysis. We discarded the unfeasible solutions, not including a converter (or excess converters) or an appropriate hydrogen supply. In addition, the absence of an electrolyzer or an appropriate source for power generation was a factor in discarding configurations. Note that a feasible solution is not necessarily an economically viable solution.
Table 1. Equipment considered in the analysis.
For the system optimisation, a time step of 15 min was set in the solver, as well as the focus factor, at 1.00, which means that local optimum points were avoided, although this significantly slows down the simulation time.
3.1. Economic factors
It is necessary to define the duration of the project and the discount and inflation rates required for calculations of net present value (NPV). For the Colombian scenario, the interest rate associated with the consumer price index (CPI) and a value of 13.44% was considered, which is the average of the last four years before COVID-19 and the average for the present year (2023); later in the optimisation stage, two scenarios will be considered for this value. The discount rate will generally reflect the current value of future payments; this rate is related to the interest rate through Equation 4.
(4)
(4) Once the interest rates have been defined, the system configuration can be optimised based on NPV minimisation. In the next section, a sensitivity analysis of this optimisation will be carried out since variations in interest rates can affect the most appropriate configuration from the economic point of view.
4. Sensitivity analysis
In the previous sections, the equipment considered within the hybrid system and its associated costs were mentioned. This information is consolidated in . It is necessary to contemplate different configurations to evaluate the optimal combination of equipment for the application, that is, the one that minimises the NPC of the system. It is also necessary to evaluate the impact that uncertainty in key factors could have on the decision. Such factors include economic indicators and variables associated with the technology (e.g. useful life) that could vary as components progress in technological maturity.
For the sensitivity analysis, the variables were included in the search space shown in . These variables were chosen, considering that they have the most considerable uncertainty and that they can have a significant impact on the viability of a particular configuration. The optimisation will then consist of 96 scenarios and each of these scenarios will be optimised until the lowest possible NPC is found (see ).
Table 2. Search space during optimisation.
Table 3. Result of cost minimisation for the scenario d = 12%, i = 13.44% and average wind speed 4 m/s.
Table 4. Result of cost minimisation for the scenario d = 12%, i = 13.44% and average wind speed 6.2 m/s.
Table 5. Result of cost minimisation for the scenario d = 12%, i = 13.44% and average wind speed 7.5 m/s.
After performing the optimisation for the different scenarios in the search space, it was found that the following architectures are technically and economically feasible. These architectures might not be considered in all scenarios. For ease, the combinations will be coded as shown in the following list:
Diesel generator + fuel cell + wind turbine +
tank + electrolyzer (DG/FC/WT/HT/E)
Diesel generator + fuel cell + wind turbine + batteries +
Given the observed trends in economic factors, the expected results for inflation of 13.44% and a discount rate of 12% will be shown in detail below. Under this condition, it is feasible to use hybrid systems; other scenario optimisation results can be found in . With these defined factors, the effect on the optimisation of (1) the useful life of the fuel cell stack, (2) the Diesel price, (3) the average annual wind speed, and (4) the wind reserve, so the scenarios are reduced for this specific analysis to 24 scenarios. The optimal settings for these 24 scenarios are summarised in .
Figure 10. Result of the cost minimisation for the scenario d = 12%, i = 13.44% (a, b, c), d = 17%, and i = 20.44% (d, e, f), with average wind speed 4 m/s (a, d), 6.2 m/s (b, e), and 7.5 m/s (c, f).
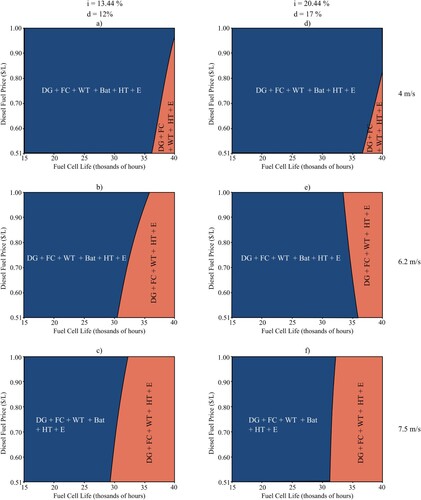
For each result, the required equipment and its capacity/quantity are indicated. As for performance measurements, the initial capital, the cost of energy (LCOE), and the hours of use of the fuel cell stack are reported. Impact of the average wind speed, life of the cell, and the Diesel price.
shows the main configurations resulting from the optimisation that minimises the NPC. The battery bank is mainly necessary when the Fuel Cells have a useful life of less than 30,000 h, regardless of the cost of the Diesel. This scenario is an achievable technical goal with the present technology. According to the US DOE, under stationary operation conditions, fuel cell systems operating lifetime is between 12,000 and 70,000 h (U.S. Department of Energy Citationn.d.). Regarding the life of the cell, even when the Diesel price goes down, it may be attractive to include cells in the system if they have sufficient durability.
The higher the average wind speed, the lower the tendency to use a battery bank. This is because the hydrogen storage from the excess energy produced by the wind turbines is sufficient to supply the load, even in the event of sudden reductions in wind speed.
These LCOE values obtained are congruent with results published by NREL in their database (NREL Citation2022). In addition, different studies with a similar system configuration have reported LCOE values in the range of 0.10–0.32 $/kWh (AL-bonsrulah et al. Citation2021; Babatunde, Munda, and Hamam Citation2022; Duman and Güler Citation2018; Nasser et al. Citation2022). It is expected to find a wide range of LCOE due to its high dependence on diverse factors such as location, economic conditions, availability of renewable resources, and proposed architecture.
illustrates that higher average wind speeds enable a larger number of systems with reduced storage requirements, primarily due to the increased availability of wind as a resource. Even on plateaus, the wind can supply a significant portion of the load, reducing reliance on stored energy in batteries. Additionally, the extended lifespan of fuel cells promotes the use of fewer batteries. This is because the replacement cost of fuel cells tends to be lower, making them a more cost-effective option when considering the project's useful life compared to batteries, which are used more frequently. These effects are influenced by discount and inflation rates. When inflation rates rise, the utilisation of battery storage devices increases unless fuel costs decrease, which is uncommon during periods of high inflation. However, the impact of inflation is diminished when a greater wind resource is available.
5. Performance of the chosen system
For the selected scenario, ,
,
,
,
(DG/FC/B/WT/E/HT), the optimal configuration is given by a hybrid generation system that integrates all the technologies considered ().
5.1. Cash flow
The cash flow and the electricity generation are now analyzed. Although the initial investment of this system ($ 2.64 M) is higher than a traditional base case of a Diesel generator without storage (∼$ 365,000), the LCOE will be lower in the hybrid system due to the Diesel consumption salvage. shows the details of the cost associated with each component, indicating the cost of the initial investment, replacement costs, operation, fuel, and, if applicable, the salvage at the end of the project. The salvage of the remaining value of a component at the end of the project assumes a linear depreciation. Although the Diesel generator is the one that requires a lower initial investment, the cost associated with the fuel exceeds even the initial investment of the wind turbines. In the wind turbines scenario, we found in the optimisation that seven units are required, for a cost of $ 1.03 M, requiring a replacement in year 20 of the project due to the useful life of the equipment as shown in . The fuel cells present the second highest initial investment, only surpassed by the wind turbines. Given the fuel cell’s useful life, a replacement is predicted around years 8, 15, 23 and 30, and the salvage is $111,731. If a fuel cell with a life of 40,000 h could be used, it would need to be replaced three times (not four) over the life of the project, increasing the salvage to $159,733. The diesel generator, which has the same service life as the fuel cell, due to the high penetration level of renewable energy, is not expected to require replacement for the duration of the project. However, the cost of fuel is still a more determinant factor in the NPC of the system. The batteries should be replaced approximately every 20 years. In addition, there is a salvage like the initial capital invested at the end of the project. This scenario indicates that the batteries still have most of their useful life available.
Figure 11. Cash flow for the selected scenario and configuration.
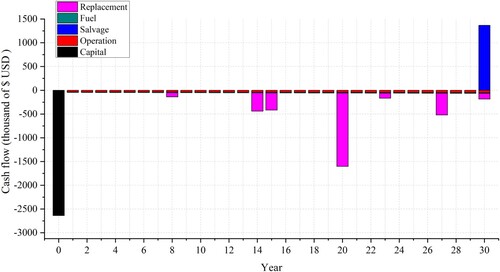
Table 6. Summary of the costs associated with the recommended system (values in thousands of dollars).
5.2. Power source control
Hybrid systems use a series of rules to meet the load demand through generators and storage sources (i.e. the batteries and the electrolyzer with a hydrogen tank) when there are insufficient renewable energy sources. For the analysis of the operating cycles, two dispatch strategies were considered.
5.2.1. Homer cycle charging
In this control strategy, according to HOMER Energy (HOMER Citation2022b), the generators will run at full power, even when more than one generator is available on the same bus; the excess energy will be used to charge the batteries. For the selected sensitivity case the best result with this control strategy has an NPC $USD 11 M, ranking ninth among the optimised systems.
5.2.2. Homer load following
In this control strategy, according to HOMER Energy (HOMER Citation2018), the generators will produce only enough power to satisfy the load. For this reason, an abundant resource of renewable energies is required to provide more power than the load demands, to charge the batteries and other equipment such as the electrolyzer, and thus, indirectly, the fuel cell. The eight best architectures (using the NPC as a reference) of systems simulated in the selected sensitivity case used this control strategy. To decide which generators should be used at any time, the control algorithm minimised the total cost must (cost of fuel, O&M, and replacement), which is done by calculating fixed and marginal costs for each source.
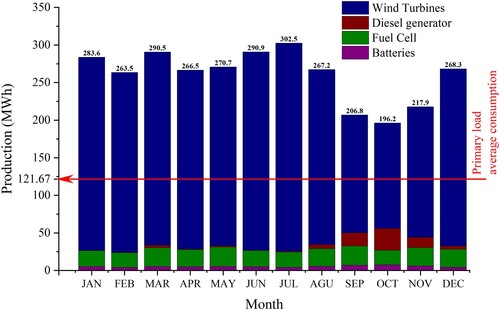
shows the average values for a typical year. Whenever there is sufficient wind availability, the wind turbine is usually the preferred energy source to meet all energy demands, thus reducing the costs associated with diesel. However, when the months of lower wind speed arrive, especially in October, it is observed that the diesel generator produces 15% of the electrical energy when the average value for the year is 3%. The reduction in the power supplied by the turbine lowers the level of the hydrogen tank, thus reducing the availability of the fuel cell.
Figure 12. Average monthly performance during one year of operation of the selected system.
5.3. System dynamic performance
Two months with the greatest possible difference in wind resource availability were chosen for the analysis. Based on the historical data shown in , the month with the greatest wind resource is February and the one with the least is October. In this way, the adjustments made by the control system can be better appreciated, and how the generators and auxiliary storage equipment are prioritised. Additionally, 48 h on workdays and 48 h on weekends are analyzed to analyze the impact of the change in the load profile (see ).
Although it may appear that there is a large amount of excess energy produced, this is an average measurement during each of the months (). By analyzing the dynamic behaviour of the system, this is due to the variability of the wind resource. This variability is accentuated by the wind reserve factor, which according to the definition specified by HOMER Energy (HOMER Citation2022a), implies that the wind resource can be suddenly reduced by a specified %. For the analysis, two levels were considered, 20% and 50% (), however, to be conservative in the design we present the analysis with a 50% reserve.
In February (see ), the availability of wind resources allows the turbines to operate near their maximum output for a substantial percentage of the time. As a result, there is excess electrical energy that can be used to charge the batteries and maintain a charge above 60% during the observation window. During the same period, power can be supplied to the electrolyzer to generate hydrogen and store it in a tank, which achieves 100% tank capacity in approximately 12 h of operation. At around hour 30, due to the natural variability of the wind, the turbines are switched off. At that moment, taking advantage of the hydrogen reserve, the fuel cell comes into operation supplying the energy required by the load. Once the turbines start operating again at about hour 36, the hydrogen in the tank is restored to 100% and is waiting to be required again due to the variability of the wind resource. The same trend will be repeated in the following hours if there is the possibility of using the wind turbine. Turbines will be the preferred source due to their lower operating cost. Without this source, the other sources that serve as an alternative to the diesel generator cannot operate.
Figure 13. Performance hour-by-hour of the selected system during February and October.
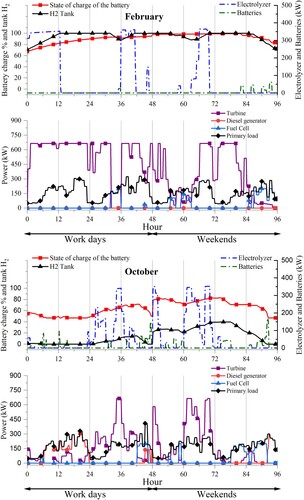
In October (see ), the average wind speed is reduced, and the wind turbines cannot supply the main load. In addition, hydrogen reserves drop to 0% for much of the workday, recovering somewhat on weekends, reaching a maximum near 40%. For this reason, the system cannot use the fuel cell for very long. Under these conditions, the diesel generator must supply the energy. On the other hand, the absence of wind power also makes it difficult to produce hydrogen for the batteries, so the tank rarely exceeds 30% charge. Under these conditions, wind power will be used preferentially to charge the batteries that support the diesel generator much more frequently than in February. This is the month that will then make the most use of diesel fuel, driving up operating costs.
Considering that the system is in the most demanding condition, and that even so, always it was possible to fully meet the demand for electricity, it is expected that throughout the year there will be a stable supply of energy for the population considered in the analysis.
6. Conclusions
The use of hybrid electric power generation systems that combine traditional sources with renewable sources and energy storage systems with hydrogen and electrochemical storage (batteries) was analyzed. A case study was performed focused on implementing such a hybrid system in a rural area called La Guajira in Colombia. Optimisation of the system was carried out in the HOMER software under different scenarios that contemplated economic, technical, and environmental variables. This approach allowed us to define a system that integrates a Diesel generator with wind turbines, fuel cells, and batteries. Furthermore, the costs of the incidental investment and the net present cost of the system in a project planned for 30 years were assessed. The main results allow concluding the following:
The integration of wind energy, fuel cells, and Diesel generators are technically and economically feasible under the current conditions of La Guajira region of Colombia, allowing the hybrid system to meet the demand of the load considered without the support interconnected system of the country.
The use of batteries is required for systems where the Fuel Cell lifespan is closer to 15,000 h, and high Diesel prices.
Increasing the Fuel Cell lifespan can reduce the system COP by up to 9% in the analyzed location.
For locations where less wind variability is expected (lower Wind Reserve Factor) a smaller battery bank can be used.
Diesel consumption for the hybrid system is 87% smaller than the base case, thus reducing the operating costs.
| Nomenclature | ||
| d | = | Discount rate |
| E | = | Energy |
| F | = | Faraday constant |
| FC | = | Fuel cell |
| i | = | Interest rate |
| HOMER | = | Hybrid Optimization Model for Multiple Energy Resources |
| LF | = | Load Factor |
| LCOE | = | Levelized Cost of Electricity |
| LHV | = | Low heating value |
| = | Mass flow rate, kg/h | |
| M | = | Molar mass, kg/mol |
| max | = | Maximum |
| NPC | = | Net present cost |
| P | = | Power, kW |
| tk | = | Tank |
| V | = | Voltage, V or Volume, m3 |
| = | Density | |
Acknowledgments
The authors want to thank COLCIENCIAS (now Minciencias) and Fondo Nacional de Financiamiento para la Ciencia, la Tecnología y la Innovación Francisco José de Caldas for their support in the project identified with the code 1215-669-46500, and Universidad del Norte for the Doctoral Program Scholarship.
Disclosure statement
No potential conflict of interest was reported by the author(s).
Additional information
Funding
References
- Afzal, A., M. Mohibullah, and V. Kumar Sharma. 2010. “Optimal Hybrid Renewable Energy Systems for Energy Security: A Comparative Study.” International Journal of Sustainable Energy 29 (1): 48–58. https://doi.org/10.1080/14786460903337241.
- Aguilar-Arias, J., and D. Hotza. 2013. “Configuraciones alternativas para celdas de combustible de óxido sólido.” Revista Latinoamericana de Metalurgia y Materiales 33:172–185.
- AL-bonsrulah, H. A. Z., M. J. Alshukri, L. M. Mikhaeel, N. N. AL-sawaf, K. Nesrine, M. V. Reddy, and K. Zaghib. 2021. “Design and Simulation Studies of Hybrid Power Systems Based on Photovoltaic, Wind, Electrolyzer, and PEM Fuel Cells.” Energies 14:2643. https://doi.org/10.3390/en14092643.
- Amutha, W. M., and V. Rajini. 2015. “Techno-economic Evaluation of Various Hybrid Power Systems for Rural Telecom.” Renewable and Sustainable Energy Reviews 43: 553–561. https://doi.org/10.1016/j.rser.2014.10.103.
- Atsonios, K., C. Samlis, K. Manou, A. Nikolopoulos, K. Sfetsioris, A. Mitsotakis, and P. Grammelis. 2021. “Technical Assessment of LNG Based Polygeneration Systems for Non-interconnected Island Cases Using SOFC.” International Journal of Hydrogen Energy 46 (6): 4827–4843. https://doi.org/10.1016/j.ijhydene.2020.03.072.
- Babatunde, O. M., J. L. Munda, and Y. Hamam. 2022. “Off-grid Hybrid Photovoltaic – Micro Wind Turbine Renewable Energy System with Hydrogen and Battery Storage: Effects of Sun Tracking Technologies.” Energy Conversion and Management 255:115335. https://doi.org/10.1016/j.enconman.2022.115335.
- Bahramara, S., M. P. Moghaddam, and M. R. Haghifam. 2016. “Optimal Planning of Hybrid Renewable Energy Systems Using HOMER: A Review.” Renewable and Sustainable Energy Reviews 62: 609–620. https://doi.org/10.1016/j.rser.2016.05.039.
- Baniasad Askari, I., L. Baniasad Askari, M. M. Kaykhah, and H. Baniasad Askari. 2014. “Optimisation and Techno-economic Feasibility Analysis of Hybrid (Photovoltaic/Wind/Fuel Cell) Energy Systems in Kerman, Iran; Considering the Effects of Electrical Load and Energy Storage Technology.” International Journal of Sustainable Energy 33 (3): 635–649. https://doi.org/10.1080/14786451.2013.769991.
- Barik, A. K., S. Jaiswal, and D. C. Das. 2022. “Recent Trends and Development in Hybrid Microgrid: A Review on Energy Resource Planning and Control.” International Journal of Sustainable Energy 41 (4): 308–322. https://doi.org/10.1080/14786451.2021.1910698.
- Bezmalinović, D., F. Barbir, and I. Tolj. 2013. “Techno-economic Analysis of PEM Fuel Cells Role in Photovoltaic-based Systems for the Remote Base Stations.” International Journal of Hydrogen Energy 38 (1): 417–425. https://doi.org/10.1016/j.ijhydene.2012.09.123.
- Cammeraat, E., A. Dechezleprêtre, and G. Lalanne. n.d. “Innovation and Industrial Policies for Green Hydrogen.” OECD Science, Technology and Industry Policy Papers 125. https://doi.org/10.1787/f0bb5d8c-en.
- Canales, F. A., A. Beluco, and C. A. B. Mendes. 2017. “Modelling a Hydropower Plant with Reservoir with the Micropower Optimisation Model (HOMER).” International Journal of Sustainable Energy 36 (7): 654–667. https://doi.org/10.1080/14786451.2015.1080706.
- Carvajal-Osorio, H., J. H. Babativa, and J. A. Alonso. 2010. “Estudio sobre producción de H2 con hidroelectricidad para una economía de hidrógeno en Colombia.” Ingeniería y Competitividad 12: 31–42. https://doi.org/10.25100/iyc.v12i1.2700
- Ceylan, C., and Y. Devrim. 2021. “Design and Simulation of the PV/PEM Fuel Cell Based Hybrid Energy System Using MATLAB/Simulink for Greenhouse Application.” International Journal of Hydrogen Energy 46 (42): 22092–22106. https://doi.org/10.1016/j.ijhydene.2021.04.034.
- Duman, A. C., and Ö Güler. 2018. “Techno-economic Analysis of Off-grid PV/Wind/Fuel Cell Hybrid System Combinations with a Comparison of Regularly and Seasonally Occupied Households.” Sustainable Cities and Society 42: 107–126. https://doi.org/10.1016/j.scs.2018.06.029.
- European Commission. 2010. EUROPE 2020 A European Strategy for Smart, Sustainable and Inclusive Growth.
- Fakour, A., A. Behbahani-Nia, and F. Torabi. 2018. “Economic Feasibility of Solid Oxide Fuel Cell (SOFC) for Power Generation in Iran.” Energy Sources, Part B: Economics, Planning and Policy 13 (3): 149–157. https://doi.org/10.1080/15567249.2017.1316796.
- Fuel Cell Technologies Office. n.d. About the Fuel Cell Technologies Office. Department of Energy. Accessed September 30, 2019. https://www.energy.gov/eere/fuelcells/fuel-cell-technologies-office.
- Hitachi Chemical. 2018. Stationary VRLA Batteries for Power Storage (LL-W). Accessed October 2, 2018. http://www.hitachi-chem.co.jp/english/products/sds/ibattery/001.html.
- HOMER. 2018. HOMER Load Following Strategy. Accessed October 23, 2022. https://www.homerenergy.com/products/pro/docs/3.11/load_following_strategy.html.
- HOMER. 2022a. HOMER Constraints. Accessed January 30, 2023. https://www.homerenergy.com/products/pro/docs/3.14/_constraints.html.
- HOMER. 2022b. HOMER Cycle Charging. Accessed January 30, 2023. https://www.homerenergy.com/products/pro/docs/3.10/cycle_charging.html.
- HOMER Energy LLC. 2022. Accessed February 8, 2022. HOMER. http://www.homerenergy.com/.
- Hoogers, G. 2003. “Fuel Cell Technology Handbook.”
- IDEAM. 2015. Atlas Interactivo – Vientos. Accessed October 7, 2018. http://atlas.ideam.gov.co/visorAtlasVientos.html.
- IEA (International Energy Agency). 2017. Global Trends and Outlook for Hydrogen. IEA Hydrogen.
- IEA (International Energy Agency). 2018. Key World Energy Statistics. France: IEA Publications.
- IEA (International Energy Agency). 2019. The Future of Hydrogen. Paris: IEA. Accessed April 29, 2023. https://www.iea.org/reports/the-future-of-hydrogen.
- IEA (International Energy Agency). 2021. Key World Energy Statistics 2021. 1–82. France: IEA Publications.
- IEA (International Energy Agency). n.d. Energy Statistics Data Browser – Data Tools, 2022. Accessed December 27, 2022. https://www.iea.org/data-and-statistics/data-tools/energy-statistics-data-browser.
- IRENA (International Renewable Energy Agency). 2020. Green Hydrogen Cost Reduction: Scaling up Electrolysers to Meet the 1.50C Climate Goal. Abu Dhabi: IRENA. Accessed May 29, 2023. https://www.irena.org/publications/2020/Dec/Green-hydrogen-cost-reduction.
- Khare, V., S. Nema, and P. Baredar. 2017. “Optimisation of the Hybrid Renewable Energy System by HOMER, PSO and CPSO for the Study Area.” International Journal of Sustainable Energy 36 (4): 326–343. https://doi.org/10.1080/14786451.2015.1017500.
- Kumar, P., N. Pal, and H. Sharma. 2021. “Techno-economic Analysis of Solar Photo-voltaic/Diesel Generator Hybrid System Using Different Energy Storage Technologies for Isolated Islands of India.” Journal of Energy Storage 41. https://doi.org/10.1016/j.est.2021.102965.
- Lindell, M., J. Abulu, M. Yandrasits, G. Thoma, A. Steinbach, M. Kurkowski, G. Weatherman, et al. 2018. “Annual Progress Report 1 DOE Hydrogen and Fuel Cells Program Novel Ionomers and Electrode Structures for Improved Polymer Electrolyte Membrane Fuel Cell Electrode Performance at Low Platinum-Group-Metal Loadings Overall Objectives.” Accessed September 30, 2019. https://energy.gov/eere/fuelcells/downloads/fuel-cell-technologies-office-multi-year-research-development-and-22.
- Mining and Energy Planning Unit (UPME). 2019. Primer balance de Energía Útil para Colombia y Cuantificación de las Perdidas energéticas relacionadas y la brecha de eficiencia energética. Bogotá. Accessed February 8, 2023. https://www1.upme.gov.co/DemandayEficiencia.
- Mining and Energy Planning Unit (UPME). 2023. Installed Capacity by Source. Accessed January 23, 2023. http://paratec.xm.com.co/paratec/SitePages/generacion.aspx?q=capacidad.
- Montoya García, M., and H. Reyes Pineda. 2013. “Optimización de una celda combustible de hidrógeno.” Optimization of a Hydrogen Fuel Cell 18:200–205. http://search.ebscohost.com/login.aspx?direct=true&db=a9h&AN=89861724&lang=es&site=ehost-live.
- Napoli, R., M. Gandiglio, A. Lanzini, and M. Santarelli. 2015. “Techno-economic Analysis of PEMFC and SOFC Micro-CHP Fuel Cell Systems for the Residential Sector.” Energy and Buildings 103:131–146. https://doi.org/10.1016/j.enbuild.2015.06.052.
- Nasser, M., T. F. Megahed, S. Ookawara, and H. Hassan. 2022. “Performance Evaluation of PV Panels/Wind Turbines Hybrid System for Green Hydrogen Generation and Storage: Energy, Exergy, Economic, and Enviroeconomic.” Energy Conversion and Management 267:115870. https://doi.org/10.1016/j.enconman.2022.115870.
- NREL (National Renewable Energy Lab). 2022. Annual Technology Baseline. Accessed December 27, 2022. https://atb.nrel.gov/electricity/2022/data.
- Onwe, C. A., D. Rodley, and S. Reynolds. 2020. “Modelling and Simulation Tool for Off-grid PV-hydrogen Energy System.” International Journal of Sustainable Energy 39 (1): 1–20. https://doi.org/10.1080/14786451.2019.1617711.
- Pal, P., and V. Mukherjee. 2021. “Off-grid Solar Photovoltaic/Hydrogen Fuel Cell System for Renewable Energy Generation: An Investigation Based on Techno-economic Feasibility Assessment for the Application of End-user Load Demand in North-East India.” Renewable and Sustainable Energy Reviews 149:111421. https://doi.org/10.1016/j.rser.2021.111421.
- Papageorgopoulos, D. 2018. “U. Department of Energy, Fuel Cell R&D Subprogram Overview; DOE Hydrogen and Fuel Cells Program FY 2018 Annual Progress Report.” Accessed September 30, 2019. https://www.hydrogen.energy.gov/program_records.html.
- Pujari, H. K., and M. Rudramoorthy. 2022. “Optimal Design, Prefeasibility Techno-economic and Sensitivity Analysis of Off-grid Hybrid Renewable Energy System.” International Journal of Sustainable Energy 41 (10): 1466–1498. https://doi.org/10.1080/14786451.2022.2058502.
- Rastayesh, S., S. Bahrebar, A. S. Bahman, J. D. Sørensen, and F. Blaabjerg. 2019. “Lifetime Estimation and Failure Risk Analysis in a Power Stage Used in Wind-fuel Cell Hybrid Energy Systems.” Electronics 8:1412. https://doi.org/10.3390/electronics8121412.
- Samy, M. M., S. Barakat, and H. S. Ramadan. 2020. “Techno-economic Analysis for Rustic Electrification in Egypt Using Multi-source Renewable Energy Based on PV/Wind/FC.” International Journal of Hydrogen Energy 45 (20): 11471–11483. https://doi.org/10.1016/j.ijhydene.2019.04.038.
- Schmidt, O., A. Gambhir, I. Staffell, A. Hawkes, J. Nelson, and S. Few. 2017. “Future Cost and Performance of Water Electrolysis: An Expert Elicitation Study.” International Journal of Hydrogen Energy 42 (52): 30470–30492. https://doi.org/10.1016/j.ijhydene.2017.10.045.
- Silva, S. B., M. M. Severino, and M. A. G. De Oliveira. 2013. “Technical Note A Stand-alone Hybrid Photovoltaic, Fuel Cell and Battery System: A Case Study of Tocantins, Brazil.” Renewable Energy 57: 384–389. https://doi.org/10.1016/j.renene.2013.02.004.
- Singh, A., P. Baredar, and B. Gupta. 2017. “Techno-economic Feasibility Analysis of Hydrogen Fuel Cell and Solar Photovoltaic Hybrid Renewable Energy System for Academic Research Building.” Energy Conversion and Management 145: 398–414. https://doi.org/10.1016/j.enconman.2017.05.014.
- Tebibel, H. 2021. “Methodology for Multi-objective Optimization of Wind Turbine/Battery/Electrolyzer System for Decentralized Clean Hydrogen Production Using an Adapted Power Management Strategy for Low Wind Speed Conditions.” Energy Conversion and Management 238:114125. https://doi.org/10.1016/j.enconman.2021.114125.
- Universidad Nacional de Colombia. 2013. Optimizan celdas de combustible con tecnología colombiana. http://www.elespectador.com/noticias/actualidad/optimizan-celdas-de-combustible-tecnologia-colombiana-articulo-466170.
- U.S. Department of Energy. (n.d.). DOE Technical Targets for Fuel Cell Systems for Stationary (Combined Heat and Power) Applications. Department of Energy. Accessed July 25, 2019. https://www.energy.gov/eere/fuelcells/doe-technical-targets-fuel-cell-systems-stationary-combined-heat-and-power.
- Wang, X., J.-K. Peng, D. Manager, and N. L. Garland, 2018. “Performance of Advanced Automotive Fuel Cell Stacks and Systems with State-of-the-Art d-PtCo/C Cathode Catalyst in Membrane Electrode Assemblies; DOE Hydrogen and Fuel Cells Program FY 2018 Annual Progress Report.” Accessed September 30, 2019. https://www.energy.gov/eere/fuelcells/downloads/fuel-cell-technologies-office-multi-year-research-development-and-22.
- XANT. 2017. “XANT M-24 General Specifications.”
