
 ?Mathematical formulae have been encoded as MathML and are displayed in this HTML version using MathJax in order to improve their display. Uncheck the box to turn MathJax off. This feature requires Javascript. Click on a formula to zoom.
ABSTRACT
Advances in energy storage technology have allowed the application of load shifting in the utility grid for a more efficient power system operation. However, the economy of the Battery Energy Storage System (BESS) application is not linear to the cost reduction obtained from excluding the costly generators. This paper presents the economic analysis of cost-based load shifting implementation and an approach to determine the generation units to be deactivated and replaced by BESS on three large-scale power grids in Indonesia: Sumbagut, Sumbagteng, and Sumbagsel systems. The economic feasibility is evaluated using the Net Present Value (NPV), considering the savings and the BESS investment cost. The result shows that the proposed approach is more robust than the conventional methods, such as removing the most expensive units, units with the highest cost reduction, units with the best economic return contribution, or the maximum number of units that can be replaced.
Nomenclature
| BESS | = | Battery Energy Storage System |
| CF | = | Capacity Factor |
| CoE | = | Cost of Energy |
| DoD | = | Depth of Discharge |
| EMS | = | Energy Management System |
| IPP | = | Independent Power Producer |
| NPV | = | Net Present Value |
| SoC | = | State of Charge |
| TOP | = | Take or Pay |
1. Introduction
An electric power system generally has a daily load profile in which the generation cost might be varied at any time throughout the day depending on the amount of load on the system at that time (Sani et al. Citation2021), (Reyseliani and Purwanto Citation2021). The generation cost is higher when the load is high since the utility operator must operate and dispatch the additional generation unit with a higher generation cost, and vice versa. The total generation cost of a power system is calculated by summing up the multiplication between the individual generation cost and the energy production of each generation unit. So, the total generation cost of a power system is affected by the most expensive generation unit operating in that power system. The expensive generation units include diesel-powered, gas engines, gas turbines, and combined cycle power plants. Hence, the total generation cost is expected to be reduced by minimizing the operation of these types of power plants.
One of many ways to minimize the operation of costly generation units is through load shifting (Dong et al. Citation2011; Jankowiak et al. Citation2020; Lobato, Sigrist, and Rouco Citation2013; Martins et al. Citation2018; Oudalov, Cherkaoui, and Beguin Citation2007; Rana, Atef et al. Citation2022; Uddin et al. Citation2018). Load shifting is the process of transferring the electrical load from the peak period to the off-peak period (Even, Neyens, and Demouselle Citation1993), which aims to minimize the operation of costly generation units and optimize the energy production of the low-cost generation units. Its implementation seeks financial benefits from reducing generation costs (Rana, Atef et al. Citation2022). On the other hand, Battery Energy Storage System (BESS) has been known to have many benefits for power system applications (Abdullah et al. Citation2021; Davies et al. Citation2019; Hosseini et al. Citation2022; Hu, Armada, and Sánchez Citation2022; Jufri et al. Citation2021; Rana, Uddin et al. Citation2022), and it has become massively utilized due to the maturity of their technologies and the price fall (Dejvises Citation2016; Ioakimidis et al. Citation2018; Lange et al. Citation2020; Lee et al. Citation2021; Mair et al. Citation2021; Park et al. Citation2015; Shi et al. Citation2018; Tchagang and Yoo Citation2020; Wang et al. Citation2019; Zheng, Meinrenken, and Lackner Citation2015). illustrates the application of BESS for load shifting. Hence, BESS is charged during the off-peak period when the cost is low and is discharged during the peak period when the cost is high (Telaretti and Dusonchet Citation2016).
Figure 1. Illustration of Load shifting with BESS.
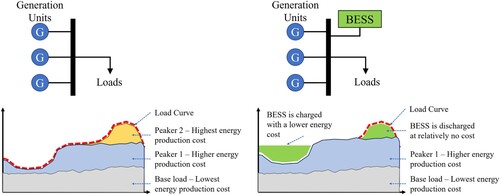
Load shifting terminology is sometimes used interchangeably with peak shaving, which is a process of flattening the load curve by reducing the power from the generation units during the peak load period (Oudalov, Cherkaoui, and Beguin Citation2007). Peak Shaving generally uses the principle of demand balance, where the total power generation and BESS’s discharging capacity equals the total load plus the charging energy required by BESS. One example of peak shaving implementation is in the Canary Islands, Spain (Lobato, Sigrist, and Rouco Citation2013), where an energy storage system was used in isolated power systems. It applied an optimization model of the weekly economic operation of the system that can minimize the operation of the thermal power plants. The deactivation of the thermal power plant was easily decided because the grid size is relatively smaller.
Another example is in Northern Ireland, where BESS was operated behind the metre for peak shaving (Jankowiak et al. Citation2020). It utilized strategies based on the battery State-of-Charge (SoC) and evaluated the battery size. The peak shaving benefit was analyzed using Net Present Value (NPV) on two tariff schemes. The result showed that implementing behind-the-metre peak shaving has been profitable for the customers. Likewise, Martins et al. (Citation2018) applied BESS for peak shaving on the demand side, such as for industrial applications. The BESS sizing was performed using linear programming based on demand and billing scheme. The research revealed that the BESS capacity is directly related to the demand profile of the industries, and BESS was able to shave up to 6% of the peak load.
De Salis et al. (Citation2014) studied the implementation of load shifting using energy storage and its associated controls for a single building. It applied demand forecast algorithms to determine the maximum limit of daily peak demand so the battery could operate. The result showed that the monthly bill was reduced significantly. Meanwhile, BESS was used in Brazil to reduce the peak load of commercial customers to replace conventional power plants such as diesel generator sets (Zimmermann and Sauer Citation2020). The result showed that, based on the cost information in 2018, the peak shaving application has not been economically feasible even though the shutting off of the units could be obviously determined since the peak and costly generation units were already specified. Similarly, Claeys et al. (Citation2021) proposed a BESS sizing method by analyzing the load-duration curve to determine the peak shaving threshold and revealed that the BESS application used for peak shaving purpose only is not economically viable.
Most related research discussed the sizing and application of BESS for load shifting or peak shaving on the demand side. In comparison, the study on BESS application for load shifting on large-scale power systems is still limited. A study of load shifting implementation on the utility side was based on cost optimization to exclude the power generation units that supply the peak demand (Lo and Anderson Citation1999). Their research utilized the load curve decomposition to find the optimized period for load shifting to save computation and time. The applied method showed a reasonable discrepancy with the conventional methods. However, the research did not explore the selection of the generation units that must be deactivated for load shifting. A combined objective of cost and charge–discharge cycle reduction was used to determine the battery size by Kucevic et al. (Citation2020). Its results showed that the proposed strategy reduced the cost by almost 10% with an increase of battery stress due to frequent use by only less than 1%.
Generally, the simplest way to determine which generation units shall be replaced by BESS in load shifting implementation is by looking at their energy generation cost. Hence, BESS can easily take over the most expensive generation units. However, due to the complexity of the large systems, technically and economically, this way is not always guaranteed to yield the most economical result of load shifting. Some constraints must be considered in the implementation of load shifting, such as generation net power capability, generation profile, capacity factor, and generation cost, as well as the cost that must still be borne by the utility for deactivating the associated generation units. Therefore, it is necessary to observe the economy of using BESS for load shifting so that the assurance of the generation unit replacement can be concluded.
The previous papers mainly discussed load shifting to optimize the use of solar energy to avoid curtailment and use electricity at night in the microgrid system (Barchi, Pierro, and Moser Citation2019; Chapaloglou et al. Citation2019; Manojkumar et al. Citation2022; Rana et al. Citation2021; Setiawan et al. Citation2021). Several papers discuss peak shaving from the consumer's point of view, such as building to optimize usage based on dynamic tariffs and through Energy Management System (EMS) applications (Chen et al. Citation2021; De Salis et al. Citation2014; Liu, Silwal, and Kleissla Citation2022; Paul et al. Citation2019; Zhuang and Liang Citation2019). Moreover, the previous studies on load shifting implementation discussed its application in small-scale systems or microgrids. Such systems generally have fewer generation units, so the problem of determining the generation units to be shut down by BESS rarely arises. The grid operator can simply decide which generation units to be replaced by BESS for load shifting. However, in a more extensive system with various types, sizes, and generation costs, a simple method to take out the generation units may result in less efficient and economical results. Therefore, it is necessary to study and evaluate the load shifting implementation method on a large-scale utility system.
This paper studies an economic analysis of the utilization of BESS for load shifting for large-scale power systems. It evaluates the possibility of implementing load shifting BESS in three power grids in Indonesia, namely the Sumbagut, Sumbagteng, and Sumbagsel systems. The total connected generations are 3153 MW within 93 units, 1845 MW (73 units), and 3241 MW (93 units), respectively. The daily average demand is 39,513 MWh in the Sumbagut system, 21,032 MWh in the Sumbagteng system, and 42,640 MWh in the Sumbagsel system. Furthermore, each system has its unique load profile pattern, which can be described by its load factor. Sumbagut system has an 83% load factor, while Sumbagteng and Sumbagsel have 73% and 81%, respectively.
This paper determines the generation units that shall be replaced by applying the mathematical combination from the list of generation units that can be replaced. Then, different combinations are assessed and compared. It also considers system reliability constraints, such as the fuel type and applied business scheme. The generation units that appear in the combination providing the highest economic return are acknowledged as the units to be replaced in the load shifting implementation. By doing the load shifting planning in this way, the utility operator can decide which generator units shall be replaced by BESS that gives the highest benefits. Furthermore, this method clarifies that the load shifting implementation cannot be done by only taking over the most expensive generators but also by considering other factors related to the whole system. The research's novelty lies in deciding which generators must be deactivated and replaced with BESS in large power system grids. The objective utilized in the research is based on the highest economic return. The proposed method is compared with some conventional methods to validate its superiority.
The remainder of the paper is structured as follows: Section 2 describes the load shifting procedure along with the economic calculations, Section 3 provides the large-scale power system characteristics and data used as study cases, and Section 4 presents and discusses the load shifting application simulation results. Lastly, the research is concluded in Section 5.
2. Load shifting procedure and economic calculation
The methodology of load shifting and the economic calculation applied in this paper are presented in . First, the power generation data is collected and screened to filter out the anomaly. It includes the fuel type, the generation profile, the capacity factor (CF), the net power capacity, the generation cost, and the business scheme, whether it is a Take-or-Pay (TOP) scheme or non-TOP. After that, the data is sorted out ascendingly based on its generation cost. The load shifting is then applied based on the combination of the high-cost generation units.
Figure 2. Determination of economic-optimized load shifting.
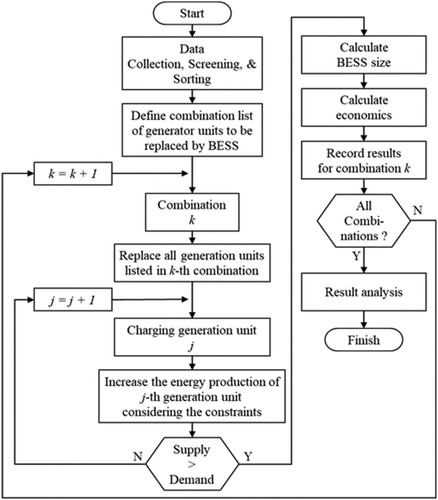
The combination list is the mathematical selection of the units from a set with distinct members. It is defined by the number of units selected from a set of generation units that can be replaced. The set of generation units that can be replaced depends on the number of non-TOP generation units fuelled by diesel or gas. Hence, the maximum number of generation units that can be replaced simultaneously is determined by the total remaining net power capacity plus the reserve margin. In addition, it also depends on the economic calculation result that returns the feasible outcome. After developing the combination list, the generation units appearing in each combination list are replaced.
Secondly, the lack of power supply in the system is covered by the cheap generation units, which can be acquired by increasing their energy production up to their limit until the supply satisfies the demand (Supply > Demand). The constraints, including BESS round-trip efficiency, Depth of Discharge (DoD), and system losses, are considered at this step.
2.1. BESS sizing calculation
BESS capacity is determined by two magnitudes: power capacity and energy capacity. Power capacity represents the maximum amount of charging/discharging power that can be absorbed/given by BESS. Meanwhile, energy capacity is the BESS's ability to store electrical energy at a particular time. The power capacity is determined by the BESS's maximum instantaneous power that must be absorbed/supplied. BESS power (PBESS) can be estimated using previously obtained quantities as follows:
(1)
(1) where Pload(t) and Pgen(t) are the load and generation at time t, and ηinv is the BESS inverter efficiency.
Furthermore, the energy capacity of the BESS (EBESS) is determined by considering the charging capacity (Ech) and BESS DoD, as follows:
(2)
(2)
2.2. Economic calculation
Calculation of the benefits of BESS implementation for load shifting is performed by evaluating the Net Present Value (NPV) of the BESS implementation, as follows:
(3)
(3) where Ry is the revenue of y-th year (USD), Cy is the cost of the y-th year (USD), Y is the lifetime (years), i is the discount rate (%), and P/F is the present value obtained from the future value of the y-th year.
The revenue (Ry) is calculated by considering the cost reduction from the generation unit being replaced by BESS, as follows:
(4)
(4) where ci and Ei are the generation cost in USD/kWh, and the energy production in kWh of i-th generator unit being replaced by BESS, respectively, and M is the total number of generator units being replaced by BESS.
The cost (Cy) is calculated by considering the investment, the operational and maintenance cost for BESS, the energy cost required for charging BESS, as well as the cost of not-using the replaced generation units, which are mathematically shown as follows:
(5)
(5) where IBESS and OBESS are the investment and the operational cost in USD/kWh of BESS implementation, respectively, cj is the generation cost in USD/kWh of the j-th generation unit used to charge BESS, Ech,j is the energy required to charge BESS in kWh of j-th generator, N is the total number of generator unit used to charge BESS, and di is the cost of not-using the replaced generation units.
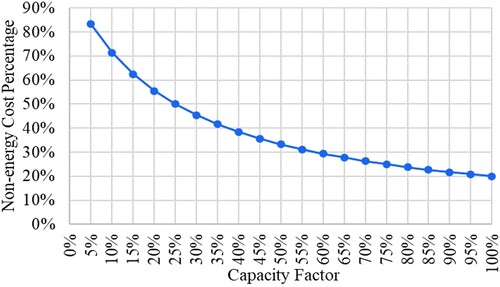
The cost of not-using the replaced generation units, so-called the non-energy cost (Cy), is estimated at 20% to 100% of the total energy generation cost. Hence, for power plants with CF below 100%, the non-energy cost can be estimated by the interpolation method of energy cost and CF data, as shown in .
Figure 3. Estimation of non-energy costs based on capacity factors.
3. Large scale power grid
The case study in this research is applied to 3 large-scale power grids in Sumatera, Indonesia: Sumbagut, Sumbagteng, and Sumbagsel systems. The load and generation data of the three systems are obtained from the average load and generation information between 1 January 2019, and 31 December 2019, at intervals of 30 min. In this paper, the power plants’ names are modified and incorporated with the sequential number due to confidentiality. ‘D-Gen’, ‘GE-Gen’, ‘GT-Gen’, ‘CC-Gen’, ‘ST-Gen’, ‘H-Gen’, ‘Geo-Gen’, ‘BG-Gen’, and ‘S-Gen’ represent the diesel, gas engine, gas turbine, combined cycle, steam turbine, hydropower, geothermal, biogas, and solar power plant, respectively. The ‘IPP’ indicates the Independent Power Producer (IPP), where the power plant ownership belongs to the private company. The power plant is divided into two categories: with Take-or-Pay (TOP) schemes and other power plants (Non-TOP). The IPP power plant is all included in the TOP plant.
3.1. Sumbagut system
The load and generation profile of the Sumbagut system is presented in , and the summary of the Sumbagut system is provided in . The average daily load was 1646.36 MW, with the average daily minimum and maximum loads of 1478.28 MW and 1985.31 MW, respectively. The average load factor is 0.83. The average daily energy consumption is 39,512.55 MWh/day. The total number of power plants operating was 93, with a total connected power capacity of 3153 MW, and the daily average generation capacity factor was 52%.
Figure 4. Daily average load and generation profile of the Sumbagut System.
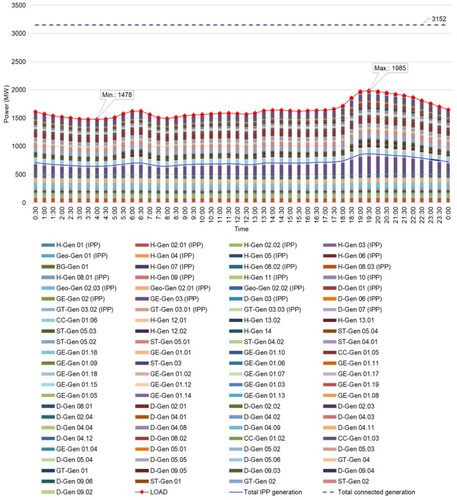
Table 1. Summary of the Sumbagut System.
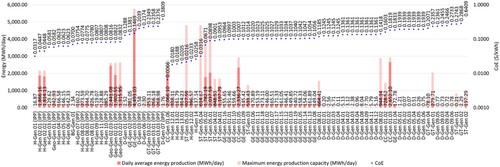
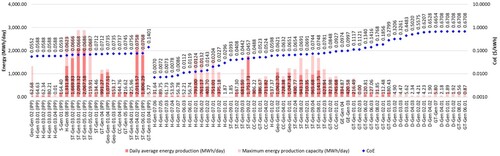
The average cost of energy (CoE) in the Sumbagut system is 0.0986 $/kWh. The generation cost is highly dependent on the CF of the associated generator unit. The power plant with the lowest generation cost is CC-Gen 01.06, with a CoE of 0.0066 $/kWh, and the power plant with the highest cost is ST-Gen 02, with a CoE of 0.6409 $/kWh. shows the daily average energy production, maximum energy production capacity, and the CoE of each generation unit in the Sumbagut system.
Figure 5. Daily average energy production, maximum energy production capacity, and the CoE of each generation unit in the Sumbagut System.
3.2. Sumbagteng system
The load and generation profile of the Sumbagteng system is presented in , and the summary of the Sumbagteng system is provided in . The average daily load was 876.34 MW, with the average daily minimum and maximum loads of 702.63 MW and 1187.36 MW, respectively. The average load factor is 0.73. The average daily energy consumption is 21,032.23 MWh/day. The total number of power plants operating was 73, with a total connected power capacity of 1845 MW, and the daily average generation capacity factor was 48%.
Figure 6. Daily average load and generation profile of the Sumbagteng System.
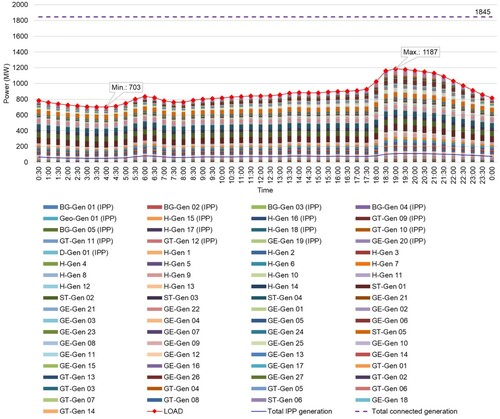
Table 2. Summary of the Sumbagteng System.
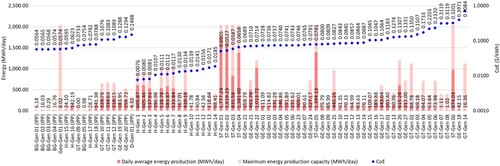
The CoE in the Sumbagteng system is 0.0771 $/kWh. The generation cost is highly dependent on the CF of the associated generator unit. The power plant with the lowest generation cost is H-Gen 01, with a CoE of 0.0076 $/kWh, and the power plant with the highest cost is GT-Gen 14, with a CoE of 0.7084 $/kWh. shows the daily average energy production, maximum energy production capacity, and the CoE of each generation unit in the Sumbagteng system.
Figure 7. Daily average energy production, maximum energy production capacity, and the CoE of each generation unit in the Sumbagteng System.
3.3. Sumbagsel system
The load and generation profile of the Sumbagsel system is presented in , and the summary of the Sumbagsel system is provided in . The average daily load was 1776.69 MW, and the average daily minimum and maximum loads were 1613.77 MW and 2183.54 MW, respectively. The average load factor is 0.81. The average daily energy consumption is 42,640 MWh/day. The total number of power plants operating was 93, with a total connected power capacity of 3241 MW, and the daily average generation capacity factor was 55%.
Figure 8. Daily average load and generation profile of the Sumbagsel System.
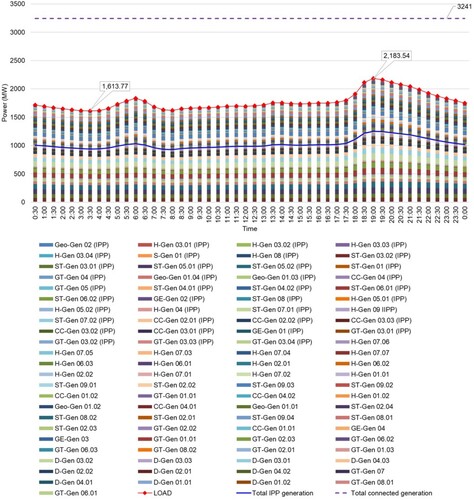
Table 3. Summary of the Sumbagsel System.
The CoE in the Sumbagsel system is 0.0730 $/kWh. The generation cost is highly dependent on the CF of the associated generator unit. The power plant with the lowest generation cost is H-Gen 07.06 with a CoE of 0.0070 $/kWh, and the power plant with the highest cost is D-Gen 01.01 with a CoE of 1.3588 $/kWh. shows the daily average energy production, maximum energy production capacity, and the CoE of each generation unit in the Sumbagsel system.
Figure 9. Daily average energy production, maximum energy production capacity, and the CoE of each generation unit in the Sumbagsel System.
4. Results and discussion
The load shifting calculation starts with the data screening to exclude the outlier by considering the previous operational data. Then it continues with determining the combination list described in Section 2. In the Sumbagut system, the total number of generation units that BESS can replace is 51, and the entire combination that satisfies the requirement is 183,727 combinations. Similarly, 39 units can be replaced in the Sumbagteng system and 28 in the Sumbagsel system. Furthermore, there are 824,033 and 648,444 combinations in the Sumbagteng and Sumbagsel systems. The summary of the combination list development for the three systems is presented in .
Table 4. Load shifting combination summary.
The replacement of the generation unit at each combination list at each system is performed and continued with the generation increase from the low-cost generation units to fulfil the demand and charging capacity requirement. The BESS capacity is sized based on Equation (1) and Equation (2) by employing the BESS round-trip efficiency and Depth of Discharge (DoD) of both 90% and the system losses of 3%. The BESS investment cost used in this study varies from 400 USD/kWh to 600 USD/kWh, depending on the required capacity. The BESS operational cost is 4% of the total annual investment cost. In addition, the BESS is treated to have a charge/discharge cycle of 5000 times and an annual capacity degradation of 2%/year. In this study, the applied discount rate (i) and the project lifetime are 6.5% and 20 years, respectively.
Following the BESS capacity sizing, the economic calculations are performed as described in Section 2.2, and the results are as follows:
4.1. Economic analysis of the Sumbagut system
4.1.1. Sumbagut: deactivation of most expensive generation units
The top four of the most expensive generation units in the Sumbagut system are presented in . This case requires only 4 MWh of BESS capacity for load shifting. However, the annual cost reduction that can be achieved is only 52,075 $/year, resulting in a negative NPV. Therefore, the load shifting implementation by excluding these generation units is considered not economically feasible.
Table 5. Generation units with the most expensive generation cost in the Sumbagut system.
4.1.2. Sumbagut: deactivation of generation units with the highest cost reduction
The highest annual cost reduction that can be attained is $ 15,470,115 per year. It shall replace 73.29 MW of net power capacity and require 142 MWh of BESS capacity. Although it gives the highest cost reduction, it does not award the most attractive NPV, which is only $ 27,830,142, due to the significant investment for BESS.
4.1.3. Sumbagut: deactivation of generation units with the highest economic return contribution
The highest NPV of load shifting implementation with single-unit replacement occurs when the combined cycle generator CC-Gen 01.02 is replaced. It has a generation cost of 0.1603 $/kWh, a net power capacity of 60 MW, and 51% CF. The annual cost reduction is 11,951,913 $/year, the BESS capacity is 87 MWh, and the resulting NPV is $ 32,543,010. In comparison, the second-highest NPV of load shifting implementation with single-unit replacement occurs when the gas engine generator GE-Gen 01.04 is replaced, with 0.1833 $/kWh of generation cost, 8.5 MW of net power capacity, and 85% CF. It results in an annual cost reduction of 5,102,716 $/year, a required BESS capacity of 41 MWh, and an NPV of $ 6,407,753. However, the combination of these two generation units can only give a return of $ 27,377,355 even though the annual cost reduction can reach 15,442,810 $/year, yet the required BESS is as high as 142 MWh. This result comes from non-uniform generation cost, net power capacity, and the generation profile between the generation units. Therefore, it is necessary to discover the optimum combination of the generation units that shall be replaced in load shifting implementation.
4.1.4. Sumbagut: deactivation of the maximum allowed number of generation units
The best return that can be obtained when replacing 4 generation units results in $ 33,503,005 of NPV. In this case, the list of generation units can be seen in . The annual cost reduction can be $ 11,953,909 annually, and the BESS capacity is 86 MWh.
Table 6. The exclusion of six generation units with the highest NPV in the Sumbagut system.
4.1.5. Sumbagut: the proposed method
The highest economic return is obtained by replacing the generation units, as presented in . The possible annual cost reduction can achieve up to $ 11,954,980 annually, resulting in $ 33,513,255 of NPV. The required BESS capacity is 86 MWh, which replaces 62.36 MW of power capacity and 729.28 MWh of daily energy. This result is equivalent to replacing 1.84% of the daily average demand.
Table 7. The replaced generation units for optimized load shifting implementation in the Sumbagut system.
The economic calculation for the Sumbagut system evidences that the proposed method results in the highest return in the load shifting implementation. Hence, deactivating the most expensive generators gives a negative NPV, while turning off the generators with the highest cost reduction gives an NPV of $ 27,830,142. On the other hand, the selection of generators having the highest economic return contribution only results in an NPV of $ 27,377,355. The decision to deactivate the maximum allowed number of generation units provides a higher NPV ($ 33,503,005). Meanwhile, the proposed method can obtain the highest NPV, which is $ 33,513,255.
4.2. Economic analysis of the Sumbagteng system
4.2.1. Sumbagteng: deactivation of most expensive generation units
In the Sumbagteng system, the maximum number of generation units that can be replaced simultaneously is six, as shown in . Hence, the top six of the most expensive generation units in the Sumbagteng system are presented in . In this case, the required BESS capacity for load shifting is 131 MWh, the annual cost reduction is 2,267,405 $/year, and it results in a negative NPV, so the load shifting implementation by excluding these generation units is considered not economically feasible.
Table 8. Generation units with the most expensive generation cost in the Sumbagteng system.
4.2.2. Sumbagteng: deactivation of generation units with the highest cost reduction
The highest annual cost reduction can be as high as 11,752,773 $/year, which can be obtained by replacing the total 97.36 MW of net power capacity and the required 217 MWh of BESS capacity. However, this scenario does not offer a satisfying economic return (negative NPV) since BESS requires a considerable investment.
4.2.3. Sumbagteng: deactivation of generation units with the highest economic return contribution
The load shifting implementation by replacing a single generation unit results in the highest NPV of $ 7,224,841 and $ 4,978,708, achieved by excluding the gas engine generators GE-Gen 17 and GT-Gen 01, respectively. Both generation units have 25 MW and 13.86 MW net power capacity, 57.2% and 61.1% CF, and 0.1064 $/kWh and 0.1183 $/kWh of generation cost, respectively. The annual cost reduction is 1,698,483 $/year (GE-Gen 17) and 1,925,821 $/year (GE-Gen 01), and the required BESS capacity is 8 MWh for the first option and 13 MWh for the second one. The combination of these two generation units can have a better NPV ($ 20,795,755). The annual cost reduction can achieve 3,686,440 $/year, and the required BESS capacity is only 14 MWh, which is used to replace the total of 38.86 MW of power capacity and 546.44 MWh of daily energy. This result is equivalent to replacing 2.6% of the daily average demand.
4.2.4. Sumbagteng: deactivation of the maximum allowed number of generation units
The best return that can be obtained when replacing 6 generation units can only result in $ 17,107,584 of NPV. The list of generation units can be seen in . The annual cost reduction can be $ 5,679,941, and the BESS capacity is 36 MWh.
Table 9. The exclusion of 6 generation units in the Sumbagteng system.
4.2.5. Sumbagteng: the proposed method
The highest economic return is obtained by replacing the generation units, as presented in . The possible annual cost reduction can achieve by up to $ 4,313,233 per year, which is lower than the cost reduction when excluding the most expensive generation units. This selection results in $ 21,620,367 of NPV. The required BESS capacity is only 19 MWh, which replaces 97.64 MW of power capacity and 867.80 MWh of daily energy (equivalent to replacing 4.12% of the daily average demand).
Table 10. The replaced generation units for optimized load shifting implementation in the Sumbagteng system.
In the Sumbateng system, excluding the most expensive generators or turning off the generators with the highest cost reduction results in negative NPV. Implementing load shifting using other conventional methods gives a better NPV, such as $ 20,795,755 if deactivating generation units with the highest economic return contribution or $ 17,107,584 if the deactivating maximum allowed number of generators. Meanwhile, the proposed method can provide the highest economic return for load shifting implementation ($ 21,620,367). These results show the superiority of the proposed method compared with conventional methods, which is consistent with the result of the Sumbagut system.
4.3. Economic analysis of the Sumbagsel system
4.3.1. Sumbagsel: deactivation of most expensive generation units
In the Sumbagsel system, the maximum number of generation units that can be replaced simultaneously is seven, as shown in . Hence, the top seven of the most expensive generation units in the Sumbagsel system are presented in . In this case, the required BESS capacity for load shifting is 12 MWh, the annual cost reduction is 279,858 $/year, and it results in a negative NPV, so the load shifting implementation by excluding these generation units is considered not economically feasible.
Table 11. Generation units with the most expensive generation cost in the Sumbagsel system.
4.3.2. Sumbagsel: deactivation of generation units with the highest cost reduction
The highest annual cost reduction can reach 16,047,446 $/year, which can be obtained by replacing 87.3 MW of net power capacity with 124 MWh of BESS capacity. This configuration brings about a feasible result with an NPV of $ 48,598,378.
4.3.3. Sumbagsel: deactivation of generation units with the highest economic return contribution
The replacement of a single generation unit results in the highest NPV, which is $ 88,160,883, which is achieved by excluding the gas turbine generators GT-Gen 01.03 (11 MW, CF is 68.3%, generation cost is 0.2799 $/kWh). The required BESS capacity is only 2 MWh, which replaces 180.43 MWh daily energy. This result is equivalent to replacing 0.42% of the daily average demand. This result indicates that implementing load shifting might not be necessary since the same feedback can be obtained by switching off the associated generation and simply increasing the other generation unit.
4.3.4. Sumbagsel: deactivation of the maximum allowed number of generation units
The best return that can be obtained when replacing 7 generation units can only result in $ 120,659,685 of NPV. In this case, the list of generation units can be seen in . The annual cost reduction can be $ 13,795,365 annually, and the BESS capacity is 11 MWh.
Table 12. The exclusion of 7 generation units in the Sumbagsel system.
4.3.5. Sumbagsel: the proposed method
The highest economic return is obtained by replacing the two generation units, as presented in . The possible annual cost reduction can achieve up to $ 13,587,789 per year. This selection results in $ 123,283,142 of NPV. The required BESS capacity is only 6 MWh, which replaces 48.5 MW of power capacity and 926.11 MWh of daily energy (equivalent to replacing 2.17% of the daily average demand).
Table 13. The replaced generation units for optimized load shifting implementation in the Sumbagsel system.
The calculation result in the Sumbagsel system is consistent with the Sumbagut and Sumbagteng systems, in which the proposed method outperforms the other conventional methods. The exclusion of the most expensive generators brings a negative NPV. Whereas, the deactivation of the generators with the highest cost reduction gives NPV of $ 48,598,378, the deactivation of the generators with the highest economic return contribution gives NPV of $ 88,160,883, and the deactivation of the maximum number of generators gives NPV of $ 120,659,685. Meanwhile, the proposed method results in the highest NPV of $ 123,283,142.
5. Conclusions
This paper presented an economic analysis of load shifting implementation using BESS in three large power systems in Indonesia. The load shifting was simulated through a cost-based strategy that returns the highest NPV when applied. The problem with this strategy was selecting which generator units to be replaced by BESS that give the most economical return.
This paper has shown that the proposed method provides a more robust result in deciding which generation units to be deactivated and replaced by BESS for load shifting implementation, as summarized in . It shows that deactivating the most expensive generation units is not necessarily profitable. Secondly, a higher possible annual cost reduction did not offer the best outcome for load shifting implementation since the required BESS capacity and investment cost might be exponentially higher. In addition, evaluating the NPV of a single unit replacement and then combining some of these units with the highest return for load shifting did not result in the highest NPV overall. Lastly, deactivating the maximum allowed number of units also does not guarantee the most beneficial economic return.
Table 14. The comparison summary of load shifting implementation between the conventional and proposed method.
In this paper, the finding of the best combination was performed by evaluating each possible combination list, and it took quite a long time to simulate. Nevertheless, it produced the most optimized result for load shifting implementation, especially for large systems. Hence, the proposed strategy used in this paper can be applied in any extensive power system for load shifting implementation. The proposed method can be applied to decide which generators to deactivate and replace them with BESS that can provide the best economic return. The proposed method can be used for large power systems with many power generation systems. Despite the satisfactory result, this method requires a longer simulation time to determine the generators to be deactivated. Thus, some enhanced methods might be necessary to reduce the simulation time without compromising the performance.
Finally, the future research that can be developed based on this paper's findings includes how to minimize the simulation time to find the optimized configuration of generation units to be replaced as well as to generalize the rank of the important variables for taking out the generation units in load shifting implementation. One of the strategies that can be applied is by determining the most correlated parameters and employing the weight to those parameters before and during the simulation. Furthermore, some of the applications of machine learning methods, such as the Artificial Neural Network (ANN), regression analysis, and Support Vector Machine (SVM), are also worth studying in this topic.
Disclosure statement
No potential conflict of interest was reported by the author(s).
Data availability statement
The authors confirm that the data supporting the findings of this study are available within the article.
Additional information
Funding
References
- Abdullah, W. S. W., M. Osman, M. Z. A. A. Kadir, R. Verayiah, N. F. A. Aziz, and M. A. Rasheed. 2021. “Techno-economics Analysis of Battery Energy Storage System (Bess) Design for Virtual Power Plant (VPP)–A Case Study in Malaysia.” Journal of Energy Storage 38 (March): 102568. https://doi.org/10.1016/j.est.2021.102568.
- Barchi, G., M. Pierro, and D. Moser. 2019. “Predictive Energy Control Strategy for Peak Switch and Shifting Using BESS and PV Generation Applied to the Retail Sector.” Electronics 8 (5): 526. https://doi.org/10.3390/electronics8050526.
- Chapaloglou, S., A. Nesiadis, P. Iliadis, K. Atsonios, N. Nikolopoulos, P. Grammelis, C. Yiakopoulos, I. Antoniadis, and E. Kakaras. 2019. “Smart Energy Management Algorithm for Load Smoothing and Peak Shaving Based on Load Forecasting of an Island’s Power System.” Applied Energy 238 (January): 627–642. https://doi.org/10.1016/j.apenergy.2019.01.102.
- Chen, L., Q. Xu, Y. Yang, and J. Song. 2021. “Optimal Energy Management of Smart Building for Peak Shaving Considering Multi-Energy Flexibility Measures.” Energy and Buildings 241:110932. https://doi.org/10.1016/j.enbuild.2021.110932.
- Claeys, R., G. de Greve, J. Knockaert, and J. Desmet. 2021. “Sizing BESS for a Peak Shaving and Valley Filling Control Strategy for Residential Consumers Based on Their Load-Duration Curves.” NEIS 2021 - Conf. Sustain. Energy Supply Energy Storage Syst., 47–52.
- Davies, D. M., M. G. Verde, O. Mnyshenko, Y. R. Chen, R. Rajeev, Y. S. Meng, and G. Elliott. 2019. “Combined Economic and Technological Evaluation of Battery Energy Storage for Grid Applications.” Nature Energy 4 (1): 42–50. https://doi.org/10.1038/s41560-018-0290-1.
- Dejvises, J. 2016. “Energy Storage System Sizing for Peak Shaving in Thailand.” ECTI Transactions on Electrical Engineering, Electronics, and Communications 14 (1): 49–55. https://doi.org/10.37936/ecti-eec.2016141.171094
- De Salis, R. T., A. Clarke, Z. Wang, J. Moyne, and D. M. Tilbury. 2014. “Energy Storage Control for Peak Shaving in a Single Building.” IEEE Power Energy Soc. Gen. Meet. 2014 (October): 1–5. https://doi.org/10.1109/PESGM.2014.6938948.
- Dong, X., G. Bao, Z. Lu, Z. Yuan, and C. Lu. 2011. “Optimal Battery Energy Storage System Charge Scheduling for Peak Shaving Application Considering Battery Lifetime.” Lecture Notes in Electrical Engineering 133 (VOL. 2): 211–218. https://doi.org/10.1007/978-3-642-25992-0_30.
- Even, A., J. Neyens, and A. Demouselle. 1993. Peak Shaving with Batteries.
- Hosseini, S. A., M. Toulabi, A. Ashouri-Zadeh, and A. M. Ranjbar. 2022. “Battery Energy Storage Systems and Demand Response Applied to Power System Frequency Control.” International Journal of Electrical Power & Energy Systems 136:107680. https://doi.org/10.1016/j.ijepes.2021.107680
- Hu, Y., M. Armada, and M. J. Sánchez. 2022. “Potential Utilization of Battery Energy Storage Systems (BESS) in the Major European Electricity Markets.” Applied Energy 322:119512. https://doi.org/10.1016/j.apenergy.2022.119512.
- Ioakimidis, C. S., D. Thomas, P. Rycerski, and K. N. Genikomsakis. 2018. “Peak Shaving and Valley Filling of Power Consumption Profile in non-Residential Buildings Using an Electric Vehicle Parking lot.” Energy 148:148–158. https://doi.org/10.1016/j.energy.2018.01.128.
- Jankowiak, C., A. Zacharopoulos, C. Brandoni, P. Keatley, P. MacArtain, and N. Hewitt. 2020. “Assessing the Benefits of Decentralised Residential Batteries for Load Peak Shaving.” Journal of Energy Storage 32 (April): 101779. https://doi.org/10.1016/j.est.2020.101779.
- Jufri, F. H., D. R. Aryani, I. Garniwa, and B. Sudiarto. 2021. “Optimal Battery Energy Storage Dispatch Strategy for Small-Scale Isolated Hybrid Renewable Energy System with Different Load Profile Patterns.” Energies 14 (11): 3139. https://doi.org/10.3390/en14113139.
- Kucevic, D., B. Tepe, S. Englberger, A. Parlikar, M. Mühlbauer, O. Bohlen, A. Jossen, and H. Hesse. 2020. “Standard Battery Energy Storage System Profiles: Analysis of Various Applications for Stationary Energy Storage Systems Using a Holistic Simulation Framework.” Journal of Energy Storage 28 (November 2019): 101077. https://doi.org/10.1016/j.est.2019.101077.
- Lange, C., A. Rueß, A. Nuß, R. Öchsner, and M. März. 2020. “Dimensioning Battery Energy Storage Systems for Peak Shaving Based on a Real-Time Control Algorithm.” Applied Energy 280 (July): 115993. https://doi.org/10.1016/j.apenergy.2020.115993.
- Lee, J. W., M. H. S. M. Haram, G. Ramasamy, S. P. Thiagarajah, E. E. Ngu, and Y. H. Lee. 2021. “Technical Feasibility and Economics of Repurposed Electric Vehicles Batteries for Power Peak Shaving.” Journal of Energy Storage 40 (March): 102752. https://doi.org/10.1016/j.est.2021.102752.
- Liu, S., S. Silwal, and J. Kleissla. 2022. “Power and Energy Constrained Battery Operating Regimes: Effect of Temporal Resolution on Peak Shaving by Battery Energy Storage Systems.” Journal of Renewable and Sustainable Energy 14 (1): 014101. https://doi.org/10.1063/5.0061813.
- Lo, C. H., and M. D. Anderson. 1999. “Economic Dispatch and Optimal Sizing of Battery Energy Storage Systems in Utility Load-Leveling Operations.” IEEE Transactions on Energy Conversion 14 (3): 824–829. https://doi.org/10.1109/60.790960.
- Lobato, E., L. Sigrist, and L. Rouco. 2013. “Use of Energy Storage Systems for Peak Shaving in the Spanish Canary Islands.” IEEE Power Energy Soc. Gen. Meet. https://doi.org/10.1109/PESMG.2013.6672212.
- Mair, J., K. Suomalainen, D. M. Eyers, and M. W. Jack. 2021. “Sizing Domestic Batteries for Load Smoothing and Peak Shaving Based on Real-World Demand Data.” Energy and Buildings 247:111109. https://doi.org/10.1016/j.enbuild.2021.111109.
- Manojkumar, R., C. Kumar, S. Ganguly, H. B. Gooi, S. Mekhilef, and J. P. S. Catalão. 2022. “Rule-Based Peak Shaving Using Master-Slave Level Optimization in a Diesel Generator Supplied Microgrid.” IEEE Transactions on Power Systems 38 (3): 3177–3188. https://doi.org/10.1109/TPWRS.2022.3187069.
- Martins, R., H. C. Hesse, J. Jungbauer, T. Vorbuchner, and P. Musilek. 2018. “Optimal Component Sizing for Peak Shaving in Battery Energy Storage System for Industrial Applications.” Energies 11 (8), 2048. https://doi.org/10.3390/en11082048.
- Oudalov, A., R. Cherkaoui, and A. Beguin. 2007. “Sizing and Optimal Operation of Battery Energy Storage System for Peak Shaving Application.” 2007 IEEE Lausanne POWERTECH, Proc. 1: 621–625. https://doi.org/10.1109/PCT.2007.4538388.
- Park, C., V. Knazkins, F. R. S. Sevilla, P. Korba, and J. Poland. 2015. “On the estimation of an optimum size of Energy Storage System for local load shifting.” IEEE Power Energy Soc. Gen. Meet., September 2015. 1–5. https://doi.org/10.1109/PESGM.2015.7285950.
- Paul, E., J. Schäuble, H. Heidar Esfehani, A. Bensmann, D. Bohne, and R. Hanke-Rauschenbach. 2019. “Battery Storage Systems in Various Types of Non-Residential Buildings for Peak Shaving Application.Proceedings of the 13th International Renewable Energy Storage Conference 2019 (IRES 2019).
- Rana, M. M., M. Atef, M. R. Sarkar, M. Uddin, and G. M. Shafiullah. 2022. “A Review on Peak Load Shaving in Microgrid—Potential Benefits, Challenges, and Future Trend.” Energies 15 (6): 1–17. https://doi.org/10.3390/en15062278.
- Rana, M., M. Fakhizan, M. Faris, and M. Uddin. 2021. “A Novel Peak Load Shaving Algorithm for Isolated Microgrid Using Hybrid PV-BESS System.” Energy 234:121157. https://doi.org/10.1016/j.energy.2021.121157.
- Rana, M. M., M. Uddin, M. R. Sarkar, G. M. Shafiullah, H. Mo, and M. Atef. 2022. “A Review on Hybrid Photovoltaic – Battery Energy Storage System: Current Status, Challenges, and Future Directions.” Journal of Energy Storage 51: 104597. https://doi.org/10.1016/j.est.2022.104597.
- Reyseliani, N., and W. W. Purwanto. 2021. “Pathway Towards 100% Renewable Energy in Indonesia Power System by 2050.” Renewable Energy 176:305–321. https://doi.org/10.1016/j.renene.2021.05.118.
- Sani, L., D. Khatiwada, F. Harahap, and S. Silveira. 2021. “Decarbonization Pathways for the Power Sector in Sumatra, Indonesia.” Renewable and Sustainable Energy Reviews 150 (June): 111507. https://doi.org/10.1016/j.rser.2021.111507.
- Setiawan, A., Z. Arifin, B. Sudiarto, and I. Garniwa. 2021. Electricity Tariff Simulation on The Largest Electric Power System in Indonesia Using The Time Of Use and Critical Peak Pricing Schemes Based on Revenue Neutrality.
- Shi, Y., B. Xu, D. Wang, and B. Zhang. 2018. “Using Battery Storage for Peak Shaving and Frequency Regulation: Joint Optimization for Superlinear Gains.” IEEE Transactions on Power Systems 33 (3): 2882–2894. https://doi.org/10.1109/TPWRS.2017.2749512.
- Tchagang, A., and Y. Yoo. 2020. “V2B/V2G on Energy Cost and Battery Degradation Under Different Driving Scenarios, Peak Shaving, and Frequency Regulations.” World Electric Vehicle Journal 11 (1): 1–11. https://doi.org/10.3390/WEVJ11010014.
- Telaretti, E., and L. Dusonchet. 2016. “Battery Storage Systems for Peak Load Shaving Applications: Part 1: Operating Strategy and Modification of the Power Diagram.” EEEIC 2016 - Int. Conf. Environ. Electr. Eng.
- Uddin, M., M. F. Romlie, M. F. Abdullah, S. Abd Halim, A. H. Abu Bakar, and T. Chia Kwang. 2018. “A Review on Peak Load Shaving Strategies.” Renewable and Sustainable Energy Reviews 82 (August): 3323–3332. https://doi.org/10.1016/j.rser.2017.10.056.
- Wang, Y., L. Liu, R. Wennersten, and Q. Sun. 2019. “Peak Shaving and Valley Filling Potential of Energy Management System in High-Rise Residential Building.” Energy Procedia 158:6201–6207. https://doi.org/10.1016/j.egypro.2019.01.487.
- Zheng, M., C. J. Meinrenken, and K. S. Lackner. 2015. “Smart Households: Dispatch Strategies and Economic Analysis of Distributed Energy Storage for Residential Peak Shaving.” Applied Energy 147:246–257. https://doi.org/10.1016/j.apenergy.2015.02.039.
- Zhuang, P., and H. Liang. 2019. “Hierarchical and Decentralized Stochastic Energy Management for Smart Distribution Systems with High BESS Penetration.” IEEE Transactions on Smart Grid 10 (6): 6516–6527. https://doi.org/10.1109/TSG.2019.2906823.
- Zimmermann, F., and A. Sauer. 2020. “Sizing Electric Storage Systems for Industrial Peak Shaving Applications.” Procedia CIRP 90:666–671. https://doi.org/10.1016/j.procir.2020.01.073.
