
 ?Mathematical formulae have been encoded as MathML and are displayed in this HTML version using MathJax in order to improve their display. Uncheck the box to turn MathJax off. This feature requires Javascript. Click on a formula to zoom.
ABSTRACT
With green hydrogen gaining traction as a viable sustainable energy option, the present study explores the potential of producing green hydrogen from wind and solar energy in Ghana. The study combined the use of geospatial multi-criteria approach and PEM electrolysis process to estimate the geographical and technical potential of the selected two renewable resources. The study also included an assessment of potential areas for grid integration. Technology specifications of a monocrystalline solar PV module and 1 MW wind turbine module were applied. Results of the assessment show that about 85% of the total land area in the country is available for green hydrogen projects. Technically, capacities of ∼14,196.21 Mt of green hydrogen using solar and ∼10,123.36 Mt/year from wind energy can be produced annually in the country. It was also observed that some regions, especially regions in the northern part of the country even though showed the most favourable locations for solar-based green hydrogen projects with technical potential of over 1500 Mt/year, these regions may not qualify for a grid connected system based on the current electrification policy of the country due to the regions’ low population density and distance from the power grid network threshold.
1. Introduction
The achievement of net-zero carbon economies and access to sustainable energy will require the development and evolution of new and improved technologies to harness energy from renewable sources. With the increasing call on global leaders and governments to decarbonise their energy systems due to the adverse impact of global warming on the environment and on society, many leaders with the help of researchers are encouraged to explore various sustainable energy or fuel options to diversify their energy systems. For this reason, and aside other renewable energy resources like wind, solar, hydro, biomass, and geothermal, green hydrogen is also gaining increasing traction as a possible alternative source.
Green hydrogen could provide a great opportunity to countries in Sub-Saharan Africa towards achieving sustainable universal energy access and the eradication of energy poverty. Countries in this region could leverage on the rich renewable energy potentials to produce green hydrogen as an alternative source for electricity generation (Herdem et al. Citation2023), alternative cooking fuel, and for export. Globally about 2.4 billion people still rely on traditional fuels (World Bank Citation2023b) like charcoal, fuelwood, crop waste and kerosene for cooking with the associated toxic heath implications as well as negative impact on the environment. It is projected to contribute about 6%–18% of total global energy consumption by 2050 (Ball and Weeda Citation2015; Okunlola, Davis, and Kumar Citation2022). Hydrogen is also the most abundant element in the universe yet difficult to obtain in its pure form (Acakpovi et al. Citation2021; Mackenzie Citation2019). It is a valuable fuel source widely used in the heavy industry like the manufacturing and transport industries. Global demand for hydrogen is about 70 MtFootnote1/year (Mackenzie Citation2019). The greater concern, however, is that, 99% of today’s hydrogen is not green but rather generated from hydrocarbons like coal and natural gas contributing substantially to the share of CO2 emissions released into the atmosphere (Mackenzie Citation2019). Green hydrogen on the other hand, is not produced with hydrocarbons but from renewable energy resources like solar and wind through electrolysis by splitting water molecules into hydrogen and oxygen. Many developed countries with good penetration of renewable energy (RE) sources are therefore exploring the potential for long-term commercial production of green hydrogen for domestic uses (Okunlola, Davis, and Kumar Citation2022). About 252 MW cumulative installed capacity of green hydrogen projects were deployed by the end of 2019 and additional 3205 MW of electrolyser for green hydrogen production will be deployed globally by the end of 2025 (Mackenzie Citation2019).
Ghana, like many countries, is currently exploring other sustainable means of energy to diversify the country’s energy mix in order to meet its Agenda 2030 commitments and targets (Energy Commission of Ghana Citation2019; Ghana – Action Plan for Sustainable Energy for All by 2030, Citation2012, ‘SE4ALL-GHANA ACTION PLAN’ 2012). Green hydrogen will therefore provide great opportunity to the country due to the availability of renewable resources like solar and wind; and particularly for solar which the country has in abundance. This is also because countries in the Sun-Belt region, i.e. between 40° north and south of the Equator have higher potential for solar energy than other parts of the world.
Thus, the potential of green hydrogen is a promising option for the country to consider. This technology if properly developed and harnessed, could even be produced on a commercial scale for export as well as to meet the electricity needs at a grid connection level which will also help minimise the risks associated with the over-reliance on a specific fuel source. This is again particularly crucial for a developing country like Ghana that relies on imported fossil fuels to power its thermal plants – the most dominant energy source in the country’s energy mix (Asare-Addo Citation2022; Energy Commission of Ghana Citation2020; Citation2021).
Besides, according to the IEA report (IEA – International Energy Agency Citation2021), the co-location of hydrogen production from renewables often helps to avoid or minimise the costs associated with electricity transmission. Also, electrolysers used for producing green hydrogen can operate dynamically, needing only seconds to operate at maximum capacity and thus can easily be integrated with renewable infrastructure that are frequently disrupted for long or short duration, and can be stored for longer periods in large tanks for later use (Mackenzie Citation2019). Opportunities for green hydrogen production in the country exist, even for export. According to Mackenzie (Mackenzie Citation2019), even though green hydrogen might not be currently competitive on the market as projected in most scenarios by 2025, national pilot projects and targets will help generate enough volume to achieve substantial CAPEX decline beyond 2025. Ghana however as at the end of 2022 does not have a hydrogen energy policy or any existing hydrogen initiatives (Ballo et al. Citation2022).
Hydrogen over the past years has been produced mainly from hydrocarbons. There are currently about four types of hydrogen produced differently based on the kind of resource used, the technology used, and the processing or method used to produce the hydrogen. Aside green hydrogen, which is produced using renewable resources via electrolysis, the other types are produced using fossil fuels with hydrogen and carbon dioxide as end products. Fossil-based hydrogen includes the blue hydrogen which uses Steam Methane Reforming (SMR) plant with carbon capture and storage (CCS) or Coal gasification plant with CCS to convert natural gas or coal into hydrogen and CO2 as well as stores CO2 for reuse. Grey hydrogen is also produced using SMR or coal gasification plant to generate hydrogen and CO2 using natural gas and coal. Another type is turquoise hydrogen which uses methane pyrolysis plant with carbon capture and utilisation (CCU) to split methane into hydrogen and solid carbon. The present study explores the potential of producing green hydrogen from solar and wind in Ghana using the water electrolysis process and the application of geographic information systems (GIS) techniques.
Many studies have combined the production of green hydrogen via electrolysis with multi-criteria approaches and GIS methods to assess the potential of green hydrogen in many countries. This is mainly due to the spatial characteristics associated with RE sources used for producing the green hydrogen. The application of GIS has become a widely used approach not only in green hydrogen potential assessment but also predominantly used for assessing the potential of RE projects globally. Moreover, the application of GIS in resource assessment has become increasingly important because of the unequal distribution of RE sources across the globe in terms of generation capacity and predominance. For instance, (Bhandari Citation2022) combined the application of GIS and regression analysis to forecast the potential of solar-to-hydrogen demand across the electricity and transport sectors till 2040 in Niger. The study highlighted that the use of GIS provided a more accurate analysis as it factored in different land use policies which is required to estimate the true hydrogen potential of a location. The application of GIS in the study was however mainly used to evaluate the theoretical and the technical potentials of green hydrogen from solar potential in Niger. Other studies also used GIS to assess the technical potential of green hydrogen (solar and wind) in Canada (Okunlola, Davis, and Kumar Citation2022). Their study however only focused on the technical potential without estimating the geographical potential. A geospatial approach was also applied to assess the feasibility of green hydrogen from solar, wind and hydropower to replace grey hydrogen production in the EU27 and UK at the regional level (Kakoulaki et al. Citation2021). Their study focused mainly on the technical potential while briefly highlighting the environmental constraints and techno-economic factors that could affect the generation capacities. Their study however did not explicitly estimate the geographical potential or how land use conditions impacted results of their assessment. (Touili et al. Citation2018) also performed a techno-economic feasibility study to analyse the potential of generating hydrogen from solar energy in Morocco. The authors used the method of interpolation in the GIS environment to visualised results of their simulation. Their research was also purely technical potential assessment without site suitability evaluation. Another techno-economic potential assessment of green hydrogen production from wind and solar was carried out in Oman by (Okonkwo et al. Citation2022). A study was also conducted in Turkey to assess and compare offshore and onshore green hydrogen potential from solar (Karayel, Javani, and Dincer Citation2022). Other country case studies include Algeria (Messaoudi et al. Citation2019; Rahmouni et al. Citation2017), South Africa (Ayodele and Munda Citation2019), Italy (Dagdougui, Ouammi, and Sacile Citation2011), Iran (Nematollahi et al. Citation2019), Morocco (Touili et al. Citation2018), Thailand (Ali et al. Citation2022), Chile (Gallardo et al. Citation2021), Jordan (Alrabie and Saidan Citation2018), Venezuela (Posso and Zambrano Citation2014), Ecuador (Posso et al. Citation2016), Brazil (Esteves et al. Citation2015), and in Turkey (Karayel, Javani, and Dincer Citation2023). Other studies also include an assessment of the cost of wind-electrolyser fuel cell for energy demand (Genç, Çelik, and Genç Citation2012), and a technical and financial evaluation of green hydrogen production using solar, wind and hybrid technologies in Egypt (Al-Orabi, Osman, and Sedhom Citation2023).
For the present case study, a review of the literature shows limited study on green hydrogen potential assessments in Ghana not to mention with a geospatial approach. The present study thus, presents a maiden effort towards quantifying the potential for producing green hydrogen from both wind and solar resources. Few existing studies include a techno-economic assessment of producing hydrogen from wind in Anloga district in the Volta region of Ghana by (Acakpovi et al. Citation2021). Their assessment however differs entirely from the present study as the present study focuses on the use of solar and wind energy as well as the application of GIS and remote sensing for all the regions. (Topriska et al. Citation2016) also analysed the feasibility of green hydrogen using solar for cooking in Ghana, Jamaica, and Indonesia. The authors estimated the cooking demand profiles to size the green hydrogen-solar plants for their selected communities using the TRNSYS model. The scope and aim of their research also differ from the present study. And even though their study included GIS, it was used to visualise the results of their analysis. The present study thus differs from these studies in the sense that, for the present study all computations were completely performed in the GIS environment using the model builder as well as with different objectives and approaches. Moreover, the present research unlike other studies, provided an evaluation of the national energy or electrification policies and their implications on energy systems diversification as well as their implications towards the country meeting its decarbonisation targets.
The main objective of this study therefore is to explore the potential of producing green hydrogen from solar and wind in Ghana by estimating their generation capacities at the national and regional levels. To achieve this aim, the geographical and the technical potentials for the two green hydrogen sources were estimated by combining GIS techniques and green hydrogen production by the electrolysis process. The study also went a step further to assess the potential of the green hydrogen produced for a utility-scale system as well as an estimation of the associated potential grid customers in each region.
2. Methodology
This section of the paper explains the approaches used to estimate the geographical and technical capacities for the two selected green hydrogen sources. The study adopted a geospatial approach using spatially explicit satellite images as well as local topographic conditions of Ghana to assess the site feasibility for the selected green hydrogen potentials in the country. The geospatial analysis included the use of ArcGIS, ArcGIS Pro and Quantum GIS (QGIS) software packages where applicable. Results of the geospatial assessment have been visualised using high-resolution maps and exported into excel using the zonal statistics tool and table to excel tool to show numerical values of the analysis at all regional levels in the country as shown in and . Also, all the input raster datasets used for this study were resampled to a 1 km × 1 km cell resolution (km²) using the bilinear interpolation technique in the GIS environment to achieve coherence in the output of results of the analysis or modelling. shows the geospatial processes used to estimate the resource potentials. Please note that, the theoretical potential was only used to assess the wind power potential of the wind speed. It is also important to clarify that, the economic potential, including the cost of land, were not considered in this study as an assessment of the economic potential is beyond the scope of the current research.
Figure 1. Methodology flowchart.
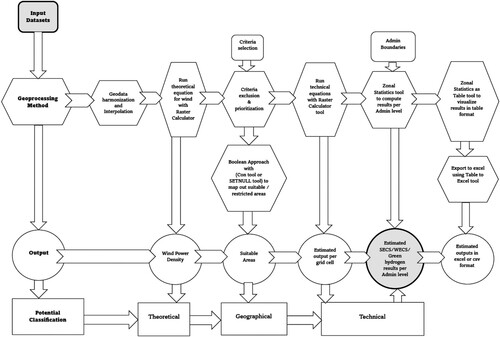
Three scenarios were thus carried out for the green hydrogen using solar and wind technical assessments (i) to compare production with and without power plant spacing constraints, (ii) to evaluate potential for a utility-scale or grid-connected system, (iii) to estimate green hydrogen potential grid-connected customers. The grid connection system analysis was done based on the 20 km proximity to the power grid network requirement rule by the national electrification policy of the country (Asare-Addo Citation2022; Ghana – Action Plan for Sustainable Energy for All by 2030, Citation2012, ‘SE4ALL-GHANA ACTION PLAN’ 2012).
2.1. Brief description of case study country – Ghana
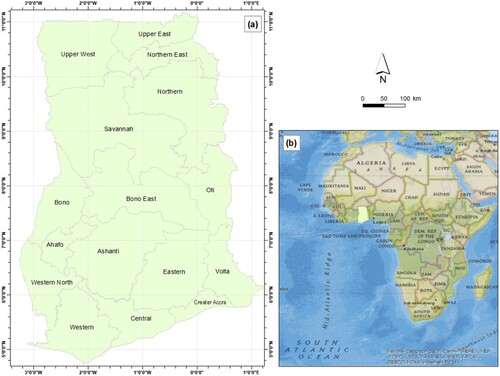
Ghana is located in West Africa and shares its borders with Burkina Faso to the north, Côte d’Ivoire to the west, Togo to the east, and to the south, lies the Gulf of Guinea and the Atlantic Ocean, as shown in . The country is a member of the United Nations and like other member countries, has pledged its commitment to decarbonise and provide sustainable energy for all of its citizens. In that regard, the country had set an ambitious target to reach universal energy access by 2020, which was also in line with the country’s 2010 National Energy Strategy (NES) (Ghana – Action Plan for Sustainable Energy for All by Citation2030). This goal however could not be realised even though significant progress has been made since the year of this commitment in 2016 (Energy Commission of Ghana Citation2020) with an increased electrification rate from 79% to ∼85% in 2020 (World Bank Citation2023a). Progress towards decarbonisation has nonetheless been slow as thermal power remains the main source of energy in the country’s generation mix (Asare-Addo Citation2022; Energy Commission of Ghana Citation2020) and accounts for 66.4% (Energy Commission of Ghana Citation2021) and, 32.9% from hydropower and only about 0.7% from renewables (Energy Commission of Ghana Citation2021). Moreso, despite an existing renewable energy policy (Energy Commission of Ghana Citation2019), the country, however, as at the end of 2022 does not have a policy on hydrogen or existing hydrogen project (Ballo et al. Citation2022). Opportunities to increase the share of renewables exist for the country due to its geographical location that has great potential for solar and even wind which are good sources for large-scale green hydrogen production.
Figure 2. Spatial representation of case study country, (a) Map of Ghana with regional boundaries, (b) Geographical location of Ghana.
2.2. Geographical potential assessment
This basically refers to the part of the total land area that is available and feasible for the development of renewable energy projects. The geographical potential generally gives insights into the characteristics of the terrain or topography of the land as well as the atmospheric conditions of the location that must be present to ensure optimal energy generation and operation of the power plant. The concept can also be extended to include other quantifiable characteristics of the location such as the social acceptability conditions like level of noise pollution by the power plants, exclusion of environmental protected areas, land use constraints, and conformity to national energy policy or programmes (e.g. marking out areas for utility-scale production or for off-grid electrification).
For the present study, not only were the atmospheric viability of the wind and solar resources considered, but also all protected areas or conservation sites were completely excluded from the analysis to conserve the environment. The geographical potential assessment thus, also marks the first reduction in the generation capacities of the green hydrogen production as part of the total land area of Ghana is excluded from the assessment. Please note that and as already mentioned, the site suitability criteria used though may be generic to certain resource potential assessments like solar and wind, there may exist considerable differences in other studies based on the scope and objective of the study. The land suitability criteria considered in this study include the following: digital elevation model of the terrain, exclusion of protected areas, 20 km proximity to the power grid system, and population or customer density within the regions as shown in . The digital elevation model or the elevation data was used to estimate the actual air density of the location as shown in Equation (7). And the grid network and the population density datasets were used to estimate the green hydrogen generation capacities within a 20 km grid proximity buffer for grid connection or utility-scale system (Asare-Addo Citation2022; Ghana – Action Plan for Sustainable Energy for All by Citation2030), as well as to estimate the number of potential grid customers within the region.
Figure 3. Geospatial data inputs for the land suitability analysis: a. Elevation map; b. Population density map; c. restricted areas; d 20 km buffer distance around grid network.
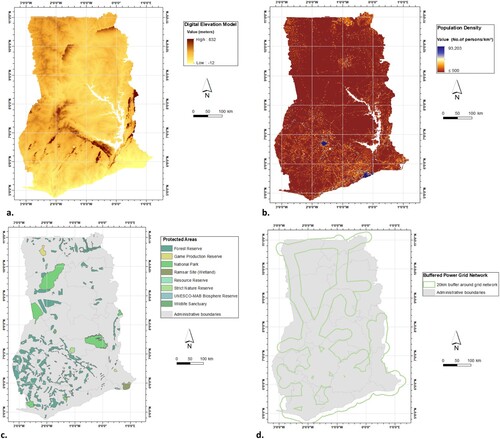
The Boolean method (0,1) in the GIS environment was used to delimit suitable sites and restricted or excluded areas. Thus, all restricted areas were assigned the value 0 and 1 for all suitable areas. Further details of the Boolean concept can be found here (Esri Citation2016). To assess the geographical potential, the following formula was adopted (Mary Citation2021):
(1)
(1) where
is the land suitability for siting the green hydrogen plant;
is the Boolean weight for the suitability criteria;
is the suitability criteria; and
is the area restriction criteria.
2.3. Technical potential assessment
The technical potential basically refers to the amount of green hydrogen that the solar and wind conversion systems can generate over the power plants lifetime given the solar and wind resources as shown in and . This also includes for this study, the amount of hydrogen mass that the power plants can produce given the geographical potential or the available land area. The production of green hydrogen from the solar PV and the wind turbine required two separate methods. First was to estimate the amount of energy that the solar (SECS) and wind (WECS) conversions systems or power plants can generate. shows the input specifications used for the technical potential modelling. The next step was to estimate the amount of hydrogen () that the electrolyser conversion system can produce given the energy generated by the solar and wind power plants. In addition, the study also estimated the impact of spacing factor in the overall generation capacities of the green hydrogen power plant, as shown in and .
Table 1. Technical specifications for the green hydrogen modelling.
Table 2. Summary statistics for the solar-based green hydrogen analysis.
Table 3. Summary statistics for the wind-based green hydrogen analysis.
2.3.1. Solar energy technical potential
2.3.1.1. Solar energy from the conversion system (SECS)
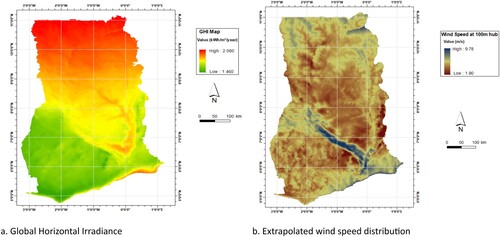
Firstly, the solar energyFootnote2 generation capacity for all locations at the regional level were estimated. This was done to quantify the amount of solar energy that the selected solar PV module can generate. The solar radiation of the location as well as specifications of the solar PV module were used to compute the total solar energy potential of a location (see ). The annual average solar irradiance in Ghana and as visualised in ranges from 1 460 kWh/m²/year to 2 080 kWh/m²/year from the bilinear resampling technique used. The data was downloaded from the global solar atlas platform (Global Solar Atlas Citation2023). A monocrystalline PV module was used because of its maturity on the solar market as well as its high efficiency compared to the other solar modules (Gaur and Tiwari Citation2013; IEA Citation2023). Several methods have been used in the literature to estimate the technical energy potential of a PV module, examples include (Asare-Addo Citation2022; Bhandari Citation2022; Dagdougui, Ouammi, and Sacile Citation2011; Gerbo, Suryabhagavan, and Raghuvanshi Citation2022; Koko Citation2022; Leiblein et al. Citation2021; Okunlola, Davis, and Kumar Citation2022; Rahmouni et al. Citation2016; Sunarso et al. Citation2020; Touili et al. Citation2018). The methods applied are generally dependent on the aim and scope of the research, other studies have included other PV specifications and requirements in the PV technical potential assessment such the derating factor, and the capacity factor which could significantly affect results of the analysis. For this study, a spacing factor for the solar PV was introduced into the model to account for instances where spacing is required. The spacing assumptions used for the solar PV system generally ranges from 1.4 to 5 as applied in the African region (Asare-Addo Citation2022; International Renewable Energy Agency Citation2014; Yushchenko et al. Citation2018). For this study, the below formula was used to estimate the total solar energy capacities by the selected PV module (Berrada and Laasmi Citation2021; Touili et al. Citation2018):
(2)
(2) With spacing factor:
(3)
(3) where
is the total solar energy technical potential from the PV module in GWh/km²/year.
is the annual solar irradiance in kWh/m²/year;
is the PV efficiency (%), and
is the power conditioning efficiency used to shape and condition the solar energy produced by the PV plant (%), and
is the spacing factor, here a spacing factor of 2 was applied.
Figure 4. Visualisation of the solar irradiance and wind speed distribution.
2.3.1.2. Solar energy to hydrogen: the water electrolysis modelling
The electricity generated by the PV plant then undergoes the water electrolysis process. There are different types of water electrolysis technologies, which are the alkaline and the Proton Exchange Membrane (PEM) electrolysers. For this study the PEM electrolyser system was used due to its high life cycle, efficiency and compatibility with the variability of electricity generated from renewable sources (Alshehri et al. Citation2019; Ayodele and Munda Citation2019; Nematollahi et al. Citation2019; Okunlola, Davis, and Kumar Citation2022). Moreso, due to the hydrogen pressure of 1.2 bar, hydrogen produced from PEM electrolyser do not require compression and can be stored directly or linked to a pipeline (Dagdougui, Ouammi, and Sacile Citation2011; Touili et al. Citation2018). The PEM electrolyser used is assumed to consume about 54 kWh (power capacity) of energy to produce 1 kg of hydrogen, with higher heating value (HHV) of 39.4 kWh/kg and with 75% efficiency and has the capacity to produce on the average, about 1 Ton per day (∼1000 kg/day). The assumptions, specifications and parameters used in the electrolysis process are based on the most widely used values for estimating the potential of green hydrogen from solar (Ali et al. Citation2022; Dagdougui, Ouammi, and Sacile Citation2011; Rahmouni et al. Citation2017; Touili et al. Citation2018; Yodwong et al. Citation2020) as shown in . The mass of green hydrogen using solar was estimated using the equation below (Ali et al. Citation2022; Boudries Citation2016; Gouareh et al. Citation2015; Messaoudi et al. Citation2019; Rahmouni et al. Citation2017; Touili et al. Citation2018):
(4)
(4)
is the mass of hydrogen produced from the solar energy conversion system
in tonnes/km²/year,
is the hydrogen electricity produced and required for the power plant in kWh/km²/year.
is the efficiency of the electrolysis system, and
is the hydrogen higher heating value in kWh/kg.
2.3.2. Wind energy technical potential
2.3.2.1. Interpolation of the wind speed distribution data
The wind speed distribution data used for this study was downloaded from the global wind atlas portal (Global Wind Atlas Citation2023) and was readjusted to a 1 km × 1 km resolution to ensure uniformity in the output of the assessment, i.e. to make sure the analysis is carried out at the same grid or cell size. Few interpolation techniques exist, but for this study the bilinear resampling method was used because of its suitability for continuous data like wind speed and the solar radiation data that has been measured and validated over a period of time. At a hub height of 100 m, wind speed distribution in the country ranges from ∼1.92 to ∼9.84 m/s.
2.3.2.2. Extrapolation of the wind speed hub height
Wind speed regime is recorded at various hub heights to provide insight into the choice of wind turbine to mount on site, either for a small-scale or commercial projects. Lower hub heights are generally ideal for small-scale projects due to the nominal wind speed values or potential. Wind speed at anemometer height of 100 m was used for this study. However, due to wind shear anomalies caused by atmospheric externalities such as variations in altitude, speed frequencies and the frictional effect of the earth surface, it is important to calibrate the wind speed to the hub of the chosen wind turbine for the specific locations to mount the wind turbine. Thus, to estimate the wind shear exponent (), the earth surface is assumed to be homogenous and was estimated using the power law model (Manwell, McGowan, and Rogers Citation2009):
(5)
(5)
is the wind velocity at the anemometer height
(at the lower height),
is wind velocity at the turbine height
(at the upper height), and
is the wind shear exponent which varies with altitude, time, and location. The wind shear value is determined by the terrain type or surface roughness and generally ranges between 0.1 and 0.4 (Liu et al. Citation2023). For this study, a surface roughness value of 0.03 was assumed given that the wind turbines will be mounted at open agricultural area with very scattered buildings. The extrapolated wind speed distribution thus ranges from 1.90 to 9.78 m/s as shown in .
2.3.2.3. Theoretical power of the wind speed
The amount of wind energy generated by the wind turbine depends on the wind power potential of the location. It is therefore important to estimate the theoretical wind power potential of the site. Computing the wind power at the grid cell level is conceptually challenging (Hoogwijk, de Vries, and Turkenburg Citation2004; Mary Citation2021) hence the kinetic energy derived from the wind which contains speed and air mass were used to estimate the wind power potential which is referred to as the wind power density (WPD). This was determined using the following equation:
(6)
(6)
is the potential wind power capacity of the wind (W/m²),
is the air density (kg/m³), and
is the wind speed value (m/s) recorded in
period of time. It is however important to mention that, for this study, unlike as used in many other studies, the air density is not equal to 1.225 kg/m³ as generally assumed for all locations but rather the actual air density value was estimated for each location considering temperature variations (Asare-Addo Citation2022) (see ). Hence the ideal gas law which provides a more accurate estimation of the air density of a location above sea level was used. The ideal gas law is given as:
(7)
(7)
is the elevation of the location above sea level (m).
2.3.2.4. Machine power estimation: yield from the wind turbine
For the wind energy potential assessment, it is also crucial to assess the viability of the site to generate a substantial amount of energy which is generally based on the wind regime and the wind turbine used. Hence, it is imperative to evaluate the wind regime of a location to be able to select the best turbine for optimal capacity generation of the green hydrogen from wind. Based on the onshore wind speed regime of Ghana as visualised in , a wind turbine within IEC class III or IV will be appropriate. Hence the NREL 1000 kW (1MW) distributed wind turbine was used for this simulation (Bhaskar and Stehly Citation2021). The turbine has a conducive cut-inFootnote3 wind speed of 3 m/s, and a cut-outFootnote4 wind speed of 25 m/s, with a rotor diameter of 77 m and 80 m hub height (Bhaskar and Stehly Citation2021; Lantz et al. Citation2016). This turbine was selected not only because of the wind speed requirements but also due to its power curve that could be utilised not only for residential purposes but also a potential model for commercial wind farm projects. The first step therefore was to estimate the energy yield by the turbine given the suitable land areas. It is important to mention that computation of the energy potential of local winds is complex due to the wide variations in the wind speed characteristics of the different locations (Mary Citation2021) – thus, the machine energy outputs are approximated values. As discussed earlier, the wind characteristics of any given wind regime can be well-defined based on the wind distribution. To determine this, there are currently two widely used probability methods used to estimate the wind speed distribution of a location to help in the selection of a well-fit turbine to install on the site; the Rayleigh and the Weibull distribution functions. These methods are used to determine the power densities of locations which in turn are used to estimate the energy output generated by the wind turbine. These two methods differ in the sense that, the Rayleigh distribution function applies only the mean windspeed values whereas the Weibull uses both the mean windspeed and standard deviation values of the wind regime. For this study and a review of the literature show that, the Weibull function provides the best-fit for the wind speed distribution in Ghana (Mary Citation2021). The Weibull function is given as:
(8)
(8)
(9)
(9)
(10)
(10)
(11)
(11)
is the shape factor and falls within the range of
,
is the scale factor and can be solved by substituting Equation (11) into Equation (12) and which also requires the gamma function,
.
and
are both functions of the mean wind speed
; and the standard deviation,
.
is the windspeed value.
(12)
(12)
The next step then was to determine the wind energy output per location by the chosen wind turbine. This was estimated using the power curve of the turbine. For a given wind regime, expressed as the probability density function ,
which is the actual mean available energy output generated by the wind turbine can be estimated given the following equation (Manwell, McGowan, and Rogers Citation2009):
(13)
(13)
(14)
(14)
2.3.2.5. Estimation of the capacity factor 
The capacity factor of a wind turbine plays a crucial role in selecting the appropriate wind turbine for a given location. It also provides insight into the economic viability of the wind project sites (Ayodele and Munda Citation2019). The
can be expressed as ratio of the actual average power output of the turbine (
) to the rated power output of the turbine (
) over a time period
; where time period is the number of hours in a full year (i.e. 8760 hours/year). The wind turbine capacity factor can thus be estimated by (Manwell, McGowan, and Rogers Citation2009):
(15)
(15) Thus, for a conventional wind turbine, under a steady incoming wind, the mechanical average wind energy that can be extracted from the turbine rotor can be estimated by (Manwell, McGowan, and Rogers Citation2009; Simpson and Loth Citation2022):
(16)
(16)
is the power extracted by the turbine rotor,
is the rotor swept area (m²) which is
(
is the rotor diameter (m), and
),
is the maximum power coefficient of the turbine; with a dimensionless theoretical value of 0.59 known as the Betz limit (Manwell, McGowan, and Rogers Citation2009).
2.3.2.6. Wind energy from the conversion system (WECS)
The wind energy conversion system usually consists of the wind turbine, the gearbox, the electrical generator, the power electronic convertor, and the water electrolysis system (Ayodele and Munda Citation2019; Dagdougui, Ouammi, and Sacile Citation2011; Okunlola, Davis, and Kumar Citation2022; Olateju, Kumar, and Secanell Citation2016). For the wind energy to hydrogen production, the PEM electrolysis system was used and requires a DC electrical energy capacity of 54 kWh to produce 1 kg of hydrogen. The gearbox is usually used to increase the rotational speed of low-speed turbine rotor to a higher speed electrical generator (Ayodele and Munda Citation2019; Ayodele and Ogunjuyigbe Citation2015; Okunlola, Davis, and Kumar Citation2022). The use of the gearbox is also particularly important due to variations in the wind speed distribution across the project sites and considering the use of the same turbine model. In addition, a turbine spacing factor was introduced in this model to minimise the effect of turbulence and to ensure that all the turbines mounted will receive an appreciable amount of the wind speed on a km² of land by increasing the rotor swept area radius. By rule of thumb, turbine spacing is generally 3–5 rotors diameter apart and 5–9 rotor diameter between the rows (Gupta Citation2016). A 3× rotor diameter spacing within the turbines was considered for this study. The electrical energy potential of a typical wind energy conversion system can therefore be estimated using the following model (Ayodele and Munda Citation2019):
(17)
(17) With spacing factor:
(18)
(18)
(19)
(19)
is the total wind energy technical potential extracted from the wind conversion system (GWh/km²/year),
is the gearbox transmission efficiency,
is the generator efficiency, and
is the increased rotor diameter factor. Please note that
already includes rotor diameter exponent one. Thus, the turbine swept area is extended by two rotor diameter.
2.3.2.7. Wind energy to hydrogen: the water electrolysis modelling
To extract and determine the amount of hydrogen that the turbine can generate, the wind energy conversion system was made to go under a water electrolysis using the PEM electrolyser. The electrolysis system for the green hydrogen using wind consists of the extracted wind energy (i.e. wind turbine, the gearbox, and the electrical generator) as well as a AC–DC rectifier to convert the AC voltage of the energy produced by the turbine to a DC voltage output suitable for the electrolyser to operate and also conducive for storage of the hydrogen in high-pressure tanks (Almutairi et al. Citation2022; Ayodele and Munda Citation2019). The potential amount of hydrogen that can be produced from the system was modelled using the following equation:
(20)
(20)
3. Results
This section presents the results of the study. It includes the results of the geographical potential and the technical potential assessment for the two selected green hydrogen systems. Please note that the results of the technical hydrogen potentials are based on the SECS and WECS estimates. Results of the analysis are presented and visualised based on a 1 km² grid resolution at the national and regional levels in Ghana. Finally, the study also tried to provide an assessment highlighting the potential of green hydrogen for a grid-connected or utility-scale system given the grid connection policy in the country (Asare-Addo Citation2022; Ghana – Action Plan for Sustainable Energy for All by 2030, Citation2012, ‘SE4ALL-GHANA ACTION PLAN’ 2012), and potential grid-connection customers.
3.1. Geographical potential
Results based on the evaluation of sites for mounting the two green hydrogen power plants have been discussed here. The main purpose of this assessment was to identify suitable sites that will maximise the green hydrogen production while protecting conservation sites. Therefore, all areas that were not socially and environmentally conducive to site the power plants were completely excluded from the analysis. The exclusion criterion was based mainly on the areas occupied by protected zones and that accounted for about 14.55% of total land area, as shown in the summary statistics ( and ). This also shows that based on the recent administrative boundary data used for this study (OCHA & Humanitarian Data Exchange Citation2021), out of the ∼239,429 km² of Ghana’s total land area, ∼85% is suitable for the production of green hydrogen using solar and wind. The Greater Accra region which is the capital of Ghana even though has the smallest total land area (∼3698.86 km²) has the largest geographical potential of 96.45% for the green hydrogen production. Followed by the Northern region with a geographical potential of 95.95% for both the production of green hydrogen from solar and wind. The Greater Accra region is also the most densely populated region. and show maps of study results with the restricted areas.
3.2. Technical potential: results from the conversion systems
3.2.1. Solar-based green hydrogen potential
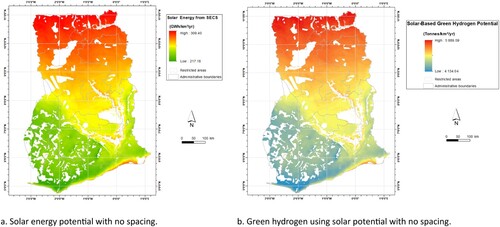
In this section, the results of the solar energy generated by the solar PV conversion system (SECS) as well as for the electrolysis process are discussed. Green hydrogen using solar basically refers to the production of green hydrogen using the energy generated by the SECS through water electrolysis process with an electrolyser technology. shows maps of the solar energy potential from the SECS as well as with the corresponding green hydrogen from solar generation capacities with no spacing factor considerations. also provides summary statistics for the green hydrogen using solar assessment including generation capacities across the regions for the solar PV plant with and without spacing factor considerations. As visualised in and shown in , each region shows varying generation capacities for both the SECS and for the green hydrogen using solar, which also depicts a direct correlation between the solar intensity or irradiance of the location. The Upper West region recorded the highest solar radiation intensity of 2 080 kWh/m²/year with corresponding SECS and green hydrogen using solar generation capacities of ∼309.40 GWh and ∼5889.59 Tonnes/year without spacing per km², respectively. However, the region with the largest green hydrogen using solar potential is the Savannah region, with a total generation capacity of 1993.79 Mt per year, and about 996.90 Mt/year with spacing considerations. The lowest generation capacity was recorded in the Ahafo region, with a total of 247.19 Mt/year without spacing, and ∼123.60 Mt/year with the PV plant spacing, and a maximum SECS energy output of ∼266.26 GWh. Nationally, and with respect to the geographical potential, a total of ∼14,196.21 Mt of green hydrogen using solar can be produced annually in the country without spacing and ∼7098.11 Mt/year when spacing factor is considered. Please note that the Ahafo region is however not the smallest region per total land area (see ).
Figure 5. Solar energy potential from the SECS with corresponding green hydrogen production using solar with no spacing factor.
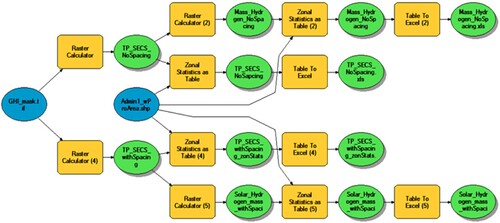
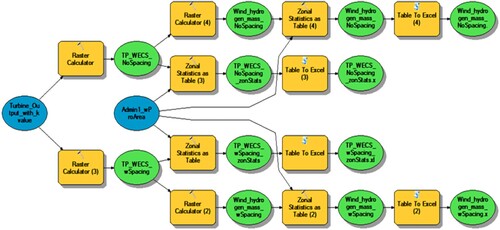
also shows the geospatial model used to compute the solar-based green hydrogen technical potential. The model consists of four geo-processes. As mentioned earlier, the production of green hydrogen using solar involves two separate processes, the first process was to estimate the amount of solar energy that can be generated from the solar PV conversion system (TP_SECS) using the raster calculator in ArcGIS for the calculations, and the next process was to run the extracted solar energy through the electrolyser system to produce the green hydrogen (Mass_Hydrogen). Also as shown in (Equation 3), a spacing factor was also included to estimate how much potential can be generated when spacing of the solar PV module is considered. The spacing was only considered during the TP_SECS estimation which in effect also affected the amount of green hydrogen that can be produced by the electrolyser system.
Figure 6. Solar-based green hydrogen technical potential model.
3.2.2. Wind-based green hydrogen potential
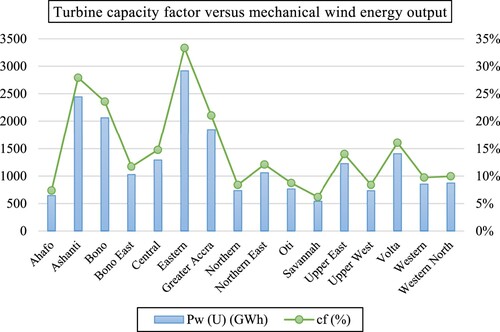
This section also presents and explains the results of the wind energy generated by the wind turbine conversion system (WECS) as well as for the electrolysis process. Green hydrogen using wind refers to the process of using the wind energy supplied by the WECS to produce hydrogen mass using an electrolyser technology and through the process known as electrolysis – process of using the renewable energy or electricity to split water into hydrogen and oxygen, while emitting zero-carbon dioxide in the process. Here also, results of the assessment show varying technical potentials across the regions, which also show a direct correlation with the wind speed class. The results have been presented in and in the summary statistics , including the WPD and the air density estimations used in computing the mechanical energy output generated by the wind turbine. At the national level, a total of ∼10,123.36 Mt of green hydrogen using wind can be produced annually with no spacing consideration and about 65.74 Mt/year with consideration to the impact of spacing the wind turbines per suitable or available land area. At the regional level, and with regards to only the technical potential, the Eastern region recorded and showed the most favourable location, with a generation capacity of about 2353.74 GWh from the WECS and 40,324.30 Tonnes/km²/year and a total capacity of ∼881.49 Mt/year of green hydrogen using wind – all without spacing factor, given the maximum extrapolated wind speed value of 9.78 m/s. Additionally, given spacing considerations, the region could generate a total of ∼5.72 Mt/year given the geographical potential. The Savannah region on the other hand recorded the lowest wind energy and green hydrogen given the wind energy generation capacities with no spacing. With a maximum wind speed of 5.89 m/s, the region generated about 437.11 GWh from the WECS. With spacing constraints, the Northern region recorded the largest potential of about 1298.41 Mt/year. Correspondingly, and as mentioned earlier the capacity factor of the turbine provides a valuable insight into potential areas for investment as well as areas where production could be optimised. As shown in , the Eastern region has the highest turbine capacity factor of about 33% and one of the favourable locations for wind-based green hydrogen projects, followed by the Ashanti region with a capacity factor of 28%. The Savannah region recorded the lowest capacity factor of 6% due to the relatively low wind speed regime of the location compared to other regions in the countries.
Figure 7. Wind energy potential from the WECS with corresponding hydrogen production with no spacing factor.
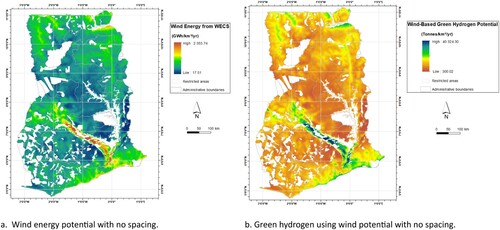
Figure 8. The wind turbine capacity factor with corresponding wind energy generated per region.
shows the geospatial model used to compute the wind-based green hydrogen technical potential. The model consists of four geo-processes. As mentioned earlier, the production of green hydrogen using wind involves two separate processes, the first process was to estimate the amount of wind energy that can be generated from the wind turbine conversion system (TP_WECS) using the raster calculator in ArcGIS for the calculations, and next process was to run the extracted wind energy through the electrolyser system to produce the green hydrogen (Wind_hydrogen_mass). Also as shown in (Equation 18), a spacing factor was also included to estimate how much potential can be generated when spacing of the wind turbine is considered. The spacing was only considered during the TP_WECS estimation which in effect also affected the amount of green hydrogen that can be produced by the electrolyser system.
Figure 9. Wind-based green hydrogen technical potential model.
3.2.3. Potential for utility-scale system
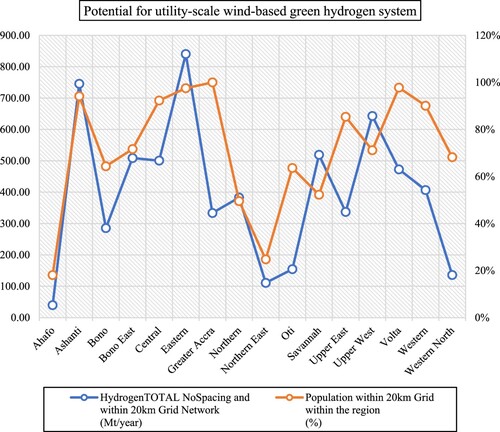
Further, the study also tried to assess the viability of the green hydrogen project for a grid-connected or utility-scale system within the region. This was done by quantifying the generation capacities of the green hydrogen produced within a 20 km grid distance from the central power grid network, including the customer demand capacities within the 20 km grid distance by estimating the total number of people that live in this proximity distance within the region. As earlier discussed, this is in fulfilment of one of the key requirement for grid-connected system by the national electrification policy or standard of practice in Ghana (Asare-Addo Citation2022; Ghana – Action Plan for Sustainable Energy for All by 2030, Citation2012, ‘SE4ALL-GHANA ACTION PLAN’ 2012). The aim of this analysis is also to provide an overview of potential areas for green hydrogen project investment as well as to encourage renewable energy integration and diversification in the country’ energy mix – that which is currently and predominantly fossil-based (Asare-Addo Citation2022; Energy Commission of Ghana Citation2020; Mary Citation2021; Odoi-Yorke et al. Citation2023). As shown in and as well as and , the Greater Accra region has the highest energy demand customer base (100%) within the 20 km proximity threshold compared to the other regions and thus economically prudent to provide grid electrification to communities in this region. However, in terms of the green hydrogen generation capacities, the Upper West region had the largest capacity of ∼719.93 Mt/year for the solar-based green hydrogen production without spacing considerations and about 71% of its population live within the potential for grid connection threshold (see ). For the wind-based green hydrogen, the Eastern region still has the largest generation capacity of ∼519.10 Mt/year with no spacing given the 20 km utility-scale distance threshold and has 98% of its population eligible for grid electrification as shown in . This therefore presents policy makers in Ghana with two sustainable energy intervention options: (i) the decision to prioritise investment in areas with larger generation capacities or, (ii) to prioritise investment in areas with higher energy demand customer base.
Figure 10. Potential for utility-scale solar-based green hydrogen.
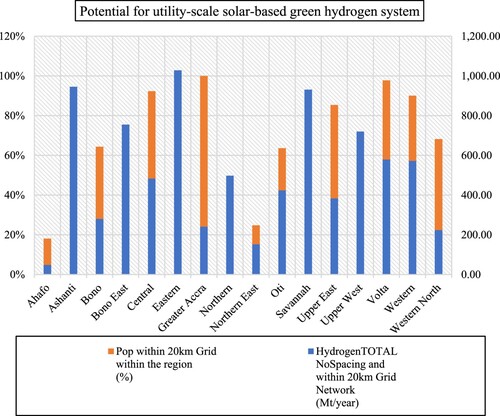
Figure 11. Potential for utility-scale wind-based green hydrogen.
4. Discussion
As the global call to decarbonise energy systems continues and to help limit global warming to 1.5°C heightens (IPCC Citation2018), it has become increasingly important for governments to explore all sustainable alternative sources of energy available, which also includes the use of clean technologies in the production processes. The present study thus explores the potential of green hydrogen production in Ghana using solar and wind energy. The study applied the use of GIS techniques and PEM electrolysis process to assess the potential of the two selected renewable energy resources. This was done by first estimating the geographical potential which was to determine the area of land that were suitable and environmentally conducive to site the green hydrogen power plants. The Boolean method was applied in the GIS environment to delineate the suitable areas from restricted/ unsuitable areas. Thus, from the geographical potential evaluation, about 85% of the country’s land area is ideal for green hydrogen production using solar and wind. Followed by the technical potential assessments of renewable resources used by first estimating the amount of energy that the conversion systems could generate from the solar PV power plant and from the wind turbine before converting the generated energy into green hydrogen through the water electrolysis process – a process which involves splitting water into hydrogen and oxygen, while emitting zero-carbon dioxide into the atmosphere. Results of the analysis show varying potentials across the various regions in Ghana. The assessment included estimating the amount of green hydrogen that the available land can produce with and without power plant spacing constraints. The present study went a step further to assess the potential of the green hydrogen power plants for a utility-scale or grid-connected systems, including an estimation of potential grid customers that could be serviced from the utility-scale green hydrogen power plants within each region in the country based on the 20 km distance from the grid network requirement for grid electrification as practiced in the country (Asare-Addo Citation2022; Ghana – Action Plan for Sustainable Energy for All by 2030, Citation2012, ‘SE4ALL-GHANA ACTION PLAN’ 2012), for which the Greater Accra region has the largest green hydrogen-grid customers (100%), and the lowest in the Ahafo region with ∼18% potential green hydrogen-grid customers. The aim of the utility-scale assessment was to provide insight into potential areas for investment. For green hydrogen using solar, the Savannah region showed the largest generation capacity of ∼1993.79 Mt/year. For the production of green hydrogen using wind, the Eastern region showed the most favourable location for green hydrogen projects using wind as the region recorded the highest capacity factor of 33%, and with a generation capacity of about ∼40,324.30 Tonnes/km²/year while the Northern region recorded the largest potential of about 1298.41 Mt/year due to its geographical potential. Nationally, a total of ∼10,123.36 Mt of green hydrogen using wind can be produced annually with no spacing consideration and about 65.74 Mt/year when the wind turbines are spaced out given the geographical potential. For green hydrogen using solar, a total of ∼14,196.21 Mt can be produced annually in the country without spacing and ∼7098.11 Mt/year when spacing factor is considered.
5. Conclusion
The present study explored the potential of producing green hydrogen using solar and wind in Ghana by estimating the generating capacities at the national and regional levels in the country. Even though the country as at the end of 2022 does not have a hydrogen energy policy or any existing hydrogen initiative, opportunity to harness green hydrogen as part of the country’s effort towards decarbonisation exist and even on a commercial base for export. Results of the assessment show that Ghana has good potential for green hydrogen production. A geographical and technical potential assessments were carried out for the two green hydrogen source by excluding all protected areas or conservation sites from the assessment. The remaining land areas were then estimated to determine how much land area is available regionally for the green hydrogen project. Results of the analysis show that, out of ∼239,428.99 km² total land area of the country, 85% is conducive for the selected green hydrogen sources. With the technical potential, the country can produce ∼14,196.21 Mt of green hydrogen using solar per annum, and ∼10,123.36 Mt/year of green hydrogen from wind.
From the assessment, it could be seen that areas with higher solar-based green hydrogen capacities were mainly recorded in the northern part of the country which presents a great opportunity even for grid-connected systems. However, the population densities in certain part of these regions may not meet the criteria for on-grid electrification and thus the decision to explore large-scale green hydrogen using solar especially, lies with the government which may require a revision of the NES to incorporate priority projects for large-scale deployment.
Integration of renewable energy into the power grid remains a challenge, therefore further research is needed on how to build grid resilience and its ability to transmit the green hydrogen to the residential end-user. Also, further studies on the implementation potential as well as how social conditioning of the location could impact the green hydrogen projects will be valuable.
Acknowledgements
The author would like to thank this journal and its anonymous reviewers for peer-reviewing this paper. Special thanks to my academic supervisors for their guidance. Also grateful to family and friends for their continuous support and encouragement. Credit author statement: This article was independently written by the author. All datasets used in the study are open-sourced and have duly been referenced. The ArcGIS software licence used for this study was provided by the University of Flensburg.
Disclosure statement
No potential conflict of interest was reported by the author(s).
Correction Statement
This article has been corrected with minor changes. These changes do not impact the academic content of the article.
Additional information
Funding
Notes
1 Million tonnes.
2 Energy and electricity have been used interchangeably in this study to refer to same.
3 Wind speed cut-in is the point at which the turbine starts producing electricity from turning.
4 Wind speed cut-out is the maximum wind speed at which the turbine gets so fast and stands the risk of damage from operating further.
References
- Acakpovi, A., P. Adjei, N. Y. Asabere, R. A. Sowah, and D. M. Sackey. 2021. “Techno-Economic Evaluation of Hydrogen Fuel Cell Electricity Generation Based on Anloga (Ghana) Wind Regime.” International Journal of Energy Optimization and Engineering (IJEOE) 10 (3): 47–69. https://doi.org/10.4018/IJEOE.2021070103.
- Al-Orabi, A. M., M. G. Osman, and B. E. Sedhom. 2023. “Evaluation of Green Hydrogen Production Using Solar, Wind, and Hybrid Technologies Under Various Technical and Financial Scenarios for Multi-Sites in Egypt.” International Journal of Hydrogen Energy. https://doi.org/10.1016/j.ijhydene.2023.06.218.
- Ali, F., A. Bennui, S. Chowdhury, and K. Techato. 2022. “Suitable Site Selection for Solar-Based Green Hydrogen in Southern Thailand Using GIS-MCDM Approach.” Sustainability 14 (11): 6597. https://doi.org/10.3390/su14116597.
- Almutairi, K., S. S. Hosseini Dehshiri, S. J. Hosseini Dehshiri, A. Mostafaeipour, and K. Techato. 2022. “An Economic Investigation of the Wind-Hydrogen Projects: A Case Study.” International Journal of Hydrogen Energy 47 (62): 25880–25898. https://doi.org/10.1016/j.ijhydene.2022.05.070.
- Alrabie, K., and M. N. Saidan. 2018. “A Preliminary Solar-Hydrogen System for Jordan: Impacts Assessment and Scenarios Analysis.” International Journal of Hydrogen Energy 43 (19): 9211–9223. https://doi.org/10.1016/j.ijhydene.2018.03.218.
- Alshehri, F., V. G. Suárez, J. L. Rueda Torres, A. Perilla, and M. A. M. M. van der Meijden. 2019. “Modelling and Evaluation of PEM Hydrogen Technologies for Frequency Ancillary Services in Future Multi-Energy Sustainable Power Systems.” Heliyon 5 (4): e01396. https://doi.org/10.1016/j.heliyon.2019.e01396.
- Asare-Addo, M. 2022. “Optimal Techno-Economic Potential and Site Evaluation for Solar PV and CSP Systems in Ghana. A Geospatial AHP Multi-Criteria Approach.” Renewable Energy Focus 41:216–229. https://doi.org/10.1016/j.ref.2022.03.007.
- Ayodele, T. R., and J. L. Munda. 2019. “Potential and Economic Viability of Green Hydrogen Production by Water Electrolysis Using Wind Energy Resources in South Africa.” International Journal of Hydrogen Energy 44 (33): 17669–17687. https://doi.org/10.1016/j.ijhydene.2019.05.077.
- Ayodele, T. R., and A. S. O. Ogunjuyigbe. 2015. “Wind Energy Resource, Wind Energy Conversion System Modelling and Integration: A Survey.” International Journal of Sustainable Energy 34 (10): 657–671. https://doi.org/10.1080/14786451.2013.855778.
- Ball M, Weeda M. 2015. The Hydrogen Economy – Vision or Reality? International Journal of Hydrogen Energy. 40 (25):7903–7919. https://doi.org/10.1016/j.ijhydene.2015.04.032.
- Ballo, A., K. K. Valentin, B. Korgo, K. O. Ogunjobi, S. N. Agbo, D. Kone, and M. Savadogo. 2022. “Law and Policy Review on Green Hydrogen Potential in ECOWAS Countries.” Energies 15 (7): 2304. https://doi.org/10.3390/en15072304.
- Berrada, A., and M. A. Laasmi. 2021. “Technical-Economic and Socio-Political Assessment of Hydrogen Production from Solar Energy.” Journal of Energy Storage 44:103448. https://doi.org/10.1016/j.est.2021.103448.
- Bhandari, R. 2022. “Green Hydrogen Production Potential in West Africa – Case of Niger.” Renewable Energy 196:800–811. https://doi.org/10.1016/j.renene.2022.07.052.
- Bhaskar, P., and T. Stehly. 2021. Technology Innovation Pathways for Distributed Wind Balance-of-System Cost Reduction. Golden, CO: National Renewable Energy Lab. (NREL). NREL/TP-5000-77452. https://www.osti.gov/biblio/1776704/.
- Boudries, R. 2016. “Techno-economic Assessment of Solar Hydrogen Production Using CPV-Electrolysis Systems.” Energy Procedia 93:96–101. https://doi.org/10.1016/j.egypro.2016.07.155.
- Dagdougui, H., A. Ouammi, and R. Sacile. 2011. “A Regional Decision Support System for Onsite Renewable Hydrogen Production from Solar and Wind Energy Sources.” International Journal of Hydrogen Energy 36 (22): 14324–14334. https://doi.org/10.1016/j.ijhydene.2011.08.050.
- Energy Commission of Ghana. 2019. Ghana Renewable Energy Master Plan.
- Energy Commission of Ghana. 2020. National Energy Statistics: 2000 - 2019.
- Energy Commission of Ghana. 2021. Energy Outlook for Ghana: Demand and Supply Outlook. 2021.
- Esri. 2016. Boolean Or – Help | ArcGIS for Desktop. January 26, 2016. Accessed March 1, 2023. https://desktop.arcgis.com/en/arcmap/10.3tools/spatial-analyst-toolbox/boolean-or.htm.
- Esteves, N. B., A. Sigal, E. Leiva, C. R. Rodríguez, F. Cavalcante, and L. C. de Lima. 2015. “Wind and Solar Hydrogen for the Potential Production of Ammonia in the State of Ceará – Brazil.” International Journal of Hydrogen Energy 40 (32): 9917–9923. https://doi.org/10.1016/j.ijhydene.2015.06.044.
- Gallardo, F. I., A. Monforti Ferrario, M. Lamagna, E. Bocci, D. Astiaso Garcia, and T. E. Baeza-Jeria. 2021. “A Techno-Economic Analysis of Solar Hydrogen Production by Electrolysis in the North of Chile and the Case of Exportation from Atacama Desert to Japan.” International Journal of Hydrogen Energy 46 (26): 13709–13728. https://doi.org/10.1016/j.ijhydene.2020.07.050.
- Gaur, A., and G. N. Tiwari. 2013. “Performance of Photovoltaic Modules of Different Solar Cells.” Journal of Solar Energy 2013: 1–13. https://doi.org/10.1155/2013/734581.
- Genç, G., M. Çelik, and M. S. Genç. 2012. “Cost Analysis of Wind-Electrolyzer-Fuel Cell System for Energy Demand in Pınarbaşı-Kayseri.” International Journal of Hydrogen Energy 37 (17): 12158–12166. https://doi.org/10.1016/j.ijhydene.2012.05.058.
- Gerbo, A., K. V. Suryabhagavan, and T. K. Raghuvanshi. 2022. “GIS-Based Approach for Modeling Grid-Connected Solar Power Potential Sites: A Case Study of East Shewa Zone, Ethiopia.” Geology, Ecology, and Landscapes 6 (3): 159–173. https://doi.org/10.1080/24749508.2020.1809059.
- Action Plan for Sustainable Energy for All by 2030, 2012, ‘SE4ALL-GHANA ACTION PLAN’, viewed 5 April 2023, from http://energycom.gov.gh/files/SE4ALL-GHANA%20ACTION%20PLAN.pdf
- Global Solar Atlas. 2023. “Global Solar Atlas 2.0, a free, web-based application is developed and operated by the company Solargis s.r.o. on behalf of the World Bank Group, utilizing Solargis data, with funding provided by the Energy Sector Management Assistance Program (ESMAP). For additional information.” February 28, 2023. Accessed 29 March, 2023. https://globalsolaratlas.info/map?c=7.972198,-1.032715,7&r=GHA.
- Global Wind Atlas. 2023. Global Wind Atlas 3.0, a free, web-based application developed, owned and operated by the Technical University of Denmark (DTU). The Global Wind Atlas 3.0 is released in partnership with the World Bank Group, utilizing data provided by Vortex, using funding provided by the Energy Sector Management Assistance Program (ESMAP). For additional information. October 3. Accessed March 10, 2023. https://globalwindatlas.info/en/area/Ghana.
- Gouareh, A., N. Settou, A. Khalfi, B. Recioui, B. Negrou, S. Rahmouni, and B. Dokkar. 2015. “GIS-Based Analysis of Hydrogen Production from Geothermal Electricity Using CO2 as Working Fluid in Algeria.” International Journal of Hydrogen Energy 40 (44): 15244–15253. https://doi.org/10.1016/j.ijhydene.2015.05.105.
- Gupta, N. 2016. “A Review on the Inclusion of Wind Generation in Power System Studies.” Renewable and Sustainable Energy Reviews 59:530–543. https://doi.org/10.1016/j.rser.2016.01.009.
- Herdem, M. S., D. Mazzeo, N. Matera, C. Baglivo, N. Khan, P. M. Congedo, and M. G. De Giorgi. 2023. “A Brief Overview of Solar and Wind-Based Green Hydrogen Production Systems: Trends and Standardization.” International Journal of Hydrogen Energy. https://doi.org/10.1016/j.ijhydene.2023.05.172.
- Hoogwijk, M., B. de Vries, and W. Turkenburg. 2004. “Assessment of the Global and Regional Geographical, Technical and Economic Potential of Onshore Wind Energy.” Energy Economics 26 (5): 889–919. https://doi.org/10.1016/j.eneco.2004.04.016.
- IEA (International Energy Agency). 2021. Global Hydrogen REVIEW 2021.
- IEA (International Energy Agency). 2023. “Solar PV – Analysis - IEA.” August 2. Accessed February 8, 2023. https://www.iea.org/reports/solar-pv.
- International Renewable Energy Agency. 2014. Estimating the Renewable Energy Potential in Africa: A GIS-Based Approach. IRENA, viewed 18 July 2023, from https://www.irena.org/-/media/Files/IRENA/Agency/Publication/2014/IRENA_Africa_Resource_Potential_Aug2014.pdf.
- IPCC. 2018. Global Warming of 1.5°C. An IPCC Special Report on the impacts of global warming of 1.5°C above pre-industrial levels and related global greenhouse gas emission pathways, in the context of strengthening the global response to the threat of climate change, sustainable development, and efforts to eradicate poverty.
- Kakoulaki, G., I. Kougias, N. Taylor, F. Dolci, J. Moya, and A. Jäger-Waldau. 2021. “Green Hydrogen in Europe – A Regional Assessment: Substituting Existing Production with Electrolysis Powered by Renewables.” Energy Conversion and Management 228:113649. https://doi.org/10.1016/j.enconman.2020.113649.
- Karayel, G. K., N. Javani, and I. Dincer. 2022. “Green Hydrogen Production Potential for Turkey with Solar Energy.” International Journal of Hydrogen Energy 47 (45): 19354–19364. https://doi.org/10.1016/j.ijhydene.2021.10.240.
- Karayel, G. K., N. Javani, and I. Dincer. 2023. “Green Hydrogen Production Potential in Turkey with Wind Power.” International Journal of Green Energy 20 (2): 129–138. https://doi.org/10.1080/15435075.2021.2023882.
- Koko, S. P. 2022. “Optimal Battery Sizing for a Grid-Tied Solar Photovoltaic System Supplying a Residential Load: A Case Study Under South African Solar Irradiance.” Energy Reports 8:410–418. https://doi.org/10.1016/j.egyr.2022.02.183.
- Lantz, E., B. Sigrin, M. Gleason, R. Preus, and I. Baring-Gould. 2016. Assessing the Future of Distributed Wind: Opportunities for Behind-the-Meter Projects. Golden, CO: National Renewable Energy Lab. (NREL). NREL/TP-6A20-67337. https://www.osti.gov/biblio/1333625/.
- Leiblein, J., K. Bär, F. Graf, C. Hotz, and F. Mörs. 2021. “Techno-Economic Analysis of Green Hydrogen Production from Solar Energy in Mena and Transport to Central Europe.” International Solar Energy Society.
- Liu, B., X. Ma, J. Guo, H. Li, S. Jin, Y. Ma, and W. Gong. 2023. “Estimating Hub-Height Wind Speed Based on a Machine Learning Algorithm: Implications for Wind Energy Assessment.” Atmospheric Chemistry and Physics 23 (5): 3181–3193. https://doi.org/10.5194/acp-23-3181-2023.
- Mackenzie, W. 2019. “The Future for Green Hydrogen.” Accessed December 28, 2022. https://www.woodmac.com/news/editorial/the-future-for-green-hydrogen/.
- Manwell, J. F., J. G. McGowan, and A. L. Rogers. 2009. “Wind Energy Explained: Theory, Design and Application.” In Anthony Rogers, edited by J. F. Manwell and J. G. McGowan, 2nd ed., 33–65. Chichester: John Wiley.
- Mary, A.-A. 2021. “Geospatial Mapping of Micro-Wind Energy for District Electrification in Ghana.” Energy 225:120217. https://doi.org/10.1016/j.energy.2021.120217.
- Messaoudi, D., N. Settou, B. Negrou, and B. Settou. 2019. “GIS Based Multi-Criteria Decision Making for Solar Hydrogen Production Sites Selection in Algeria.” International Journal of Hydrogen Energy 44 (60): 31808–31831. https://doi.org/10.1016/j.ijhydene.2019.10.099.
- Nematollahi, O., P. Alamdari, M. Jahangiri, A. Sedaghat, and A. A. Alemrajabi. 2019. “A Techno-Economical Assessment of Solar/Wind Resources and Hydrogen Production: A Case Study with GIS Maps.” Energy 175:914–930. https://doi.org/10.1016/j.energy.2019.03.125.
- OCHA & Humanitarian Data Exchange. 2021. “Ghana - Subnational Administrative Boundaries.” Accessed 2023. https://data.humdata.org/dataset/cod-ab-gha.
- Odoi-Yorke, F., T. F. Adu, B. C. Ampimah, and L. Atepor. 2023. “Techno-Economic Assessment of a Utility-Scale Wind Power Plant in Ghana.” Energy Conversion and Management: X 18:100375. https://doi.org/10.1016/j.ecmx.2023.100375.
- Okonkwo, P. C., E. M. Barhoumi, I. B. Mansir, W. Emori, and P. C. Uzoma. 2022. “Techno-Economic Analysis and Optimization of Solar and Wind Energy Systems for Hydrogen Production: A Case Study.” Energy Sources, Part A: Recovery, Utilization, and Environmental Effects 44 (4): 9119–9134. https://doi.org/10.1080/15567036.2022.2129875.
- Okunlola, A., M. Davis, and A. Kumar. 2022. “The Development of an Assessment Framework to Determine the Technical Hydrogen Production Potential from Wind and Solar Energy.” Renewable and Sustainable Energy Reviews 166:112610. https://doi.org/10.1016/j.rser.2022.112610.
- Olateju, B., A. Kumar, and M. Secanell. 2016. “A Techno-Economic Assessment of Large Scale Wind-Hydrogen Production with Energy Storage in Western Canada.” International Journal of Hydrogen Energy 41 (21): 8755–8776. https://doi.org/10.1016/j.ijhydene.2016.03.177.
- Posso, F., J. Sánchez, J. L. Espinoza, and J. Siguencia. 2016. “Preliminary Estimation of Electrolytic Hydrogen Production Potential from Renewable Energies in Ecuador.” International Journal of Hydrogen Energy 41 (4): 2326–2344. https://doi.org/10.1016/j.ijhydene.2015.11.155.
- Posso, F., and J. Zambrano. 2014. “Estimation of Electrolytic Hydrogen Production Potential in Venezuela from Renewable Energies.” International Journal of Hydrogen Energy 39 (23): 11846–11853. https://doi.org/10.1016/j.ijhydene.2014.06.033.
- Rahmouni, S., B. Negrou, N. Settou, J. Dominguez, and A. Gouareh. 2017. “Prospects of Hydrogen Production Potential from Renewable Resources in Algeria.” International Journal of Hydrogen Energy 42 (2): 1383–1395. https://doi.org/10.1016/j.ijhydene.2016.07.214.
- Rahmouni, S., N. Settou, B. Negrou, and A. Gouareh. 2016. “GIS-based Method for Future Prospect of Hydrogen Demand in the Algerian Road Transport Sector.” International Journal of Hydrogen Energy 41 (4): 2128–2143. https://doi.org/10.1016/j.ijhydene.2015.11.156.
- Simpson, J. G., and E. Loth. 2022. “Super-rated Operational Concept for Increased Wind Turbine Power with Energy Storage.” Energy Conversion and Management: X 14:100194. https://doi.org/10.1016/j.ecmx.2022.100194.
- Sunarso, A., K. Ibrahim-Bathis, S. A. Murti, I. Budiarto, and H. S. Ruiz. 2020. “GIS-Based Assessment of the Technical and Economic Feasibility of Utility-Scale Solar PV Plants: Case Study in West Kalimantan Province.” Sustainability 12 (15): 6283. https://doi.org/10.3390/su12156283.
- Topriska, E., M. Kolokotroni, Z. Dehouche, D. T. Novieto, and E. A. Wilson. 2016. “The Potential to Generate Solar Hydrogen for Cooking Applications: Case Studies of Ghana, Jamaica and Indonesia.” Renewable Energy 95:495–509. https://doi.org/10.1016/j.renene.2016.04.060.
- Touili, S., A. Alami Merrouni, A. Azouzoute, Y. El Hassouani, and A. Amrani. 2018. “A Technical and Economical Assessment of Hydrogen Production Potential from Solar Energy in Morocco.” International Journal of Hydrogen Energy 43 (51): 22777–22796. https://doi.org/10.1016/j.ijhydene.2018.10.136.
- World Bank. 2023a. Access to Electricity (% of population) - Ghana | Data. July 4. Accessed April 7, 2023. https://data.worldbank.org/indicator/EG.ELC.ACCS.ZS?locations=GH.
- World Bank. 2023b. Tracking SDG 7 – The Energy Progress Report 2022. July 4. Accessed April 7, 2023. https://www.worldbank.org/en/topic/energy/publication/tracking-sdg-7-the-energy-progress-report-2022.
- Yodwong, B., D. Guilbert, M. Phattanasak, W. Kaewmanee, M. Hinaje, and G. Vitale. 2020. “AC-DC Converters for Electrolyzer Applications: State of the Art and Future Challenges.” Electronics 9 (6): 912. https://doi.org/10.3390/electronics9060912.
- Yushchenko, A., A. de Bono, B. Chatenoux, M. K. Patel, and N. Ray. 2018. “GIS-Based Assessment of Photovoltaic (PV) and Concentrated Solar Power (CSP) Generation Potential in West Africa.” Renewable and Sustainable Energy Reviews 81:2088–2103. https://doi.org/10.1016/j.rser.2017.06.021.
