
 ?Mathematical formulae have been encoded as MathML and are displayed in this HTML version using MathJax in order to improve their display. Uncheck the box to turn MathJax off. This feature requires Javascript. Click on a formula to zoom.
ABSTRACT
Many industrial facilities require large amount of power available through fossil energy, but in some countries the power is secured by hydroelectric power. Norway is one such country, but some facilities still use gas power due to hydroelectric power capacity limitations. Therefore, using wind- or nuclear power to cut emissions are relevant alternatives. Therefore, a concept and feasibility study using wind- or nuclear power at the single largest emitter of climate gases in Norway, Melkøya LNG (Liquified Natural Gas) terminal is presented. Due to the intermittency of the wind power, the balancing/back-up power must also be included. After running 10,000 trials in a Monte Carlo simulation to handle the uncertainties of the alternatives, the results support the Nuclear alternative. Future key issues are the cost escalations of wind turbines, the cost of balancing- and backup power for the Wind alternative and the waste handling for the Nuclear alternative.
Nomenclature
| Capacity | = | the ability to produce an effect, which in our context is measured in Watt, kW, MW or GW. |
| CAPEX | = | Capital expenditures; typically expressed in USD or in specific terms such as MW/USD. |
| Cogeneration | = | the capability of producing both electric energy and thermal energy at the same time. |
| Effect | = | the instantaneous ability to do work typically measured in Watt (W), kW (thousand W), MW (Million W) or GW (billion W). |
| Electric energy | = | energy in the shape of electricity. |
| Energy | = | effect produced over time, measured as Joule or in our context here, MWh (Million Watt hours) or kWh (thousand Watt hours). TWh is a million MWh or a thousand GWh. |
| FOAK | = | First of a kind; used when describing the prototype version of something concerning costs, construction time, etc. |
| LCOE | = | Levelised Cost of Energy; the probability weighted average life-cycle cost normally expressed as USD/MWh. |
| LNG | = | Liquified Natural Gas; natural gas that has been liquified through the liquefaction process. |
| LWR | = | Light Water Reactor, the most common type of nuclear reactors in operation today. |
| NOAK | = | Nth of a kind; used when describing the mature version of something concerning costs, construction time, etc. when much experience has been gathered. |
| OPEX | = | Operating expenditures; the expenses used on annual basis to keep something in operations. Typically expressed in the context of this paper as USD/MWh. |
| Terminal value | = | the rest value, measured in USD, of an investment at the end of the horizon included in the analysis. |
| Thermal energy | = | energy in the shape of heat or fuels (and not electricity). Converting thermal energy to electricity incur losses as dictated by the Second Law of Thermodynamics. |
1. Introduction
Both wind- and nuclear power are today predominantly providing electricity to the power system. Yet, nuclear cogeneration applications have a relatively long history, with nuclear cogeneration recording of over 750 reactor-years of experience in non-electric applications (mainly linked to district heating and desalination) (Rosen Citation2021). An early example is the Ågesta reactor, south of Stockholm, which produced 10 MW of electricity to the grid and between 50 and 70 MW of heat to the suburb ‘Farsta’ in Stockholm between 1964 and 1974 (The Royal Society Citation2020).
In 2020 there were 64 reactors in 10 countries that supplied approximately 3390 GW per hour of electric equivalent heat to support non-electric applications (Goetzke et al. Citation2022). For example, the Bruce-A nuclear station in Canada consists of four 825-MWe (electric MW) units that are generating electricity. Additionally, the plants supply steam to a transformer plant that generates 720 MWth (thermal MW) of process heat and steam for heavy water production plants; 70 MWth for the Bruce energy centre, and 3 MWth for side services (Barnert, Krett, and Kupitz Citation1991).
A typical nuclear power station produces around 3.4 GW of heat (∼100,000 domestic gas boilers), which is used to generate around 1.2 GW of electricity. Currently, around 65% of the energy is lost in the conversion as waste heat (The Royal Society Citation2020). Though less than 1% of the heat generated in nuclear reactors worldwide is currently used for district and process heating, there are signs of increasing interest in these applications (Csik and Kupitz Citation1997). The reasons are twofold. First, the current growth in population worldwide gives increased demand for energy. Second, the need to decarbonise the economy has led governments around the world to seek low-carbon energy sources in line with the Paris Accord of 2015.
For example, in the EU, 26% of total industrial heat demand is for high-temperature heat (>400°C), with the majority generated by burning of fossil fuels (IAEA Citation2017). In the US, the heat generated by fossil-fuel burning facilities generating 6558 million metric tons of CO2 emissions would be equivalent to the heat produced by approximately 31,228 Small Modular Reactors (SMR) each rated at 150 MWth. (Goetzke et al. Citation2022). These numbers say a lot about the decarbonisation challenge and highlight the importance of using energy efficiently. Interestingly, a significant fraction of industrial emissions, roughly 15% divided among petrochemicals, chlor-alkali, paper and pulp, and food processing, can be mitigated through thermal- and electrical integration with a Light Water Reactor (LWR), according to Knighton et al. (Citation2020).
With all the thermal energy wasted by nuclear power stations mentioned above, the immediate question becomes whether or not the rest energy can be used. A district heating system utilising the waste energy from a typical LWR increases the overall efficiency of the power station, depending on heat demand (e.g. season) to over 80% (Partanen Citation2017). The other possibility to address the two reasons mentioned above is, of course, to use other low-emission energy sources. The purpose of this paper is to evaluate which alternative is overall best for a large industrial plant that has a mix of both electric- and thermal power requirements.
Crucially, the prospects of SMRs as co-generation plants supplying electricity and process heat are considerably better than those of large reactors (Csik and Kupitz Citation1997). Indeed, the lack of interest of heat from nuclear power has historically given the focus on building large, baseload units (Goetzke et al. Citation2022). District heating networks generally have installed capacities in the range of 600–1200 MWthFootnote1 in large cities, and the temperature range required by district heating systems is around 100–150°C (Csik and Kupitz Citation1997), which means that the large nuclear power plants are basically too big. Another issue that favours SMRs is that the annual load factors of district heating systems depend on the length of the cold season when space heating is required, and can reach up to about 50%, which is still way below what is needed for base load operation of plants (Csik and Kupitz Citation1997).
Another interesting observation is the major differences in nuclear construction costs around the world with the South Korean approach outperforming most other countries. Indeed, according to Lovering, Yip, and Nordhaus (Citation2016), there is nothing inherent in the technology that predicates the cost escalation seen in some countries since the 80s. This is discussed more in detail in Section 2, but it indicates that how nuclear power projects are performed is critical for the costs and hence the topic of this paper.
Therefore, it is interesting to research whether or not an industrially built SMR will provide power to an industrial facility at lower or higher total cost than wind power. To address this question, we must first review what is known about such applications of nuclear power from before, which is done in Section 3. Then, in Section 4 the Melkøya case in Norway is used as background for a concept and feasibility study followed by critical review of the case in the subsequent section. In Section 6, a more complete approach to reach a final decision is discussed.
2. The costs of power
When it comes to cost estimates, the IPCC and many other organisations rely on ‘levelised cost’ of various kinds of estimates such as Levelised Cost of Energy (LCOE), Levelised Cost of Conserved Energy (LCCE), Levelised Cost of Conserved Carbon (LCCC) to facilitate a meaningful comparison of economics across diverse options at the technology level (Krey et al. Citation2014). These cost estimates are essentially weighted average costs with respect to the objective at hand. For example, the LCOE is the weighted average life cycle cost of producing energy from a certain source of energy, as we can see from the standard formula for the LCOE (IRENA Citation2012):
where LCOE = the average lifetime levelised cost of energy generation. It = investment expenditures in the year t. Mt = operations and maintenance expenditures in the year t. Ft = fuel expenditures in the year t. Et = electricity generation in the year t. r = discount rate. n = economic life of the system.
With the LCOE being used for policymaking worldwide (IRENA Citation2012), the LCOE is an obvious choice here since we are interested in the technology view and not the investment case per se. The difference is that the investment case takes the view of the organisation that invests whereas LCOEs are organisationally independent and take the total view irrespectively of who reaps what benefits and assumes what costs. These two power sources – wind power and nuclear power – are discussed briefly in the two consecutive sections. The purpose is to provide the context for Section 4 and not to present the actual cost estimates per se because the cost estimates for the industrial facility are the objective of this paper.
2.1. The cost of nuclear power and cogeneration
The cost of nuclear power varies significantly depending on a number of factors, as shown in . The numbers in are a few years old and are therefore only indicative for projects going forward. However, it is a very succinct figure, which is why it is used here. We see, for example, that the South Korean APR 1400 has an estimated LCOE of 34.05 USD/MWh produced given a 5% discounting rate. This is roughly half the cost of just about all the other reactor designs and countries. The question is whether or not these numbers still hold true.
Figure 1. The Levelised cost of energy for various reactors designs built in various countries for different cost parameters. Source: (Rothwell Citation2016).
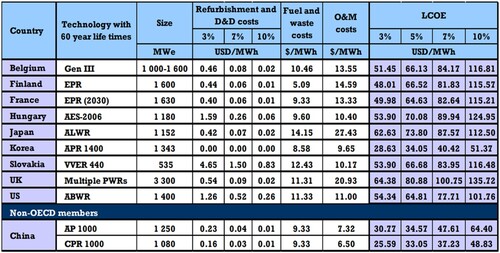
They do hold true because as Lovering, Yip, and Nordhaus (Citation2016) show; there are no intrinsic cost escalations in nuclear power as many authors suggest. The South Korean numbers in are equally interesting. There is a net decrease in overnight costs with time. Of course, since overnight costs do not include the financial costs, there can still be an increase in the project costs. However, due to the politics often involved in large energy projects, the overnight costs are more interesting from a technology point of view and the total costs from a commercial project point of view.
Figure 2. Overnight construction costs for nuclear power plants. Based on (Lovering, Yip, and Nordhaus Citation2016).
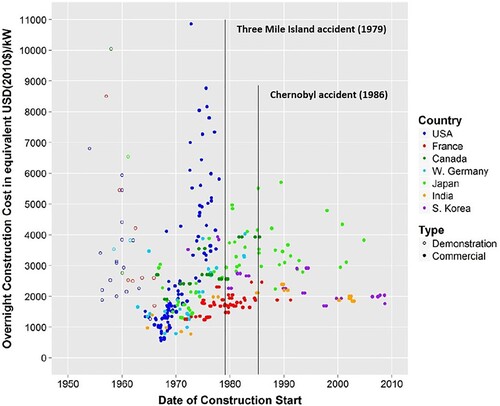
Hence, if done correctly, nuclear power can be very cost effective, and the key is standardisation for large nuclear power plants and industrialisation for SMR, as discussed later in Section 4.4.
This is the reactor part; what about cogenerated power as discussed in this paper? The following rule of thumb can be used: the cost of co-generated heat is equal to the electricity cost divided by the coefficient of plant performance, a factor which depends on the type of reactor under consideration and other parametersFootnote2 (Barnert, Krett, and Kupitz Citation1991). Using that rule, cost figures for co-generation have been calculated, as an example, for a modular high-temperature gas-cooled reactor (MHTGR) in Germany where the LCOE over 40 years of electricity equalled 5 US cents per kWh electric, the cost of steam equals 1.7 US cents per kWh(th) and the cost of hot water equals 0.5 US cents per kWh(th) (Barnert, Krett, and Kupitz Citation1991). An analysis of nuclear cogeneration in Canada, France, UK, USA, and Japan revealed that Canada is cheapest at 29.9 USD/MWh (1991 USD), which is lower than both the cost of coal and gas in all five countries whereas the most expensive is the UK at 55.0 USD/MWh (Hammond Citation1996).
Recently, the cost of producing high-pressure steam for industrial usage is estimated to be $4.00 to $5.25 per 1000 lb steam, depending on plant type and operation costs. This is 15% to 45% lower than the cost of similar production using a natural-gas package boiler before any credits for carbon emissions are applied (Peakman and Merk Citation2019).
A challenge with cogeneration is the transport of heat. An analysis performed in the US shows that transport distances up to 6 km are always feasible compared to using gas (Knighton et al. Citation2020). Of course, the longer the distance, the more thermal losses. Hence, the closer proximity between power production and consumption, the more economical as discussed later.
2.2. The cost of wind power
Since wind power provides direct electricity and no heat, cogeneration is impossible. Here, we must think electrification. The electrification can in itself be highly profitable (Devold, Nestli, and Hurter Citation2006) provided that the electric power can be supplied at reasonable costs. Due to the reliability target of 100% for industrial users (Csik and Kupitz Citation1997), it is the cost of the energy delivered to the industrial facility 24/7/365 that counts. Unfortunately, the LCOE estimates for wind power today include the asset level so they are only true on asset level (Emblemsvåg Citation2024). Hence, a useful cost analysis of wind power for an industrial facility must incorporate all the resources and their costs to secure a 100% reliability target. Thus, it is difficult to say anything generic other than the LCOE for wind power today cannot be used. It is perhaps indicative that Emblemsvåg (Citation2020) finds that the LCOE for wind power using geographical diversification and the US grid average weighted cost for electricity used for balancing and backup power, is 3 times higher than the LCOE for wind on asset level. Therefore, the cost of wind power is discussed in detail in Section 4 where the total system is included.
3. Brief overview of nuclear power for industrial facilities
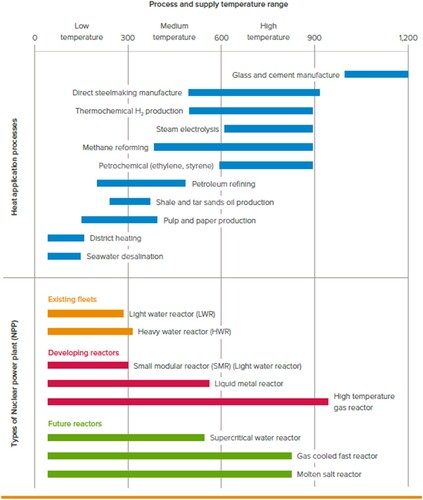
Three important facts are important to understand when it comes to using nuclear power for industrial facilities. First, the temperature ranges, up to about 300°C are obtained in light- and heavy water reactors, up to 540°C in liquid metal-cooled fast reactors, up to 650°C in advanced gas-cooled reactors, and up to about 1000°C in high-temperature gas-cooled reactors (Csik and Kupitz Citation1997). However, the current industrial heat demands for temperature in the range of 500–1000°C are relatively low (Peakman and Merk Citation2019).
Up to about 550°C, the heat can be supplied by steam; above that, requirements must be served directly by process heat. However, for nuclear technology the current upper limit is 1000°C set on the basis of the long-term strength of metallic reactor materials (Barnert, Krett, and Kupitz Citation1991). Above 1000°C, nuclear power can only contribute indirectly through, e.g. electricity.
The exact mix of thermal versus electric energy will depend on different countries’ industrial base and their requirements. For example, if we investigate the UK requirements, the two lowest temperature categories account for 35% each, the 500–1000°C is merely 11% and the above 1000°C is 19%, which cannot be directly supplied by nuclear technology due to limitations to metals (Peakman and Merk Citation2019), see .
Figure 3. UK industrial heat demand per year by sector. Source: (DECC Citation2013).
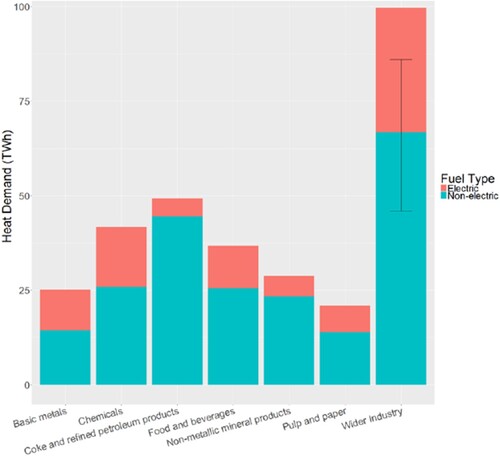
It is important to note that there is considerable uncertainty on the heat demand by temperature range and fuel type (electric and non-electric) within the ‘wider industry’ segment in , and when this is taken into account the two lowest temperature categories account for 28% and 29%, respectively. The 500–1000°C is merely 15% and the above 1000°C is 28%, which cannot be directly supplied by nuclear technology due to limitations to metals (Peakman and Merk Citation2019).
A similar analysis has been carried out for the US (Bragg-Sitton et al. Citation2020) where the categories are different and therefore the mix, compared to the UK. However, the overall result is similar. Finally, in the global situation is presented. Clearly, it is only the manufacturing of glass and cement where direct nuclear heat will have any problems. That said, there are reactor concepts that operate at 1000°C, see Huke et al. (Citation2015), but they are still in the early development stage. Thus, to design an effective energy system, we must take into account the industry structure of a given country.
Figure 4. Temperature ranges of heat application processes and types of nuclear power plant. Source: (IEA Citation2017).
Second, transport of heat is difficult and expensive. The need for a pipeline, thermal isolation, pumping, and the corresponding investments, heat losses, maintenance and pumping energy requirements make it impractical to transport heat beyond distances of a few kilometres or, at most, some tens of kilometres (Csik and Kupitz Citation1997). The implication is that the nuclear facility must be in relatively close proximity to the industrial sites. Recent studies show that at large scale (15–150 MWth), the heat from an LWR is more cost-effective than natural gas combustion up to a 1 km distance for the heat transported from the LWR to the industrial process (Knighton et al. Citation2020).
Third, the reliability requirements are key. For most Liquified Natural Gas (LNG) terminals, as in this study, electricity is not available from a nearby power station or reliable public grid (Devold, Nestli, and Hurter Citation2006). Yet, a common feature of practically all industrial users is the need for assurance of energy supply with a very high degree of reliability and availability, approaching 100% in particular for large industrial installations and energy-intensive processes (Csik and Kupitz Citation1997). For example, a shutdown of an LNG plant creates both a safety hazard and a major loss of production taking up to 48 h to come back on line (Devold, Nestli, and Hurter Citation2006). Availability and reliability of a reactor, however, can never reach the nearly 100% levels required by most large heat users. Consequently, redundancy is needed (Csik and Kupitz Citation1997). One option is a few SMRs instead of one larger, nuclear power plant.
In general, processes that integrate well with LWRs are those that require substantial water evaporation (specialty chemicals, chlor-alkali, paper and pulp, and food processing) or have large electrical and thermal demands (Knighton et al. Citation2020). Yet, about 99% of the industrial users are included in the 1–300 MWth range, which accounts for about 80% of the total energy consumed but some need up to 1000 MWth (Csik and Kupitz Citation1997). Hence, purely thermal demands needed for a particular process are unlikely to consume all of the energy generated by an LWR; therefore, large electrical demands, likely electrolysis processes (either chlor-alkali, water splitting, or alkane deprotonation), will be required to effectively use the entirety of an LWR’s output (Knighton et al. Citation2020) or alternatively deliver some power to the grid. Therefore, SMR presents a particularly interesting proposition for cogeneration (The Royal Society Citation2020), but the power output and consistency of LWRs are attractive for specific applications that could be seen as a transition stage for later when next-generation SMRs can be implemented (Knighton et al. Citation2020).
Therefore, the ultimate solution is to create an industrial energy park (Knighton et al. Citation2020) to minimise all types of losses. Hence, close proximity and the usage of SMRs are the two most energy-effective approaches to satisfy thermal heat requirements.
Since cogeneration depends on context, as discussed earlier, this paper focuses on the Hammerfest LNG (Melkøya) terminal in northern Norway owned by Equinor. There is much public debate about this LNG terminal because it is the largest point emitter of climate gases in Norway. Some want to electrify it using wind power whereas others want to use nuclear power and others want to keep it as it is (mostly gas-powered). In the recent application for concession to the Norwegian government by Equinor (NVE Citation2023), they have not considered nuclear power. Therefore, in the next section both wind- and nuclear power are analysed. With gas being the most commonly used balancing- and backup power for renewables in 26 countries of the Organisation for Economic Co-operation and Development (OECD) countries (Verdolini, Vona, and Popp Citation2018), and the current energy crisis in Europe in mind, this study can also be interesting from a strategic point of view.
4. The Melkøya LNG terminal case
The Melkøya LNG terminal receives gas from Snøhvit field in the Barents Sea, and currently 5 gas turbines with heat recovery satisfy the demand of 200 MWe effect and 140 MWth effect with 100% availability. In addition, the plant has a grid connection of 100 MW capacity typically utilised 50% (NVE Citation2020). The Norwegian Energy Regulatory Authority (NVE) has assessed the application from Equinor concerning building, owning and operating necessary electrical power infrastructure to secure the electrification of Hammerfest LNG (Melkøya), see for the location. The Snøhvit Future project, see , of Equinor is stipulated to cost 13.2 bn NOKFootnote3 consisting ofFootnote4:
2 main elements – the Snøhvit Land Compression and Snøhvit Electrification.
Compressor, power transformation station and electrical steam boilers on the Melkøya facility.
The power grid will also be expanded with a power transformation station on Hyggevatn and a grid extension from Skaidi to Hammerfest.
Figure 5. The approximate location of Hammerfest LNG Terminal Melkøya.
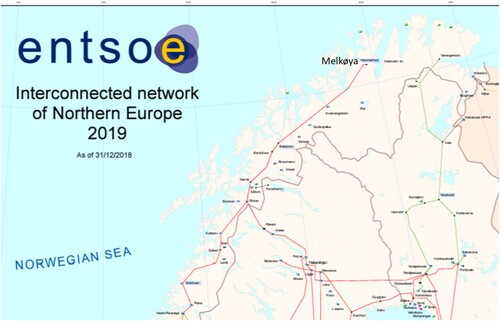
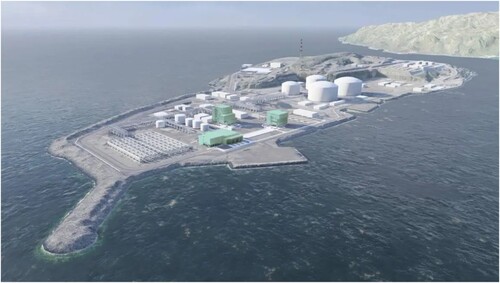
Figure 6. Illustration of the Melkøya LNG Terminal upon completion. Source: Equinor.Footnote10
The project is to cut CO2 equivalent emissions by 850,000 tonnes per year commencing in 2028, but a complete electrification will change the energy demand requiring 300 MWe effect in addition to the grid connection of today. A future planned upgrade of Snøhvit will add another 70 MWe demand (NVE Citation2020). The future upgrade will also be applicable to any nuclear alternative.
The possibility that power can be interrupted during operation of an All Electric Drive system must be factored in because such a power interruption will typically lead to a shutdown of the entire plant. A full shutdown in an LNG plant creates both a safety hazard and a major loss of production. It takes up to 48 h to come back on line (Devold, Nestli, and Hurter Citation2006). Therefore, the 100% reliability target with a risk buffer is crucial in this analysis.
The analysis is addressed by first modelling the capacity required to meet demand with 100% reliability in Sections 4.1 and 4.2. Then, the investment alternatives are discussed in Sections 4.3 and 4.4, and all the information is combined to produce the LCOE estimates in Section 4.6. Note that these LCOE estimates, particularly for the Wind alternative, are not the System LCOE for wind power as such but for the specific Wind alternative at hand. This fact gives the Nuclear alternative an edge by the nature of nuclear power being thermal, dispatchable with a large electric output despite losses.
Note that the System LCOE is basically the same as the LCOE but the system boundary is no longer the asset itself but the entire impacted system. The System LCOE concept was initially presented by Ueckerdt et al. (Citation2013), and it represents an attempt to overcome the limitations of LCOE as explained in detail by Emblemsvåg (Citation2024).
4.1. Capacity modelling wind power
To model the available capacity, the production data for price area N04 in Norway is used. From 20 years of data, the seasonal variability is calculated and also the hourly variance. These two are subsequently used to model a ‘typical year’.
The challenge is that the current install base of 1159.3 MW is far too little. In we see the production curve for 2022. Clearly, with a 100% reliability target and up to 370 MW in demand, the LNG terminal will suffer multiple blackouts every year. Indeed, there are 13 h per year with less than 1 MWh produced! In fact, there is 80% probability that the production will be 370 MWh or less in any given hour of the year.
Figure 7. Hourly wind power production in N04 in 2022 [MWh/h]. The figure is made by the author using data from NVE.Footnote11
![Figure 7. Hourly wind power production in N04 in 2022 [MWh/h]. The figure is made by the author using data from NVE.Footnote11](/cms/asset/4c45a8c3-206d-42c7-83bc-024f1998fa1a/gsol_a_2260008_f0007_oc.jpg)
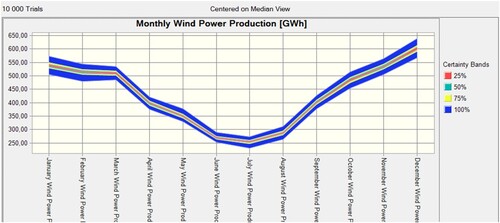
To amend this situation, the proposal by the government is to add another 670 MW.Footnote5 Assuming the same geographical mix and production profile with respect to wind conditions as the existing 1159 installed MW capacity, the capacity model of a typical year is scaled accordingly. The result is the monthly production profile shown in . By using all the data over the last 22 years, we can simulate 10,000 years of production by using Monte Carlo simulations. The resulting figure therefore also includes uncertainty. Note that the entire model is calculated 1 h resolution but for presentation purposes, the figures are presented at suitable aggregation levels depending on purpose.
Figure 8. Monthly wind power production profile including uncertainty in the model.
4.2. Capacity modelling nuclear power
The capacity modelling of nuclear power plants is far easier. Apart from unplanned outages, just as for wind power, the capacity modelling becomes a matter of maintenance planning. Essentially, it is important to avoid all reactors needing maintenance at the same time or on a high load time, such as in Winter. With the demand requirements from the Melkøya LNG terminal, it makes sense to also utilise the thermal rest energy for backup purposes. Deterministically speaking, the Nuclear alternative offers 300 MW firm electric power and 600 MW firm thermal rest power. Clearly, there is a very large thermal extra energy that can be utilised locally for district heating, maybe even a local swimming hall since the ocean outside is cold year-round and other good ideas are not included in this study.
Note that with a large thermal source of power and significant amount of thermal rest energy, even after providing the local community with various services, there is an option of employing a thermal battery. For example, Conlon, Venetos, and Hume (Citation2022) offer an interesting alternative although they also use gas exhaust as a source of energy. This is not included in the model since the electrification alternative does not have such a battery either.
4.3. The investment based on electrification and wind power
In addition to the 13.2 billion NOK investment, the operating costs of the electrification itself will add another 158 MNOK (NVE Citation2023). We must also estimate the costs of the 670 MW of additional wind power proposed by the government and the cost of wind power of the existing wind power plants. In the model, all the wind power in N04 is allocated to Melkøya for simplicity, resulting in a total wind power capacity of 1829.3 MW. This wind power is exclusively land-based, and NVEFootnote6 provides the data needed. Since this is a conceptual study with limited accuracy, the LCOE for wind power is directly with the inherent uncertainty that the parameters used by NVE may be slightly different than those in N04. The LCOE calculation by NVE uses a discounting factor of 6.0%, investment cost or capital expenditure (CAPEX) of 10 MNOK/MW and Operational Expenditures (OPEX) at 299.4 NOK/MWh in 2021 and 221.5 NOK/MWh in 2030.
In the model, the 2021 estimate is used because the equipment inflation of 38% witnessed over the two years, see Ferris (Citation2023), is not included in the analysis of NVE. Indeed, the global benchmark LCOE has temporarily retreated to where it was in 2019, according to Fine (Citation2022). However, the temporary nature of the reported 7% increase is questionable since costs have continued to rise even more to this date (September 2023). Therefore, to have a robust uncertainty modelling concerning the LCOE, the 2030 estimate of NVE is used as a lower end and a 15% increase of the 2021 estimate is used as the high end.
It is important to realise that these LCOE estimates use a system boundary of the wind power plant, i.e. asset level, which is common practice (Emblemsvåg Citation2024), and do therefore not incorporate the total costs. In addition, we must determine the balancing- and backup costs to secure 100% reliability. Due to the intermittent nature of wind power as discussed earlier, we need to perform a system simulation.
The most difficult aspect of this analysis is to estimate the likely cost of importing electricity from Sweden (SE1 price area), Finland (FI area) and further south in Norway (N03 area) particularly when a large variable consumer (as seen from the neighbouring price areas) is added with long transmission lines and losses. See where all major transmission lines are shown.
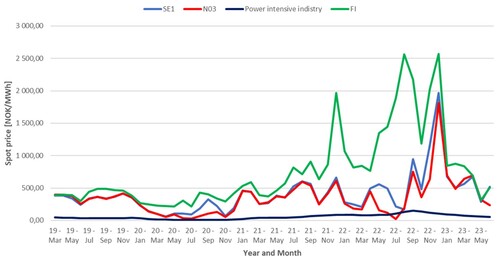
In , we see the prices in the neighbouring price areas since 2019 on a monthly basis. We see clearly the escalating prices since summer 2021 with high volatility in the latter half of 2022. The average prices in the three price areas are 411.30, 344.31 and 794.39 NOK/MWh in SE1, N03 and FI, respectively. However, a major consumer like the Melkøya LNG terminal is likely to obtain the best prices at all times, and for power-intensive industry there is also separate spot price in Norway shown in . The average for the period, using linear interpolation since the prices are provided on quarterly basis by Statistisk Sentralbyrå (SSB)Footnote7, we end up with an average of 56.74 NOK/MWh and a standard deviation of 40.38 NOK/MWh which is used in the simulation model.
Figure 9. Monthly spot prices in SE1, N03, power intensive industry in Norway and FI.
It should be noted that Equinor has stated that they will use the existing gas power plant to provide balance- and backup power. Given the wind capacity curves discussed above, this idea will essentially negate the very purpose of cutting emissions as the rapidly changing wind power will essentially lead to the gas turbines having to run large parts of the year. The costs of such an operation are also unknown to the author, and therefore excluded in this study.
With the true spot prices in the same price areas as shown in , it is obvious that if the Melkøya LNG terminal obtains the intensive power industry rates, as assumed here, there is a cost being shifted onto the local community of considerable size. The Net Present Value (NPV) of this social opportunity cost is estimated separately in the model using a social discount rate of 4.0%, which is used in a number of contexts in Norway (Liu Citation2018).
Note that a social opportunity cost is an externality of the analysis of Melkøya LNG terminal that arises from the fact that economically motivated decisions often affect people that are not directly involved in the transactions (third parties), and when they become large enough to constitute some kind of problem economists refer to them as externalities (Helbling Citation2010). In this case, we have so-called technical externalities since the indirect effects have an impact on the consumption and production opportunities of others, but the price of the product does not take those externalities into account. Identifying and agreeing on policies for internalisation of social costs is difficult in general (Tirole Citation2008), and this case is no different.
4.4. The investment based on nuclear power
When it comes to nuclear power, the data offered by NVE are based on large, European LWR, which are completely different than those envisaged for Melkøya in this study. Therefore, the cost calculation must be built up in this study. Since the data for SMRs are unreliable because they are based on cost modelling and prototypes and not commercial power plants, it is important to focus on robustness over accuracy. The fact is that factory-produced commercial nuclear power reactors have never been deployed, so there is little understanding of how SMR cost will evolve (Lovering and McBride Citation2020). Therefore, in this study, the most industrialised LWR design built by a democratic country is used as baseline, and that is the OPR 1000 and its successor APR 1400 from South Korea.
The latest construction completed in the Barakah Nuclear Power plant in United Arab Emirates (UAE) with 5600 MW of installed capacity had a CAPEX of 24.4 bn USD, according to WNISR (Citation2020). Translated into Norwegian currency (NOK) with NOK 10 per 1 USD as exchange rate, this is about 43.5 MNOK/MW, which is at the low end of the study performed by Abou-Jaoude et al. (Citation2023). This case is also interesting because UAE, like Norway, has no prior commercial nuclear reactors of any sort. Furthermore, the APR 1400 is a relatively new design so there is a first-of-a-kind (FOAK) premium. According to Abou-Jaoude et al. (Citation2023), the FOAK premium is about 1.4 implying that a design built later will cost at least 1.4 times less. Then, by dividing the capacity into two units, Melkøya would need 2 SMRs of 150 MW installed capacity costing 9.3 bn NOK including financing (whether these costs are included in the estimates for the wind power alternative is unclear).
Indeed, even with modest learning rates of 10–20%, SMRs could reach cost parity with large reactors after a dozen units built, even if they start out at twice, and later they can even reach cost parity with fossil fuel by 2050 (Lovering and McBride Citation2020). This paper has clearly not stretched nuclear that far, but the case becomes obvious if SMRs obtain such cost levels.
When it comes to OPEX, the study of Abou-Jaoude et al. (Citation2023) is the best-identified source. Since the SMRs have a number of simplifications compared to large LWRs, the midpoint between low end and mid-end is used as an estimate, i.e. USD 20 USD/MWh or 200 NOK/MWh, which is consistent with O&M (Operations & Maintenance), fuel and waste costs of the APR 1400 in . Note that this analysis presupposes that there is a nuclear waste facility somewhere so that Equinor does not have to build it but will pay to use it according to volume (pro rata).
The same discounting factor from NVE for wind power (6%) is used. Since a nuclear power plant has more than twice the life-span of a wind power plant, there will also be a residual value after the 25-year investment horizon that must be included. Using linear depreciation over 60 years, this amounts to 5.4 bn NOK nominally which after discounting becomes 1.6 bn NOK.
4.5. Summary of limitations and key assumptions
The discussions above result in a number of limitations and key assumptions that we must keep in mind when comparing the cost figures next:
Industrial facilities require 100% reliability. Wind alone will never provide that, so balancing and back-up power are required. All the wind power plants in N04 region are providing power to the Melkøya LNG plant. Nuclear does not require such balancing, but to increase the reliability 2 reactor units are required to take maintenance into account.
Both alternatives have impact on the wider system, which is why system costs are computed as well as System LCOE. Notably, the Wind alternative requires balancing- and backup power, while the Nuclear alternative presupposes the existence of a waste management system somewhere in Norway. Nuclear, also has a lot of rest energy that can be used which is not incorporated into the model. On the flip side, the Nuclear alternative will incur some integration costs to the current facility, but most likely small in comparison to the Wind alternative since the current facility also has thermal power sources (gas). On the other hand, it may be that this retrofit displacing an existing thermal power supply also has incurred some extra costs associated with the Wind alternative (in the 13.2 bn NOK CAPEX) that would have been eliminated if the facility was designed for electric power from the onset. These costs are also ignored.
The costs for the Wind alternative are based on 2021 numbers, which are most likely too low given the high inflation in equipment costs seen in the last 2 years. It is assumed that this very high equipment cost inflation will not continue, and therefore mostly ignored.
To estimate the nuclear costs, the costs obtained from the most standardised reactor design currently available – the APR 1400 – are used and scaled down in size to fit the purpose here.
Due to the long life-span of nuclear power plants (often 65 years), the economic rest value of the nuclear power plant after the analysis horizon of 25 years, is estimated as a discounted terminal value based on 60 years linear depreciation, which obviously is a rough approximation since this cannot be known until it is actually sold.
Some non-financial and non-technical issues are ignored in this study but discussed in Section 6.
More details about the actual cost numbers are provided next.
4.6. Calculating- and comparing the LCOEs
The cash flow analyses needed to calculate the Total System LCOE for the two alternatives are shown in . The base case represents the cost numbers without any inflation or discounting effects. Due to the simplicity of the cost modelling of the financial issues, only OPEX is adjusted with inflation (assumed to be 5% per year flat) but all costs are discounted. This flat inflation is the general inflation in society and not the equipment-specific inflation mentioned earlier. Also, the terminal value of the reactor investment is included because after the 25 years the analysis horizon covers, there are another 40 years of good operation where nuclear power plants are typically highly competitive.Footnote8
Table 1. Cost summary for the two alternatives.
If we compare the two alternatives, we see that the CAPEX of the Wind alternative is 3.9 bn NOK more expensive, while the OPEX for the Nuclear alternative is 341 MNOK higher every year. However, supplying all the wind power costs in discounted terms 24.3 bn NOK throughout the 25 years. In total, the Nuclear alternative therefore comes out far cheaper (about half the cost).
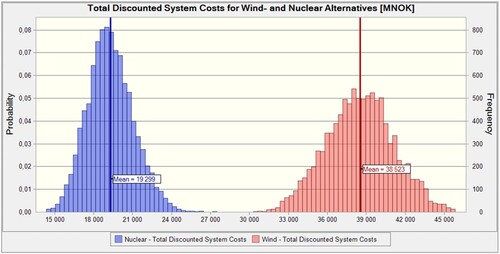
However, with all the variability of wind power, we cannot make a decision using deterministic figures. Therefore, a Monte Carlo simulation is run using ORACLE Crystal Ball with Latin Hypercube sampling for maximum accuracy and 10,000 trials to simulate 10,000 years to handle all possible operational conditions. How this works is explained in detail by Emblemsvåg (Citation2003). The results for the Monte Carlo simulations are shown in and thereafter. Clearly, there is very little probability that the Wind alternative will even come close to the Nuclear alternative.
Figure 10. Comparing the Total Discounted System Costs for the Wind- and for Nuclear alternatives.
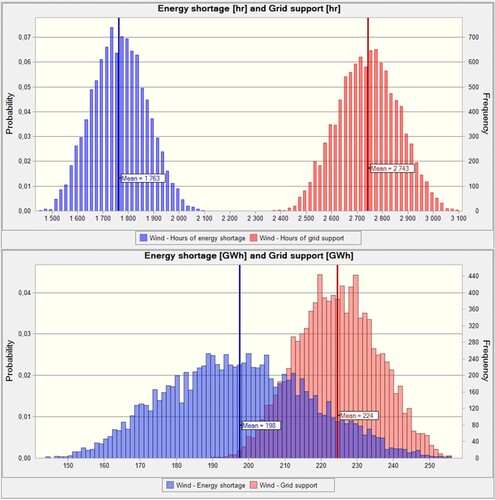
From , we see the number of hours traded including the energy shortages that will arise and the amount of electricity involved. We see that on average, about 2750 h of grid support over 100 MW grid connection will be required demanding 224 GWh from the grid. Among these hours with grid support, there will also be about 1750 h with outright energy shortages on Melkøya LNG terminal requiring almost 200 GWh of additional purchase of electricity from neighbouring price areas. Hence, the Wind alternative fails to deliver sufficient electricity to Melkøya LNG terminal. Not only will the Melkøya LNG terminal suffer major electricity shortage risks, but it will most likely transfer these risks due to the 100% reliability requirement to society and in the process incur substantial social opportunity costs locally.
Figure 11. The usage of the 100 MW grid support and outright energy shortages.
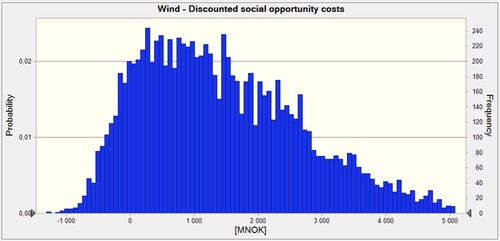
In essence, the Melkøy LNG terminal will crowd out local industries as seen in due to lack of electricity and superior financial strength and probably better procurement agreements on top. The most likely value is around 1 bn NOK in net present value, which can run as high as 5 bn NOK. There is also a chance (about 10% probability) that the social opportunity cost will be negative, i.e. produce a social opportunity benefit through overproduction of on average 1700 GWh per year, which amply demonstrates the challenges with renewable energy – it varies from overproduction to lack of production frequently.
Figure 12. The discounted social opportunity cost.
Note that these social opportunity costs are included in the total System LCOE, which is shown in . The System LCOE is essentially the Total Discounted System costs divided by the energy used. In the Nuclear alternative, only the used thermal energy is included in addition to the electric power. Hence, deterministically speaking, the Nuclear alternative will beat the Wind alternative with 275 NOK/MWh, as shown in . The System LCOE numbers for the Wind alternative, however, do not include the cost hikes in wind turbines and other related equipment witnessed in 2022 and so far in 2023, which means that the System LCOE numbers for Wind can easily get worse by the time the Melkøya LNG terminal is electrified.
Figure 13. System LCOE [MNOK] for wind- and nuclear alterntives.
![Figure 13. System LCOE [MNOK] for wind- and nuclear alterntives.](/cms/asset/bd043510-c48a-44b0-9318-27d4618cd50a/gsol_a_2260008_f0013_oc.jpg)
It is also likely that there is some cost escalation for the Nuclear alternative, but it will be less since the material requirements per TWh produced for nuclear power are far smaller in volume than for wind power or any other power source, and it consists mostly of abundant materials such as concrete and steel (US DOE Citation2015).
The Nuclear alternative also has a great advantage in that the thermal rest energy can be used directly by the LNG terminal. This lowers the System LCOE by allowing lower nameplate capacity and more energy output for the same nameplate capacity. The capability of using the thermal rest energy lowers the System LCOE for the Nuclear alternative by approximately 20%.
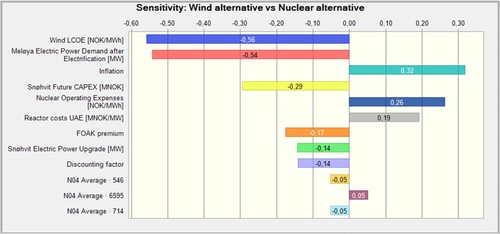
The sensitivity analysis in displays the sensitivities for the difference between the Wind alternative and the Nuclear alternative. The analysis includes all parameters in the model, out of 8789 parameters in total, that are both associated with uncertainty and have a higher rank correlation than 5%. The sensitivity chart therefore pinpoints those parameters that impact the uncertainty in the modelling the most.
Figure 14. Uncertainty sensitivity analysis of the difference between the two alternatives.
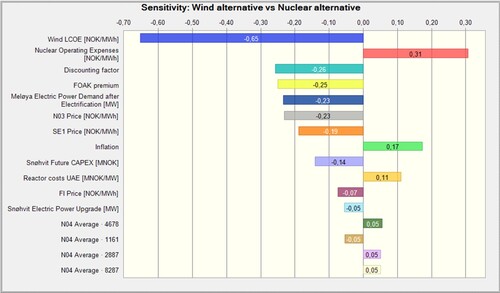
The Wind LCOE (the LCOE of wind power plants in N04 measured on asset level) in the model is clearly an important uncertainty factor and particularly its development. If this increases it will have a strong, deteriorating effect on the Wind System LCOE. The second factor shows that the nuclear OPEX is critical for the Nuclear alternative. The FOAK has also a strong impact on the Nuclear alternative since this factor is the ratio between FOAK and NOAK (nth-of-a-kind), and in the model it is used to model what the Nuclear costs will approach in time to make it more comparable with the mature land-based wind power technology. The investment cost for the nuclear facility itself, comes quite far down on the list perhaps due to the fact that in lieu of information, the uncertainty is modelled as just ±10%.
The discounting factor impacts both alternatives, but since the Nuclear alternative has the longest tail on the cash flow – including the terminal value – the Nuclear alternative is impacted the most. The same holds for inflation, as well.
Then, we have a number of Wind alternative-related factors. Both the NO3 price, the SE1 price and FI price imply that the cost of providing balancing-/backup power for the wind power is important. This is consistent with the findings from Emblemsvåg (Citation2020) who finds that an LCOE for wind including opportunity costs is at least 3 times higher than the LCOE used locally for wind power – the reason is the balancing- and backup costs. In this particular case, the system costs are actually lower than reported by Emblemsvåg (Citation2020). The reason is that in this case, the balancing power takes place through very favourable long-term industry purchasing power agreements while Emblemsvåg (Citation2020) bases his analysis on spot prices applicable to all customers in a grid.
We also have the investment costs (CAPEX) of the Melkøya LNG terminal itself and the Snøhvit upgrade. The uncertainty of those parameters is unknown but modelled as ±10% since no other information is available. However, there are significant execution risks in such large projects. The last four parameters in are related to the Wind alternative only, but the fact that they sometimes have positive impact and negative impact indicate that we have reached the limit of where random variations in a Monte Carlo simulation start to be significant, as discussed by Emblemsvåg (Citation2003) including countermeasures. Such countermeasures are not useful here due to the level of accuracy for conceptual studies.
There is also a second way of using sensitivity analyses called tracing, as discussed and exemplified by Emblemsvåg (Citation2003) in detail. By modelling all the uncertainty distributions of the parameters in the model by a symmetric- and bounded distribution, for example a triangular with ±10% spread, we can measure which variables have the greatest impact on the results themselves, i.e. the expected values. This approach is useful for improving investment alternatives. The sensitivity chart for that purpose is shown in .
Figure 15. Tracing sensitivity analysis of the difference between the two alternatives.
Again, the wind LCOE for the individual wind power plants the Melkøya LNG terminal rely on in the Wind alternative, comes up on top when we analyse the sensitivities of the difference between the two alternatives. In fact, almost all the factors are related to wind power except four.
The four parameters related to the Nuclear alternative are all related to either the investment or its operational expenses, with the same interpretation as in the uncertainty-related sensitivity analysis discussed earlier.
5. Critical review and future work
The analysis performed in this paper is limited by a number of factors, notably the lack of access to detailed operational data of Melkøya LNG terminal. However, since this is equal for both alternatives it has limited relevance as to the comparison of the two alternatives, but it will certainly have an impact on the absolute levels of energy consumed and therefore costs. Since this is a conceptual study where two alternatives are pegged against each other, this limitation is therefore of minor importance although we should be aware of it to avoid overinterpreting the results for this specific case.
A more interesting limitation is the available information concerning the cost levels at the time of decision-making as well as how the costs will be impacted by local siting issues such as terrain, how the local native people’s rights will be implemented and so on. This can incur significant project execution costs that are today unknown, at least to the author of this paper. The two alternatives have a different risk profile in this respect.
The Nuclear alternative has a risk concerning the geological quality of the site itself on Melkøya or in the vicinity or wherever it is placed. With Norway having very old and stable rock formations, it is likely that this risk will have little impact. The greatest risk, however, is the politics in Norway which has excluded nuclear power over the last two decades, even in research. Thus, we have to argue this analysis from the point of view that a technology-neutral approach is permitted. Otherwise, the Nuclear alternative is, as of today, difficult or even impossible.
The Wind alternative has risks, as mentioned, related to area usage in a wide sense. This risk is substantiated by the Fosen case where licences for wind power development were ruled invalid by the Supreme Court of Norway due to the fact that the construction violates Sami reindeer herders’ right to enjoy their own culture.Footnote9 With Finmark and Troms being part of the heartland of the Sami people, such cases are likely to become many more involving both wind power plants and the power lines required to Melkøya.
It should be noted that the cost factors for both alternatives are a few years old and with the current inflation levels it can be many percentage points off. With the overall other uncertainties present, however, it is unlikely that this will not fundamentally alter the comparison of the two alternatives, and if it did – it is likely that this will strengthen the Nuclear alternative as noted earlier.
A very important factor for the Wind alternative, is the prices for the balancing- and backup power, as shown in and . Furthermore, from we see that these prices are increasing. From other countries with a high degree of wind power, we know that prices to industry increase as wind power penetration increase, as demonstrated amply by Germany as discussed by Emblemsvåg and Ôsterlund (Citation2023). Thus, the Wind alternative is likely to grow worse with time.
Cases of this complexity obviously cannot be solved by a techo-economic analysis, such as this, alone. There are many other factors that come into play, as mentioned, that will impact the final decisions significantly. This is discussed next.
6. Using multi-criteria decision analysis to reach a final conclusion – future work
The concept and feasibility study presented is techno-economic and to some extent socio-economic. However, the socio-technological aspects are largely ignored because they in this case border into politics that would in itself be a research project worthy. Therefore, this section only briefly discusses the aspects and outlines how to address them in possible future work.
First of all, we must recognise that these aspects are multi-dimensional as well as qualitative and quantitative. That limits the available approaches for how to address them in a scientific manner. One of the best subjective methods for providing decision-support in multi-objective situations, is the Analytic Hierarchy Process (AHP) developed in the late 1960s and first publicised for a wider audience in numerous books such as Saaty (Citation1990).
The AHP has been used in a wide array of situations such as resource allocation, scheduling, project evaluation, military strategy, forecasting, conflict resolution, political strategy, safety, financial risk and strategic planning (Saaty and Forsman Citation1992). AHP has also been applied in selecting suppliers (Bhutta and Huq Citation2002), business performance measurement (Cheng and Li Citation2001), quantitative construction risk management (Dey Citation2001) and selection of maintenance strategy and organisation (Emblemsvåg and Tonning Citation2003).
There are many key criteria that must be addressed in future work to reach a viable decision, in addition to the data accuracy discussed earlier, and all must be formulated in the matrix system of the AHP approach. The local native people’s rights, the area usage of wind power and transmission lines also outside native people’s areas, employment opportunities and broader societal impact are already noted. It has also alluded to the fact that the Wind alternative will crowd out local businesses and create a conflict concerning social opportunity costs. Most of these issues strengthen the Nuclear alternative.
Then we have legal issues on both alternatives including policies, regulations and potential resistance from various advocacy groups and non-governmental organisations (NGO). The Nuclear alternative, however, has a particular issue related to nuclear waste driven by public risk perception as demonstrated by Slovic, Fischhoff, and Lichtenstein (Citation1979) as early in the late 70s. Here, there are endless debates on both sides also internationally between laymen as well as researchers. Norway has, on top, a historical precedent of opposing commercial nuclear power, which will undoubtedly impact the Melkøya LNG terminal case. Interestingly, both advocacy groups and NGOs are on both sides of the debate highlighting the different views of such projects. Obviously, both NGOs and advocacy groups will have a good opportunity to create legal roadblocks in the Melkøya case.
Anyway, once the criteria and issues are known, the next step in the AHP approach will be to rate them against each other through pairwise comparison. The AHP approach has a consistency check allowing only 10% inconsistency (Peniwati Citation2000) thereby preventing politics by ensuring logical consistency. This step will be challenging due to the politicised atmosphere of such cases. The final step where each alternative is to be assigned grades to each of these criteria will be even more challenging.
Thus, in the end, the Melkøya LNG terminal will therefore most likely be a political decision despite that the analysis presented here shows that the techno-economic- and the socio-economic case for the Nuclear alternative is strong. These political processes are very unlikely to follow anything that resembles the AHP approach outlined above, but that does not mean using AHP is useless. Researchers should strive to present their work with integrity to aid political deliberations and using AHP is a good tool for that in future work because it takes the politics out of science, but it cannot take the politics out of the decision.
7. Conclusions
Industrial facilities around the world that have so far relied on fossil energy, increasingly face difficult choices in their quest to cut emissions. In this paper, one such facility and its choices have been discussed. The Nuclear alternative is techno-economically better, but due to the importance of context for such facilities, we cannot directly transfer this finding to all such industrial facilities.
What appears to be a generic finding is that if the nuclear thermal rest energy can be utilised effectively, as in the Melkøya case, the nuclear power has a strong case over wind power because wind power requires more electric power and it also requires balancing- and backup power. This finding requires more research to verify, but as Smil (Citation2020) notes in the context of Germany after 20 years of Energiewende;
In 2000, Germany had an installed capacity of 121 gigawatts and it generated 577 terawatt-hours, which is 54 percent as much as it theoretically could have done (that is, 54 percent was its capacity factor). In 2019, the country produced just 5 percent more (607 TWh), but its installed capacity was 80 percent higher (218.1 GW) because it now had two generating systems.
Acknowledgement
The author would like to thank the journal for its fast handling and very useful comments from the reviewers that improved the readability of the manuscript significantly.
Disclosure statement
No potential conflict of interest was reported by the author(s).
Notes
1 Note that we often use ‘th’ or ‘e’ after MW and MWh (or the like) to denote that the number is thermal or electric. In this case, MWth implies that the thermal effect is 1200 MW. For thermal energy sources such as nucelar power, the thermal effect is therefore the total effect and normally 3 times higher than the electric effect unless there is cogeneration with a mix.
2 The coefficient of performance is specifically defined as c = Hb/ΔE, in which Hb is the produced heat and ΔE is the difference between electricity in the pure electricity production mode and in the co-generation mode of operation (Barnert, Krett, and Kupitz Citation1991).
3 NOK (Norske kroner) is the currency of Norway and has the last year traded at around 10 per US dollar.
4 This information was accessed 2023-08-27 from https://www.equinor.com/news/20230808-governmental-green-light-snohvit-future.
5 Information obtained on 2023-08-24 from https://e24.no/energi-og-klima/i/Q7B2gR/mer-kraft-og-nett-i-nord-melkoeya-er-en-motor.
6 NVE has a website, accessed 2023-08-20, that offers the data, see https://www.nve.no/energi/analyser-og-statistikk/kostnader-for-kraftproduksjon/.
7 Data obtained on 2023-08-20 from https://www.ssb.no/statbank/table/09364/.
8 For example, in the US, depreciated power plants have a cost of about 30 USD/MWh, see https://www.statista.com/statistics/184754/cost-of-nuclear-electricity-production-in-the-us-since-2000/.
9 The ruling was accessed 2023-08-31 from https://www.domstol.no/en/supremecourt/rulings/2021/supreme-court-civil-cases/hr-2021-1975-s/.
10 Obtained 2023-08-27 from https://www.equinor.com/news/20230808-governmental-green-light-snohvit-future.
References
- Abou-Jaoude, A., L. Lin, C. Bolisetti, E. Worsham, L. M. Larsen, and A. Epiney. 2023. Literature Review of Advanced Reactor Cost Estimates. Idaho Falls, ID: Idaho National Laboratory (INL), Nuclear Science & Technology Directorate.
- Barnert, H., V. Krett, and J. Kupitz. 1991. “Nuclear Energy for Heat Applications: Co-generating Electricity and Heat is a Promising Application.” IAEA Bulletin 33 (1): 21–24.
- Bhutta, K. S., and F. Huq. 2002. “Supplier Selection Process: A Comparison of the Total Cost of Ownership and the Analytic Hierarchy Process Approaches.” Supply Chain Management: An International Journal 7 (3): 126–135. https://doi.org/10.1108/13598540210436586.
- Bragg-Sitton, S. M., R. Boardman, C. Rabiti, and J. O’Brien. 2020. “Reimagining Future Energy Systems: Overview of the US Program to Maximize Energy Utilization via Integrated Nuclear-Renewable Energy Systems.” International Journal of Energy, Research 44, https://doi.org/10.1002/er.5207.
- Cheng, E. W. L., and H. Li. 2001. “Analytic Hierarchy Process: An Approach to Determine Measures for Business Performance.” Measuring Business Excellence 5 (3): 30–36. https://doi.org/10.1108/EUM0000000005864.
- Conlon, W. M., M. J. Venetos, and S. Hume. 2022. “Liquid Salt Combined Cycle.” Proceedings of ASME Turbo Expo 2022, Turbomachinery Technical Conference and Exposition GT2022, June 13–17, 2022. Rotterdam, The Netherlands, American Society of Mechanical Engineers (ASME): GT2022-82343.
- Csik, B. J., and J. Kupitz. 1997. “Nuclear Power Applications: Supplying Heat for Homes and Industries.” IAEA Bulletin 39 (2): 21–25.
- DECC. 2013. The Future of Heating: Meeting the Challenge. London: Department of Energy and Climate Change (DECC).
- Devold, H., T. Nestli, and J. Hurter. 2006. All Electric LNG Plants: Better, Safer, More Reliable - and Profitable. Oslo: ABB Process Automation Oil and Gas.
- Dey, P. K. 2001. “Decision Support System for Risk Management: A Case Study.” Management Decision 39 (8): 634–649. https://doi.org/10.1108/00251740110399558
- Emblemsvåg, J. 2003. Life-Cycle Costing: Using Activity-based Costing and Monte Carlo Methods to Manage Future Costs and Risks. Hoboken, NJ: John Wiley & Sons.
- Emblemsvåg, J. 2020. “On the Levelized Cost of Energy of Windfarms.” International Journal of Sustainable Energy 39 (7): 700–718. https://doi.org/10.1080/14786451.2020.1753742
- Emblemsvåg, J. 2024. Understanding the Levelized Cost of Energy.Handbook of Power Systems, edited by M. Freunek and O. Doleski. Berlin: De Gruyter Oldenbourg. Accepted for publication.
- Emblemsvåg, J., and A. Ôsterlund. 2023. “How the Energy Trilemma Can Provide Learning Points Between Countries – the Case for Nuclear.” Internation Journal for Nuclear Power 68 (2): 31–42.
- Emblemsvåg, J., and L. Tonning. 2003. “Decision Support in Selecting Maintenance Organization.” Journal of Quality in Maintenance Engineering 9 (1): 11–24. https://doi.org/10.1108/13552510310466765.
- Ferris, N. 2023. “Data Insight: The Cost of a Wind Turbine Has Increased by 38% in Two Years.Energy Monitor.” https://www.energymonitor.ai/renewables/data-insight-the-cost-of-a-wind-turbine-has-increased-by-38-in-two-years/.
- Fine, A. 2022. “New Onshore Wind Project Costs Increased 7 Percent from 2021 to 2022.” North American Windpower. https://nawindpower.com/new-onshore-wind-project-costs-increase-7-percent-from-2021-to-2022.
- Goetzke, R., I. Garza, M. Nena, R. Field, S. Malak, and A. Wilson. 2022. The Viability of Nuclear Plant Process Heat for Industrial Usage. Chicago, IL: Sargent & Lundy.
- Hammond, G. P. 1996. “Nuclear Energy Into the Twenty-First Century.” Applied Energy 54 (4): 327–344. https://doi.org/10.1016/0306-2619(96)00003-7.
- Helbling, T. 2010. What Are Externalities? What Happens When Prices Do Not Fully Capture Costs. Finance & Development. Washington, DC: International Monetary Fund (IMF). 47: 48–49.
- Huke, A., G. Ruprecht, D. Weißbach, S. Gottlieb, A. H. Hussein, and K. Czerski. 2015. “The Dual Fluid Reactor – A Novel Concept for a Fast Nuclear Reactor of High Efficiency.” Annals of Nuclear Energy 80: 225–235. https://doi.org/10.1016/j.anucene.2015.02.016
- IAEA. 2017. Industrial Applications of Nuclear Energy. IAEA Nuclear Energy Series. Wien: International Atomic Energy Agency (IAEA), Department of Nuclear Energy, Nuclear Power Technology Development Section (NPTDS).
- IEA. 2017. Opportunities for Cogeneration with Nuclear Energy. Paris: International Energy Agency (IEA) / Organization for Economic Co-operation and Develop (OECD).
- IRENA. 2012. Renewable Energy Technologies: Cost Analysis Series. Abu Dhabi: International Renewable Energy Agency (IRENA), IRENA Innovation and Technology Centre.
- Knighton, L. T., A. Shigrekar, D. S. Wendt, R. D. Boardman, B. Murphy, and B. D. James. 2020. Markets and Economics for Thermal Power Extraction from Nuclear Power Plants Aiding the Decarbonization of Industrial Processes. Washington, DC: U.S. Department of Energy, Office of Nuclear Energy.
- Krey, V., O. Masera, G. Blanford, T. Bruckner, R. Cooke, K. Fisher-Vanden, H. Haberl, et al. 2014. “Annex II: Metrics & Methodology.Climate Change 2014: Mitigation of Climate Change.” In Contribution of Working Group III to the Fifth Assessment Report of the Intergovernmental Panel on Climate Change, edited by O. Edenhofer and R. Pichs-Madruga, 1281–1328. Cambridge: Cambridge University Press.
- Liu, G. 2018. Measuring Human Capital for Norway 2007–2014. Oslo: Statistisk Sentralbyrå (SSB) - Statistics Norway.
- Lovering, J. R., and J. R. McBride. 2020. “Chasing Cheap Nuclear: Economic Trade-offs for Small Modular Reactors.” The Bridge 50 (3): 38–44.
- Lovering, J. R., A. Yip, and T. Nordhaus. 2016. “Historical Construction Costs of Global Nuclear Power Reactors.” Energy Policy 91 (April): 371–382. https://doi.org/10.1016/j.enpol.2016.01.011
- NVE. 2020. Elektrifiseringstiltak i Norge: Hva er konsekvensene for kraftsystemet? NVE Rapport nr. 36/2020. Oslo, Noregs Vassdrags og Energidirektorat (NVE). English; Norwegian Water Resources and Energy Directorate.
- NVE. 2023. Tilknytning og elektrifisering av Hammerfest LNG: Bakgrunn for innstilling. Oslo, Noregs Vassdrags og Energidirektorat (NVE). English; Norwegian Water Resources and Energy Directorate.
- Partanen, R. 2017. “Decarbonizing Cities: Helsinki Metropolitan Area: Providing District Heating, Power and Transportation Fuels with Advanced Nuclear Reactors.” Helsinki, Energy for Humanity.
- Peakman, A., and B. Merk. 2019. “The Role of Nuclear Power in Meeting Current and Future Industrial Process Heat Demands.” Energies 12, https://doi.org/10.3390/en12193664.
- Peniwati, K. 2000. The Analytical Hierarchy Process: Its Basics and Advancements. Jakarta: INSAHP 2000.
- Rosen, M. A. 2021. “Nuclear Energy: Non-Electric Applications.” European Journal of Sustainable Development Research 5 (1), https://doi.org/10.29333/ejosdr/29305.
- Rothwell, G. 2016. “Defining Plant-level Costs.” In The Full Costs of Electricity Provision.Nuclear Energy Agency International Workshop. Paris: OECD, Nuclear Energy Agency, Division of Nuclear Development.
- The Royal Society. 2020. Nuclear Cogeneration: Civil Nuclear Energy in a Low-carbon Future. Policy Briefing. London: The Royal Society.
- Saaty, T. L. 1990. The Analytic Hierarchy Process: Planning. Priority Setting, Resource Allocation. Pittsburgh: RWS Publications.
- Saaty, T. L., and E. Forsman. 1992. The Hierarchon: A Dictionary of Hierarchies. Arlington, VA: Expert Choice.
- Slovic, P., B. Fischhoff, and S. Lichtenstein. 1979. “Facts and Fears: Understanding Perceived Risk.” In Proceedings of the General Motors Symposium on Societal Risk Assessment, edited by R. C. Schwing and W. A. Albers, 181–216. Warren, MI: Plenum Press.
- Smil, V. 2020. “Energiewende, 20 Years Later.” IEEE Spectrum 57 (12): 22–23. https://doi.org/10.1109/MSPEC.2020.9271803
- Tirole, J. 2008. “Some Economics of Global Warming.” Rivista di Politica Economica 98 (6): 9–42.
- Ueckerdt, F., L. Hirth, G. Luderer, and O. Edenhofer. 2013. “System LCOE: What Are the Costs of Variable Renewables?” Energy 63: 61–75. https://doi.org/10.1016/j.energy.2013.10.072
- US DOE. 2015. Quadrennial Technology Review: An Assessment of Energy Technologies and Research Opportunities. Washington, DC: United States Department of Energy.
- Verdolini, E., F. Vona, and D. Popp. 2018. “Bridging the Gap: Do Fast-Reacting Fossil Technologies Facilitate Renewable Energy Diffusion?” Energy Policy 116: 242–256. https://doi.org/10.1016/j.enpol.2018.01.058
- WNISR. 2020. “Barakah, UAE: Grid Connection of First Commercial Reactor in the Arab World.”
