
 ?Mathematical formulae have been encoded as MathML and are displayed in this HTML version using MathJax in order to improve their display. Uncheck the box to turn MathJax off. This feature requires Javascript. Click on a formula to zoom.
ABSTRACT
The previous stochastic hosting capacity prediction method using the Monte Carlo method for high photovoltaic (PV) penetration with a battery energy storage system (BESS) required a large number of computations to achieve the expected accuracy. The problem of high computational load must be addressed so that the electrical distribution planner can practically use the PV hosting capacity prediction in actual situations. Therefore, this study developed a Markov-chain-based PV hosting capacity prediction method for high PV penetration using BESS. The proposed method is described in detail, followed by case and validation studies. The obtained hosting capacity was 123.58 kW, which increased to 3676.4 kW after the utility-scale BESS implementation. The results demonstrate that the proposed Markov-chain-based PV hosting capacity prediction method outperforms the Monte Carlo method, which is the most popular stochastic hosting capacity method, in terms of accuracy and computational cost.
1. Introduction
In recent years, the penetration of photovoltaic (PV) systems into electric power distribution networks has increased (IEA Citation2022; IRENA Citation2022). This motivated the investigation into the negative impacts of distribution systems (Andresen, Buticchi, and Liserre Citation2016; Elrayyah, Wanik, and Bouselham Citation2017; Hasheminamin et al. Citation2015; Mortazavi et al. Citation2015; Olivier et al. Citation2016; Reno et al. Citation2016; Santos-Martin and Lemon Citation2016). The rapid increase in PV penetration was due to the price of PV units, the vision of reducing fossil fuels and CO2, the development of PV technology, and the support of government regulations (Abreu, Wingartz, and Hardy Citation2019; Comello, Reichelstein, and Sahoo Citation2018; Handayani, Krozer, and Filatova Citation2019; Karakaya, Hidalgo, and Nuur Citation2015). At a specific level, the penetration of distributed PV has the potential to cause problems with the operational performance of the power distribution system, such as overvoltage (Elrayyah, Wanik, and Bouselham Citation2017; Hasheminamin et al. Citation2015; Olivier et al. Citation2016; Reno et al. Citation2016; Santos-Martin and Lemon Citation2016), reverse power flow (Hasheminamin et al. Citation2015; Mortazavi et al. Citation2015), and violation of the conductor current-carrying capacity (Andresen, Buticchi, and Liserre Citation2016; Reno et al. Citation2016). To prevent these issues, the host capacity of the distribution system must be determined. PV hosting capacity is defined as the maximum amount of power generated from distributed PV penetration that can be integrated into the distribution network before operational problems occur in the network (Bollen and Hassan Citation2011).
Predicting the PV hosting capacity is necessary for planning an electric power distribution system related to the increasing penetration of distributed PV (Dubey and Santoso Citation2017; Electric Power Research Institute Citation2012). Therefore, the accuracy of the hosting capacity prediction is a major concern. Previous studies have developed methods for determining the hosting capacity to improve the accuracy of the natural characteristics of PV penetration (Bollen and Hassan Citation2011; Breker, Claudi, and Sick Citation2015; Dubey and Santoso Citation2017; Electric Power Research Institute Citation2012; Kolenc, Papič, and Blažič Citation2015). The main challenge in improving accuracy is the modelling of distributed penetration, which includes the characteristics of uncertainty and natural variability of PV penetration (Bollen and Hassan Citation2011; Breker, Claudi, and Sick Citation2015; Dubey and Santoso Citation2017; Electric Power Research Institute Citation2012; Emmanuel and Rayudu Citation2017; Heslop, MacGill, and Fletcher Citation2016; Kolenc, Papič, and Blažič Citation2015; Luthander, Lingfors, and Widén Citation2017).
To model the PV penetration and obtain expected hosting capacity results, the two most widely used approaches are the deterministic approach and the stochastic approach. A deterministic approach for obtaining the hosting capacity has been implemented by several authors (Abdelkader, Osman, and Elshahed Citation2020; Conti and Raiti Citation2007; Emmanuel and Rayudu Citation2017; Heslop, MacGill, and Fletcher Citation2016; Kabir, Mishra, and Bansal Citation2016; Luthander, Lingfors, and Widén Citation2017; Shayani and De Oliveira Citation2011). This approach predicts the hosting capacity by setting specific values as simulation variables. The process of deploying PV in a deterministic approach is performed by predetermining the size of the PV with a specific value. Subsequently, the location of the PV integration is determined on one or several buses in the distribution system used. A deterministic approach is typically used to determine the host capacity of one or more PV units (Gözel and Hocaoglu Citation2009; Wang and Nehrir Citation2004). The worst-case scenarios have been analysed using a deterministic approach (Mokryani et al. Citation2017). This approach does not include uncertainties in the PV size and location of PV integration; thus, random characteristics cannot be represented (Conti and Raiti Citation2007; Kabir, Mishra, and Bansal Citation2016). The results showed that the PV hosting capacity obtained using the deterministic approach successfully provided the maximum allowable PV penetration for the case considered at the specific PV location and size. However, the probabilities of other buses having PV installations were not considered. This condition questions the global solution for the hosting capacity results. Furthermore, it is difficult to apply the deterministic approach to a real distribution grid which has a complex and large distribution system with many distributed PV systems (Zubo et al. Citation2017).
In addition to the deterministic approach, a stochastic approach was developed to predict the hosting capacity of a distributed PV system (Bollen and Rönnberg Citation2017; Breker, Claudi, and Sick Citation2015; Kolenc, Papič, and Blažič Citation2015). In the stochastic approach, the calculation of the PV hosting capacity depends on random variables of the PV penetration distribution in the distribution network (Breker, Claudi, and Sick Citation2015). Methods based on stochastic approaches are recognised by the characteristics of uncertainty and variability as inputs in modelling the penetration of PV systems. The Monte Carlo approach is the fastest growing and most widely used approach for determining stochastic hosting capacity (Atmaja, Sarjiya, and Putranto Citation2022; Bollen and Rönnberg Citation2017; Ding and Mather Citation2017; Dubey and Santoso Citation2017; Torquato et al. Citation2018). The random characteristics of distributed PV penetration include the uncertainty of the PV size and integration locations of the distributed PV in the low-voltage distribution network (Ding and Mather Citation2017; Dubey and Santoso Citation2017; Dubey, Santoso, and Maitra Citation2015; Electric Power Research Institute Citation2012). Another important characteristic is variability. Variabilities appeared in the PV output power and load demand. In the time-series framework, the variability in the PV output power and load demand results in fluctuations over time (Behravesh, Keypour, and Foroud Citation2018; Wang et al. Citation2020). Considering these conditions, a stochastic method for determining the hosting capacity must consider the uncertainty and variability characteristics of PV penetration to produce a representative distributed PV penetration model (Dubey and Santoso Citation2017; Gooding, Makram, and Hadidi Citation2014; Wang et al. Citation2020).
Although previously developed Monte Carlo-based PV hosting-capacity prediction methods have succeeded in representing the random characteristics of PV penetration, the Monte Carlo method has limitations in terms of accuracy and computational load. This method requires numerous simulations to obtain the expected accuracy (Dubey and Santoso Citation2017). The addition of uncertainty variables also increases the number of Monte Carlo simulations.
To address this problem, this paper proposes a PV hosting-capacity prediction method based on the Markov chain model. The Markov chain model has successfully quantified the uncertainty characteristics of energy resources in several studies (He et al. Citation2014; Inacio and Borges Citation2018; Jin et al. Citation2022; Xu, Alhamid, and Dutre Citation1989; Zargar and Moghaddam Citation2020). Xu, Alhamid, and Dutre (Citation1989) used meteorological data to construct a Markov transition matrix, which was used to perform PV simulations (Xu, Alhamid, and Dutre Citation1989). The Markov chain uses a Markov transition matrix, also known as a transition probability matrix, for the movement from the previous state to the current state. The Markov chain model was also used by He et al. (Citation2014) to predict short-term wind farm generation and ramping trends (He et al. Citation2014). The uncertain wind farm generation was integrated into the economic dispatch and unit commitment problems. Consequently, optimal dispatch decisions could be made. Zargar and Moghaddam (Citation2020) developed Markov chain-based model for solar generation and claimed that the method could provide a prediction with the desired accuracy because the model was trained using historical data (Zargar and Moghaddam Citation2020). A Markov chain model was also proposed to predict solar radiation within a time-series framework (Inacio and Borges Citation2018). Jin et al. (Citation2022) proposed using the Markov chain to improve the efficiency of the time-sequential simulations of wind and PV power time series (Jin et al. Citation2022). A Markov chain transition probability matrix was constructed from various combinations of typical days for this purpose.
The objective of this study is to provide a higher level of accuracy in stochastic PV hosting capacity prediction using the Markov chain approach without the need for a heavy computational load. Data from the California Solar Initiative was used to create a transition probability matrix for the Markov chain model. Although we used historical data from California, the proposed method can be applied to build a Markov chain model from another location. This paper describes the proposed method in detail, followed by a case study. An IEEE 123-bus test feeder was used to render the study transparent. A validation study was conducted to evaluate the performance of the proposed method. The results were compared with those obtained by the Monte Carlo-based PV hosting-capacity prediction.
The difficulties and challenges of the proposed Markov chain method for predicting the hosting capacity lie in the construction of a stochastic model. There are two requirements for the model: (1) the model must represent the uncertainties of actual PV penetration without requiring a large computational load; (2) as the number of simulations is reduced, the accuracy must be kept high. To address these issues, this study used a transition probability matrix to model the uncertainties in actual PV penetration. Furthermore, to obtain the expected accuracy when the number of simulations is reduced, a mathematical calculation of the probabilities of moving from the current state to the next state is provided. With these probabilities, there is no need to demonstrate many unnecessary penetration sequences that do not conform to the historical data. Unlike the previous approach, the proposed solution predicts the hosting capacity using fewer simulations and obtains the desired accuracy.
1.1. State-of-the-art stochastic approach for PV hosting capacity prediction method
The stochastic approach for predicting PV hosting capacity has been thoroughly examined in previous studies using a variety of approaches. Many investigations have tried to develop techniques to improve accuracy. In 2012, the Electric Power Research Institute (EPRI) designed a random-penetration scenario for distributed PV systems (Electric Power Research Institute Citation2012; Smith et al. Citation2015). A unique scenario was developed for each PV deployment process. Dubey, Santoso, and Maitra (Citation2015) investigated and analysed the impact of distributed PV penetration on low-voltage distribution networks (Dubey, Santoso, and Maitra Citation2015). The authors demonstrated that the impact of PV penetration varied for the same penetration of PV systems. These results are due to differences in the integration location and PV size.
In 2017, Dubey et al. developed a Monte Carlo-based large-scale distributed PV capacity determination method by providing mathematical formulas and a time-series analysis framework (Dubey and Santoso Citation2017). One hundred Monte Carlo simulations with 50 customer penetration levels were designed for each scenario. A 2% increase in each penetration level was allowed. Ding and Mather (Citation2017) also used a distribution-pattern approach (Dubey and Santoso Citation2017) and applied 100 penetration scenarios with 50 customer penetration levels (Ding and Mather Citation2017). These authors used an observation time span of four hours, from 10:00 to 14:00, and 17 real feeders were used in the distribution system. Bletterie et al. (Citation2017) determined the distributed PV hosting capacity in four scenarios (Bletterie et al. Citation2017): even distribution of PV along the feeder, increased distribution from the feeder source to the feeder ends, decreased distribution from the feeder source to the feeder ends, and distribution around the feeder ends. The results showed that the descending deployment scenario from the feeder source to the feeder end provided the highest hosting capacity, whereas deployment around the feeder end provided the lowest hosting capacity. Bollen and Rönnberg (Citation2017) proposed a method for determining PV hosting capacity by analysing a specific time series that represents the minimum load consumption (Bollen and Rönnberg Citation2017).
Torquato et al. (Citation2018) conducted a study on the determination of the distributed PV hosting capacity using a penetration level approach (Torquato et al. Citation2018). The study was conducted by varying the penetration level from 20% to 100% with increments of 20%. The authors used these procedures to illustrate the distributed PV systems and the PV hosting capacity obtained for each percentage. The distributed PV penetration process was random and conducted repeatedly, with an increase in the PV power of 1 kW for each customer penetration level. Five hundred scenarios were conducted for the PV locations at each level of the additional distributed PV systems. The observation period of two hours was selected from 11:00 to 13:00 with surveillance intervals of 15 min. This study showed that the capacity for distributed PV hosting can be observed from the percentage of customer penetration levels. The higher the level of customer penetration, the greater the PV hosting capacity, and the greater the percentage of overvoltage violations. Vergara et al. (Citation2020) randomly determined the location of PV integration until all customers had installed PV systems (Vergara et al. Citation2020). For each penetration process, a time-series-based power flow was executed. The hosting capacity was determined based on violations of the operating limits. These operating limits were represented by the rated voltage and load index.
Under high PV penetration, a battery energy storage system (BESS) has become popular for mitigating the observed voltage increases. The number of large-scale BESSs in the US was 163 at the end of 2019, with 1688 MWh of energy that could be stored, an increase of 28% from 2018 (US Energy Information Administration August Citation2021). Therefore, several studies have proposed improving hosting capacity using BESS (Akeyo et al. Citation2020; Alzahrani, Alharthi, and Khalid Citation2019; Nor et al. Citation2017; Rallabandi et al. Citation2019; Yang et al. Citation2018) without a stochastic approach for the PV penetration model. Consequently, the impact of BESS on improving the hosting capacity of highly distributed PV systems with their uncertainty and variability characteristics is still questionable. In 2022, a stochastic Monte Carlo-based PV hosting capacity prediction method (Atmaja, Sarjiya, and Putranto Citation2022) with BESS implementation was developed. Consequently, more PV systems could be accommodated on the distribution grid. However, both the Monte Carlo-based PV penetration model without BESS implementation (Ding and Mather Citation2017; Dubey and Santoso Citation2017) and that with BESS implementation require a heavy computational load to achieve the desired accuracy (Atmaja, Sarjiya, and Putranto Citation2022). The purpose of BESS implementation was to strengthen the distribution grid after PV penetration. In addition, a better estimate of the hosting capacity provides a better understanding of the distribution grid conditions under the high penetration of low-voltage PV systems, thus leading to more appropriate actions to strengthen the distribution grid. Therefore, better accuracy of stochastic PV hosting capacity prediction for PV penetration with BESS implementation is required without imposing a large computational burden.
1.2. Research contributions
Previous research found it difficult to obtain the expected accuracy of hosting-capacity prediction to prevent disturbances caused by large-scale, distributed PV penetration. Although deterministic approaches provide high accuracy, they are difficult to implement in large distribution networks. By contrast, the stochastic Monte Carlo approach outperforms the deterministic approach for large and complex distribution networks. However, the Monte Carlo approach requires a high computational load to achieve the desired accuracy. For practical implementation in real cases, a cost-effective simulation is required to deal with the large PV penetration. Therefore, we propose a stochastic Markov-chain-based PV hosting-capacity prediction method, together with BESS implementation, to obtain the expected accuracy without a high computational load for high PV penetration.
The two PV penetration models are presented in . (a and b) show the key characteristics of the Monte Carlo-based PV penetration model (Dubey and Santoso Citation2017) and the proposed Markov-chain-based PV penetration model (Atmaja, Sarjiya, and Putranto Citation2022; Bollen and Rönnberg Citation2017; Ding and Mather Citation2017; Torquato et al. Citation2018), respectively. Various studies have proposed the Monte Carlo-based PV penetration model without considering the BESS (Bollen and Rönnberg Citation2017; Ding and Mather Citation2017; Dubey and Santoso Citation2017; Torquato et al. Citation2018). Atmaja, Sarjiya, and Putranto (Citation2022) investigated the performance of the BESS in improving hosting capacity using the Monte Carlo approach (Atmaja, Sarjiya, and Putranto Citation2022). In this study, we developed a PV hosting capacity prediction method based on the Markov chain method for high PV penetration using BESS.
Figure 1. PV penetration model based on (a) Monte Carlo (previous studies) and (b) Markov chain (proposed study).
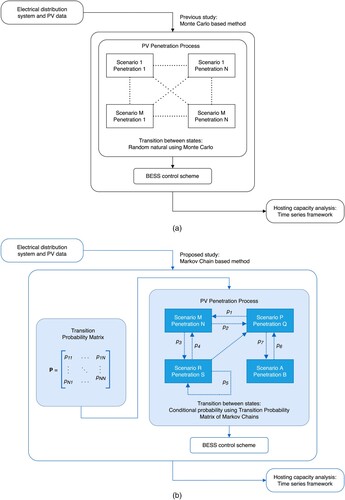
The stochastic PV hosting capacity was predicted in three stages. In the first stage, an electrical distribution network model was constructed, and the required data were acquired. Subsequently, a stochastic model was constructed with respect to the uncertainty and variability characteristics. In the final stage, the hosting capacity was analysed using a time-series framework. As shown in , the action sequences are arranged differently in the Monte Carlo and Markov chains when modelling PV penetration. The Markov Chain approach requires a transition probability matrix prior to simulating PV penetration. The matrix provides the current state with a guideline for moving to the next state. The Monte Carlo simulations of PV penetration are performed in a random, natural manner, whereas the Markov chain approach moves with conditional probability (Ching and Ng Citation2006; Gilks, Richardson, and Spiegelhalter Citation1996; Privault Citation2013). The performance of the Markov chain and Monte Carlo approaches in estimating the PV hosting capacity is compared in this study, thereby allowing the substantial contribution of the proposed method to be quantified.
In summary, the main contributions presented in this paper are as follows:
PV hosting capacity prediction using a Markov chain-based PV penetration model to improve accuracy without incurring a heavy computational load.
A validation study comparing the proposed Markov chain method and the previous Monte Carlo method to predict the PV hosting capacity.
1.3. Paper organisation
Section 2 describes the proposed method for predicting the PV hosting capacity based on the Markov chain approach. The formulation of the problem and procedures for the proposed method are included in this section. Section 3 presents and discusses the results obtained. Finally, the conclusions are presented in Section 4.
2. Proposed PV hosting capacity prediction method
The integration of PV in a low-voltage distribution grid is difficult to predict because connection requests and consumption behaviours depend on individual customers. Deterministic PV hosting-capacity techniques often tend to overestimate the results because of deterministic choices for the size and location of the PV system. Stochastic approaches that represent a phenomenon that evolves uncertainly and exhibits probable characteristics must be used to achieve a more accurate prediction of the PV hosting capacity. However, the stochastic Monte Carlo approach requires a large computational load to obtain the desired accuracy for PV hosting capacity prediction (Dubey and Santoso Citation2017).
To address the accuracy problem mentioned above, this section describes the proposed PV hosting capacity prediction method using a Markov chain. This procedure is illustrated in (b). It begins by describing the feeder under consideration, followed by the required data, a PV penetration model based on the Markov chain, and an algorithm. This algorithm describes the practical procedures for the proposed PV hosting capacity prediction method using the Markov chain approach.
2.1. Electrical distribution system and PV data
An IEEE 123-bus test feeder was used to simulate the random nature of the solar penetration. shows the configuration of the distribution network. Detailed information regarding the test feeder is provided in the IEEE report (IEEE Power & Energy Society Citation2014). In the IEEE 123-bus test feeder, all load buses are considered candidates for connecting PV systems. A customer is selected using the Markov chain, and its PV system is connected to the feeder. These procedures are called penetration processes, and they are iteratively performed until an overvoltage violation is observed.
Figure 2. IEEE 123-bus test feeder.
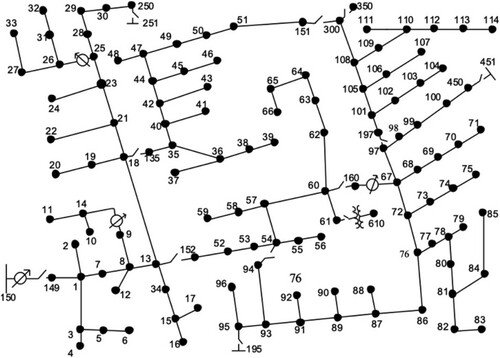
Several PV penetration scenarios were simulated by introducing random variations in the constructed Markov chain concerning the location and size of the PV with respect to the customer’s load to accurately investigate the impact of the rooftop PV system. The construction of the Markov chain is provided later. From the 91 customer loads on the IEEE 123-bus test feeder, a random location was selected as the customer to connect the PV system to the feeder.
To consider the variability characteristics of the PV penetration simulation, a time-series framework was used to quantify the PV output and load demand. To calculate the PV output and predict the hosting capacity, all variations in solar irradiance curves for one year were considered. Furthermore, the variation in load demand on the distribution grid must be considered. Because the load demand curve varies with the behaviour of customer consumption, load demand curves for a one-year period were used. Each load demand curve is presented as a time series to show the fluctuation in the load demand over time. The PQ load was assumed to demonstrate typical residential load consumption. A 1-minute time resolution was utilised to examine how the PV output and load demand variation would affect the operational performance of the distribution network.
To consider the characteristics of uncertainty, the PV systems were randomly connected to a distribution grid. Unlike the Monte Carlo approach, which randomly assigns PV penetration scenarios in a natural manner, the proposed Markov chain-based method uses a transition probability matrix to characterise the pattern of PV penetration. This is challenging when applying the Markov chain. Transition probabilities were calculated from historical PV installations data. Installed PV system data from the California Solar Initiative was sampled to form a probability mass function (PMF) for residential rooftop PV systems. The PMF is used to determine the size of each PV system. The actual penetration of the PV system was considered in the PV penetration simulation using PMF.
2.2. Transition probability matrix and PV penetration process
In the Markov chain developed in this study, the transition probability matrix defines the matrix containing the transition probabilities. Each transition probability in the matrix is necessary to determine the one-step transition from the current state to the next state in all the PV penetration processes. The formula used to create a one-step transition in the transition probability can be described as:
(1)
(1) where
is the transition probability that determines the transition from state a to state b,
is the probability function of the next state when the previous state is known,
is the current state of the customer with PV,
is the next state of the customer with PV,
is the event of the current state of the customer with PV, and
is the event of the next state of the customer with PV.
To determine the parameters of the Markov chain in Equation (1), we used rooftop PV penetration projects from the California Solar Initiative. Because the Markov chain is characterised sequentially, the PV sizes of the 9419 rooftop PV penetration projects were sorted by the date of installation. In the sorted PV cell size data, EquationEquation (1(1)
(1) ) was repeated to obtain the transition probability
. For example, the size of the current PV system is 4 kW. Suppose that the data show that it moves to 3 kW three times and to 5 kW once. Therefore, the transition probability (
) to obtain 3 kW, given 4 kW is 0.75, and 0.25 is to 5 kW. This procedure was performed for all the rooftop PV penetration projects of the California Solar Initiative.
In the PV penetration process based on the Markov chain approach, it is necessary to create a matrix that contains all transition probabilities. This is called the transition probability matrix, and is expressed as follows:
(2)
(2) where
is the transition probability matrix of the Markov chain and the elements are the transition probabilities calculated from Equation (1).
The parameters in matrix P were determined by inserting the transition probabilities previously calculated using EquationEquation (1(1)
(1) ). In other words, the results of EquationEquation (1
(1)
(1) ) are arranged as elements of matrix P. For example, we have
. This indicates the transition probability of moving from state 2 to state 1: The transition probability matrix,
, is an N × N matrix for N states. We created four states for PV-penetration projects of up to 10 kW as PV-penetration scenarios characterise PV-penetration projects from the California Solar Initiative. Characterisation of photovoltaic (PV) penetration projects is important because these projects have a large amount of data. Although we used the PV penetration projects of the California Solar Initiative as a case study, Equations (Equation1
(1)
(1) ) and (Equation2
(2)
(2) ) can be used to create a transition probability matrix with the corresponding PV penetration characteristics for any particular country.
Additionally, for other cases or countries, the number of states may vary, depending on the actual issues that appear in the considered cases. Each Markov state represents a particular category of PV size that is equally divided from PV-penetration projects to provide uniform probability among the categories. The PV sizes of the California Solar Initiative were assigned for each penetration process to provide an actual representation of the PV penetration. These states are listed in . Each row of the matrix represents the current state of the PV penetration process, and each column represents one of the N potential states for the next time step according to EquationEquation (2(2)
(2) ). Because all the probabilities that could occur were equal to one, the sum of the transition probabilities of every row was equal to one.
Table 1. States of Markov chain constructed.
2.3. Algorithm
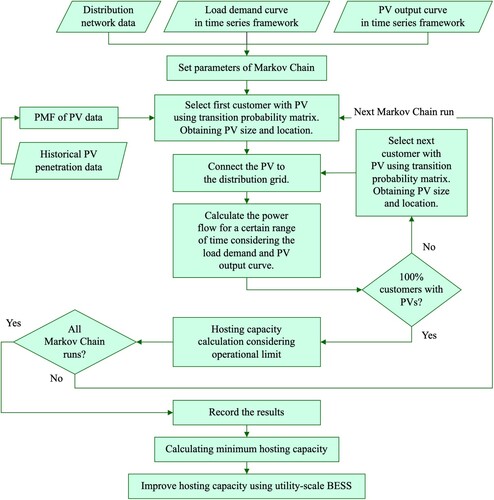
The proposed PV hosting capacity prediction method based on a Markov chain process is shown in . Markov chain simulations were performed until a Gaussian distribution of the hosting capacity results was obtained. Furthermore, until any violation of the operating limit was observed, numerous PV systems were connected to the feeder. To implement this algorithm with other operational limits for different feeders or cases, it has been presented in detail as follows:
Acquire the data required.
A distribution network model was constructed to calculate the power flow. In this study, a distribution network model was provided in OpenDSS.
Acquire the PV output and load demand data. The one-year PV output data were obtained from the meteorological data of the considered distribution grids. In addition, we obtained one-year load-demand data for the considered distribution grids. Subsequently, both the PV output and load demand data were presented in a time series with a resolution of 1-minute.
Acquire historical PV penetration data. All previous PV-penetration projects were considered in this study. This study uses data from 2000 to 2022 from California, USA. Subsequently, a PMF is created for the data.
Create a transition probability matrix for the historical PV penetration data obtained.
The parameters of the Markov chain were set using Equations (Equation1
(1)
Select the first customer with a PV using the transition probability matrix of the Markov chain. Create variables that contain the current PV size and location.
Connecting PV to the distribution grid. Information regarding the size and location of the PV system obtained in the previous step was used to connect the PV to the distribution grid. Regarding the PV power factor, the lagging power factor of the PV penetration model results in a higher PV hosting capacity than the leading power factor (Atmaja et al. Citationaugust 2019; Atmaja, Sarjiya, and Putranto Citation2021; Ding and Mather Citation2017). However, as stated by Dubey and Santoso (Citation2017), a default PV power factor of one was used (Dubey and Santoso Citation2017). This is because the default PV power factor has the highest active power produced. Therefore, from the customer’s perspective, it provides optimal benefits when the customer wants to sell power to the distribution grid. In summary, although a high PV hosting capacity could be provided by the model with a lagging power factor, it sacrifices the production of active power; thus, less active power is injected into the distribution grid (Atmaja, Sarjiya, and Putranto Citation2021).
The power flow for a specific time range was calculated by considering the load demand and PV output curves. The range for the power flow calculation was determined by considering the analysis framework. In this study, a time range from 07:30 to 16:30 with a 1-minute time resolution was applied. Consequently, for each PV penetration, the load flow was calculated repetitively every 1 min from 07:30 to 16:30. After all the power flow calculations were performed, the results were recorded. Time points outside this range were not considered because there was no solar irradiance outside this range.
Check the number of customers using PVs. If 100% of customers are reached, continue with Step 6. Otherwise, repeat Steps 2–5. For each penetration process, a single customer was selected using the transition probability matrix of the Markov chain. In other words, this study does not implement a percentage that includes several customers with PV for each penetration process, as provided in (Ding and Mather Citation2017; Dubey and Santoso Citation2017; Torquato et al. Citation2018). The reason for this was to investigate the impact of penetration on the distribution grid being studied at a higher resolution.
The hosting capacity was calculated by considering the operational limit of the overvoltage. Because previous studies have claimed that overvoltage is the most sensitive constraint in the field of hosting capacity (Atmaja, Sarjiya, and Putranto Citation2022; Ayres et al. Citation2010; Ding and Mather Citation2017; Dubey and Santoso Citation2017; Dubey, Santoso, and Maitra Citation2015; Torquato et al. Citation2018), this study employs overvoltage violation as an operational limit to determine hosting capacity. However, by using the framework provided in this study, other operational limitations can be considered for different cases.
Check the number of Markov chain runs. If 100% of the runs are reached, proceed with Step 8. Otherwise, the next Markov chain run is performed. Terminate the Markov chain when the expected accuracy is obtained. In this study, 100 simulations were conducted.
Record hosting capacity results for all Markov chain runs.
The minimum hosting capacity was then calculated. Because there are many hosting capacities, a single hosting-capacity value must be determined. The hosting capacity is described as the maximum PV accommodated by the distribution grid before the first operational violation; thus, the expected hosting capacity is the minimum.
Improved hosting capacity using a utility-scale BESS. In this study, the optimal BESS sizes and locations were provided by Atmaja, Sarjiya, and Putranto (Citation2022) (Atmaja, Sarjiya, and Putranto Citation2022). The BESS locations and sizes were bus 47, bus 108, bus 76, bus 93, bus 64, bus 101, bus 67, and bus 54; and 0.2, 0.4, 0.4, 0.2, 0.2, 0.4, 0.4, and 0.2 MW, respectively.
Figure 3. Algorithm for the proposed method.
2.4. Accuracy measurement
To justify the substantial contribution of this work, the accuracy of the proposed Markov chain is compared with that of the Monte Carlo method in predicting hosting capacity. A mean absolute error (MAE) is calculated using the following formula:
(3)
(3) where
is the mean absolute error,
is the total number of data points,
is the predicted value for ith data point, and
is the expected value for ith data point. This study provides more than one evaluation metric to guarantee a consistent measure. Therefore, we used the root mean square error (RMSE) to validate the performance of the proposed method. The RMSE is defined as
(4)
(4) The accuracy measurement metrics defined in Equations (3) and (4) were used in the validation study. These metrics were used to calculate the error for both the Markov chain and Monte Carlo methods. To interpret the metrics, the lower the MAE and RMSE, the better the accuracy of the PV hosting capacity method.
3. Results and discussion
This section presents the simulation results of the proposed algorithm for predicting the PV hosting capacity with the BESS implementation for the case study described above. The obtained results and a validation study for practical implementation in real cases involving massive PV penetration are then discussed.
3.1. Results of PV hosting capacity prediction
The proposed Markov chain prediction method was applied to predict the PV hosting capacity in the case study described above. To perform the simulation, a transition probability matrix was constructed. The matrix is calculated using Equations (1) and (2):
The transition probability matrix for the case study is as follows: As described above, matrix P was constructed for a specific case study. To predict the hosting capacity for the second case, a new transition probability matrix must be constructed using Equations (1) and (2).
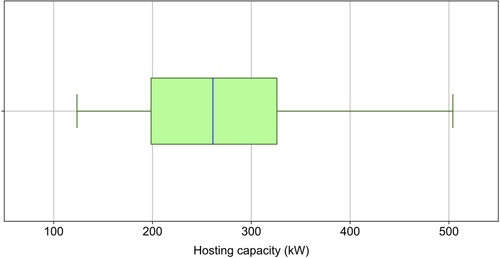
Consequently, 100 Markov chain simulations were performed to obtain the hosting capacity results; thus, the simulations produced 100 hosting capacities. For each Markov chain simulation, hundreds of PV penetrations with different patterns are performed. The patterns varied with different PV cell sizes and integration locations. Different PV locations have different effects on the distribution system, even when the PV size is the same. Conversely, the same PV locations with different PV cell sizes had different effects on the distribution network. The distribution of the 100 PV hosting capacities is presented in . The hosting capacity ranges from 123.58 to 503.99 kW, with a mean of 264.75 kW and a median of 261.17 kW. As described above, the expected hosting capacity was obtained by calculating the minimum hosting capacity. In this study, the minimum host capacity was 123.58 kW. This value implies that after the distribution grid receives a power of 123.58 kW, additional PV connection requests on the IEEE 123-bus must be prohibited to prevent overvoltage violations.
Figure 4. PV hosting capacities for all Markov chain simulations.
In addition, the IEEE 123-bus system has four voltage regulators that compensate for the test distribution network. The impact of the voltage regulators on the IEEE 123-bus test feeder was limited to a particular location because they were placed in a few particular line segments, such as segments 150–149, 9–14, 25–26, and 169–147 of the IEEE 123-bus test feeder. Consequently, some of the voltages decreased as PV penetration levels increased. However, this condition rarely occurred because the penetration of the PV system continued to increase. This is because several capacitor banks were coupled to buses 83, 88, 90, and 92 on the IEEE 123-bus test feeder. Consequently, before the PV systems are connected to a distribution network, these capacitor banks provide high starting voltages. Furthermore, the observed voltages increase with increasing PV penetration.
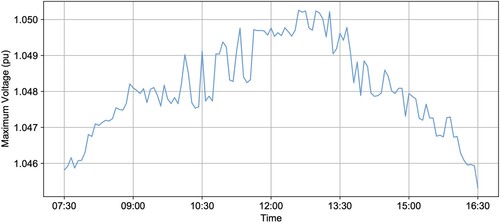
It is also necessary to discuss the impact of PV penetration on hosting capacity. The higher the number of PVs connected to the feeder, the higher the voltages observed along the feeder. This occurs because the highest injected power from the on-grid PV systems occurs around noon, when the consumption of electrical power is at its minimum. In this study, we considered a one-year period of solar irradiance and load demand curves. illustrates how the impact of the PV systems on the bus voltage varies over time. This figure shows the time-series impact of a particular PV penetration level on the maximum voltage for a single day of solar irradiance and load demand in August. As a one-year period is considered, the values vary widely among the curves; therefore, the impact of PV penetration will also vary. The variability of solar irradiance and load demand highlights the importance of considering time-series analysis in hosting capacity.
Figure 5. The time-series impact of solar irradiance and load demand during August on maximum voltages.
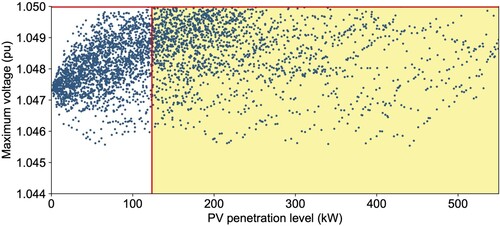
In addition to the overvoltage boundary, the number of PV systems that can be accommodated by feeders are limited. This condition is illustrated in . The figure shows that the higher the PV penetration level, the higher the maximum voltage observed along the distribution network. The maximum voltage is defined as the highest voltage for all buses and times during the period under consideration. The maximum voltage was higher than 1.05 pu when the PV penetration level was higher than 123.58 kW. The addition of an on-grid PV installation increases the bus voltage throughout the distribution network. The power delivered by connected PV systems causes a voltage increase. A very high level of distributed generation is produced because of the penetration of photovoltaic (PV) systems into distribution networks. Despite providing only a few kW of active electricity per generation to be injected into the distribution network, distributed PV systems have a significant influence on increasing voltages. In this case, the overvoltage boundary restricts the number of PV systems that the distribution network can accommodate.
Figure 6. Impact of the increase of PV penetration on maximum voltage.
Nevertheless, the implementation of the BESS curtailed the high PV power injected into the distribution under high solar irradiance and low load demand. Consequently, the charging state of the BESS reduces the increase in voltage observed along the distribution network. To improve the hosting capacity of the system and accommodate more PV penetration, eight utility-scale BESSs were distributed along the feeder. The hosting capacity after the implementation of the BESS was 3676.4 kW (). The overvoltage caused by the high penetration of PV was reduced as a result of the BESS charge capabilities. In this case, the BESSs curtailed the PV power injected into the distribution grid while in a charging state. Furthermore, the distributed placement of BESSs leads to the distributed condensation of the electrical current flowing throughout the distribution grid. Consequently, this situation had a less significant impact on the bus voltages.
Table 2. PV hosting capacity results.
To analyse the impact of the incremental setting of PV penetration, its impact on PV hosting capacity prediction between the proposed Markov chain and the Monte Carlo approaches is examined. Unlike previous studies (Dubey and Santoso Citation2017; Torquato et al. Citation2018), and (Ding and Mather Citation2017), which used the number of PV customers as a percentage for each penetration process, in this study, each penetration process was assigned a single PV customer. When a higher penetration resolution is achieved, the impact of each PV penetration on the considered distribution grid can be investigated. As a result, a more representative model was provided. This arrangement could be implemented in this study owing to the transition probability matrix of the Markov chain. This arrangement of a single customer per penetration process is difficult to implement in the Monte Carlo-based hosting capacity prediction method because the simulation suffers from a large computational load. A validation study was conducted to confirm this analysis.
3.2. Validation study
The previous Monte Carlo-based PV hosting-capacity prediction method required a large number of computations to obtain the desired accuracy (Atmaja, Sarjiya, and Putranto Citation2022; Ding and Mather Citation2017; Dubey and Santoso Citation2017). This limitation needs to be addressed so that PV hosting capacity prediction can be used practically in actual situations. A validation study was required to compare the performance of the Markov chain-based PV hosting capacity prediction method to that of Monte Carlo simulations. The same distribution grid as the one in the PV penetration scenarios was used in the validation study. The PV hosting capacity prediction method using the Monte Carlo model was used for comparison because it is claimed to be the best model for representing the uncertainty and variability characteristics of PV penetration. The deterministic method is difficult to implement in actual cases because many distribution grids have complex and large topologies (Mulenga, Bollen, and Etherden Citation2020). Therefore, a deterministic approach was not used for comparison in this validation study. Furthermore, to quantify the importance of this work, a comparison of the proposed PV hosting capacity prediction method with a Markov chain and that with Monte Carlo will be performed after the implementation of the BESS.
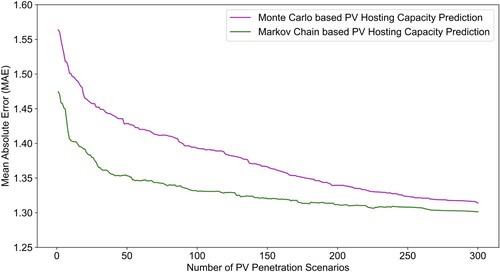
A validation study will be performed based on the accuracy evaluation. This was achieved by comparing the differences between the Monte Carlo and Markov chain-based hosting-capacity prediction methods. For this purpose, the MAE formula provided in EquationEquation (3(3)
(3) ) was used The results are shown in . For the same MAE, the Markov chain required lower PV penetration scenarios. This means that the Markov chain requires a lower computational load than the Monte Carlo method to obtain the same accuracy as represented by the MAE. We performed 300 Markov-chain simulations. For the 300 scenarios, the Markov chain always produced a lower MAE for all PV penetration scenarios. The main difference between the Monte Carlo and Markov chain-based hosting capacity prediction methods lies in how they move from the current state of PV integration to the next state. In Monte Carlo simulations, the transitions between states are performed randomly. This is the reason for the large number of computations required. The Markov chain approach, on the other hand, uses a transition probability matrix generated from historical PV project data. Consequently, a cost-effective simulation could be conducted.
Figure 7. MAE comparison of Monte Carlo and Markov chain for PV hosting capacity prediction.
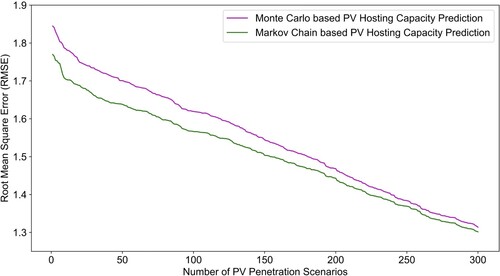
As described previously, this study offers two assessment metrics for consistency. In addition to MAE, we employed RMSE to support the efficacy of the proposed method. The RMSE results for the Markov chain and Monte Carlo methods are shown in . The RMSE for both the Markov chain and Monte Carlo simulations decreased with an increasing number of PV penetration scenarios. The RMSE for the 300 PV penetration scenarios for the Markov-chain-based PV hosting capacity prediction was always less than that for the Monte Carlo method. The Markov chain required fewer PV penetration scenarios than the Monte Carlo method to obtain the same accuracy, as represented by the RMSE. Compared with the MAE results, the RMSE results had higher values and decreased faster. This indicates that the RMSE has a higher weight for large errors. According to EquationEquation (4(4)
(4) ), this is caused by the square root of the average squared error of the RMSE. As the number of PV penetration scenarios increased, the error difference between the Monte Carlo and the Markov chain is reduced ( and ). According to this trend, for a specific number of PV penetration scenarios, the errors are very close to each other. Therefore, the RMSE confirms the results of the MAE. The PV hosting capacity prediction method using the Markov chain for high PV penetration with BESS has better accuracy than that using the Monte Carlo method.
Figure 8. RMSE comparison of Monte Carlo and Markov chain for PV hosting capacity prediction.
Furthermore, the accuracy of the proposed method can be explained by the arrangement of the time observation framework. Owing to fluctuations in the PV output and load demand, a single observation time point is not adequate to provide the desired PV hosting capacity. However, it is challenging to establish a direct connection between the PV hosting capacity and PV penetration scenarios because the hosting capacity results are the consequence of several different variables. Therefore, a time-series observational framework was required. Unlike a single observation time point, time-series observations consider many time points with high time resolution. Dubey and Santoso (Citation2017) proposed a time-series analysis framework with hourly time resolution for PV hosting capacity prediction (Dubey and Santoso Citation2017). However, the hourly time resolution does not allow for the observation of PV penetration impacts lasting less than 1 h. This study used a time-series observation framework with a time resolution of 1 min to address this issue. Both the power flow and operational limit evaluations were calculated every 1 min, as was the time resolution. As a result, performance can be properly analysed at high observation time resolutions.
4. Conclusion
The development of a PV hosting capacity prediction method is important to provide the electrical distribution planner with recommendations to deal with the rapid growth of PV connection requests. However, this method should only be implemented in actual cases. For this reason, in addition to having acceptable accuracy, the method must also be cost-effective.
For accuracy as well as cost-effectiveness, we proposed a PV hosting-capacity prediction based on the Markov chain approach for high-PV penetration and utility-scale BESS. The results demonstrated that a hosting capacity of 123.58 kW was obtained. It will increase to 3676.4 kW when the BESS is installed on the distribution grid under study. The higher the number of PV systems that penetrate the distribution grid, the higher the voltages observed. Therefore, the voltage must be reduced to increase the hosting capacity. BESS implementation could significantly increase the hosting capacity by reducing the voltage. An increase in the hosting capacity increases the number of PVs that the distribution network can accommodate.
A validation study was conducted to confirm the proposed method. A comparison between the Monte Carlo and Markov chain-based hosting capacity prediction methods is presented. For each PV penetration scenario of the Markov chain-based method, the MAE decreases. The key distinction between Markov chain and Monte Carlo-based hosting capacity prediction methods is how they move from one state of PV integration to the next. This technique addresses the difficulty of the stochastic process by reducing the number of simulations without compromising accuracy. Transitions among states were performed randomly using the Monte Carlo method. This explains why the Monte Carlo simulation requires numerous calculations. In contrast, to obtain a cost-effective simulation, the Markov-chain-based method uses a transition probability matrix created using data from previous PV projects.
As the proposed Markov chain chooses the next customer with PV based on a specific pattern characterised by the transition probability matrix, the simulation results provide representative patterns of actual PV penetration. Therefore, the patterns help the electrical distribution planner determine more appropriate strategies to mitigate disturbances caused by PV penetration. In summary, this study contributes to a cost-effective simulation to predict the PV hosting capacity with a utility-scale BESS by providing a comprehensive study that includes state-of-the-art Markov chain modelling, a case study, and a validation study.
Disclosure statement
No potential conflict of interest was reported by the author(s).
Additional information
Funding
References
- Abdelkader, M. A., Z. H. Osman, and M. A. Elshahed. 2020. “New Analytical Approach for Simultaneous Feeder Reconfiguration and DG Hosting Allocation in Radial Distribution Networks.” Ain Shams Engineering Journal 12 (2): 1823–1837.
- Abreu, J., N. Wingartz, and N. Hardy. 2019. “New Trends in Solar: A Comparative Study Assessing the Attitudes towards the Adoption of Rooftop PV.” Energy Policy 128:347–363. https://doi.org/10.1016/j.enpol.2018.12.038.
- Akeyo, O. M., V. Rallabandi, N. Jewell, and D. M. Ionel. May 2020. “The Design and Analysis of Large Solar PV Farm Configurations with DC-connected Battery Systems.” IEEE Transactions on Industry Applications 56 (3): 2903–2912. https://doi.org/10.1109/TIA.2020.2969102.
- Alzahrani, A., H. Alharthi, and M. Khalid. December 2019. “Minimization of Power Losses through Optimal Battery Placement in a Distributed Network with High Penetration of Photovoltaics.” Energies 13 (1), https://doi.org/10.3390/en13010140.
- Andresen, M., G. Buticchi, and M. Liserre. 2016. “Thermal Stress Analysis and MPPT Optimization of Photovoltaic Systems.” IEEE Transactions on Industrial Electronics 63 (8): 4889–4898. https://doi.org/10.1109/TIE.2016.2549503.
- Atmaja, W. Y., Sarjiya, and L. M. Putranto. 2021. “Evaluation of Reactive Power Control for High PV Penetration on Low-voltage Distribution Network.” In 2021 13th International Conference on Information Technology and Electrical Engineering, ICITEE 2021, 104–109. Institute of Electrical and Electronics Engineers Inc. https://doi.org/10.1109/ICITEE53064.2021.9611863.
- Atmaja, W. Y., Sarjiya, and L. M. Putranto. 2022. “Battery Energy Storage System to Reduce Voltage Rise under High Penetration of Customer-Scale Photovoltaics.” International Journal of Sustainable Energy 41 (11). https://doi.org/10.1080/14786451.2022.2136176.
- Atmaja, W. Y., Sarjiya, L. M. Putranto, and E. Y. Pramono. August 2019. “Hosting Capacity Improvement Using Reactive Power Control Strategy of Rooftop PV Inverters.” In 2019 IEEE 7th International Conference on Smart Energy Grid Engineering (SEGE), 213–217. IEEE.
- Ayres, H. M., W. Freitas, M. C. De Almeida, and L. C. P. Da Silva. 2010. “Method for Determining the Maximum Allowable Penetration Level of Distributed Generation without Steady-State Voltage Violations.” IET Generation, Transmission and Distribution 4 (4): 495–508. https://doi.org/10.1049/iet-gtd.2009.0317.
- Behravesh, V., R. Keypour, and A. A. Foroud. 2018. “Stochastic Analysis of Solar and Wind Hybrid Rooftop Generation Systems and their Impact on Voltage Behavior in Low Voltage Distribution Systems.” Solar Energy 166 (June 2017): 317–333. https://doi.org/10.1016/j.solener.2018.03.063.
- Bletterie, B., S. Kadam, R. Bolgaryn, and A. Zegers. 2017. “Voltage Control with PV Inverters in Low Voltage Networks-in Depth Analysis of Different Concepts and Parameterization Criteria.” IEEE Transactions on Power Systems 32 (1): 177–185. https://doi.org/10.1109/TPWRS.2016.2554099.
- Bollen, M., and F. Hassan. 2011. Integration of Distributed Generation in the Power System. Hoboken: John Wiley & Sons.
- Bollen, M. H. J., and S. K. Rönnberg. 2017. “Hosting Capacity of the Power Grid for Renewable Electricity Production and New Large Consumption Equipment.” Energies (Basel) 10 (9): 1–28.
- Breker, S., A. Claudi, and B. Sick. 2015. “Capacity of Low-voltage Grids for Distributed Generation: Classification by Means of Stochastic Simulations.” IEEE Transactions on Power Systems 30 (2): 689–700. https://doi.org/10.1109/TPWRS.2014.2332361.
- Ching, W.-K., and M. K. Ng. 2006. Markov Chains: Models, Algorithms and Applications. Springer Science + Business Media, Inc. https://doi.org/10.1007/0-387-29337-x
- Comello, S., S. Reichelstein, and A. Sahoo. 2018. “The Road Ahead for Solar PV Power.” Renewable and Sustainable Energy Reviews 92:744–756. https://doi.org/10.1016/j.rser.2018.04.098.
- Conti, S., and S. Raiti. 2007. “Probabilistic Load Flow Using Monte Carlo Techniques for Distribution Networks with Photovoltaic Generators.” Solar Energy 81 (12): 1473–1481. https://doi.org/10.1016/j.solener.2007.02.007.
- Ding, F., and B. Mather. 2017. “On Distributed PV Hosting Capacity Estimation, Sensitivity Study, and Improvement.” IEEE Transactions on Sustainable Energy 8 (3): 1010–1020. https://doi.org/10.1109/TSTE.2016.2640239.
- Dubey, A., and S. Santoso. 2017. “On Estimation and Sensitivity Analysis of Distribution Circuit’s Photovoltaic Hosting Capacity.” IEEE Transactions on Power Systems 32 (4): 2779–2789. https://doi.org/10.1109/TPWRS.2016.2622286.
- Dubey, A., S. Santoso, and A. Maitra. 2015. “Understanding Photovoltaic Hosting Capacity of Distribution Circuits.” IEEE Power and Energy Society General Meeting.
- Electric Power Research Institute. 2012. “Stochastic Analysis to Determine Feeder Hosting Capacity for Distributed Solar PV”.
- Elrayyah, A. Y., M. Z. C. Wanik, and A. Bouselham. 2017. “Simplified Approach to Analyze Voltage Rise in LV Systems With PV Installations Using Equivalent Power Systems Diagrams.” IEEE Transactions on Power Delivery 32 (4): 2140–2149. https://doi.org/10.1109/TPWRD.2016.2594242.
- Emmanuel, M., and R. Rayudu. 2017. “The Impact of Single-phase Grid-connected Distributed Photovoltaic Systems on the Distribution Network Using P-Q and P-V Models.” International Journal of Electrical Power and Energy Systems 91:20–33. https://doi.org/10.1016/j.ijepes.2017.03.001.
- Gilks, W. R., S. Richardson, and D. J. Spiegelhalter. 1996. Markov Chain Monte Carlo in Practice, First. Dordrecht: Springer-Science + Business Media, B.V. https://doi.org/10.2307/2965438.
- Gooding, P. A., E. Makram, and R. Hadidi. 2014. “Probability Analysis of Distributed Generation for Island Scenarios Utilizing Carolinas Data.” Electric Power Systems Research 107:125–132. https://doi.org/10.1016/j.epsr.2013.09.012.
- Gözel, T., and M. H. Hocaoglu. 2009. “An Analytical Method for the Sizing and Siting of Distributed Generators in Radial Systems.” Electric Power Systems Research 79 (6): 912–918. https://doi.org/10.1016/j.epsr.2008.12.007.
- Handayani, K., Y. Krozer, and T. Filatova. 2019. “From Fossil Fuels to Renewables: An Analysis of Long-term Scenarios Considering Technological Learning.” Energy Policy 127:134–146. https://doi.org/10.1016/j.enpol.2018.11.045.
- Hasheminamin, M., V. G. Agelidis, V. Salehi, R. Teodorescu, and B. Hredzak. 2015. “Index-based Assessment of Voltage Rise and Reverse Power Flow Phenomena in a Distribution Feeder under High PV Penetration.” IEEE Journal of Photovoltaics 5 (4): 1158–1168. https://doi.org/10.1109/JPHOTOV.2015.2417753.
- He, M., L. Yang, J. Zhang, and V. Vittal. 2014. “A Spatio-Temporal Analysis Approach for Short-term Forecast of Wind Farm Generation.” IEEE Transactions on Power Systems 29 (4): 1611–1622. https://doi.org/10.1109/TPWRS.2014.2299767.
- Heslop, S., I. MacGill, and J. Fletcher. 2016. “Maximum PV Generation Estimation Method for Residential Low Voltage Feeders.” Sustainable Energy, Grids and Networks 7:58–69. https://doi.org/10.1016/j.segan.2016.06.003.
- IEA. 2022. “Snapshot of Global PV Markets 2022.” www.iea-pvps.org.
- IEEE Power & Energy Society. 2014. “IEEE PES AMPS DSAS Test Feeder Working Group.” Accessed September 21, 2019. http://sites.ieee.org/pes-testfeeders/resources/.
- Inacio, C. O., and C. L. T. Borges. April 2018. “Stochastic Model for Generation of High-Resolution Irradiance Data and Estimation of Power Output of Photovoltaic Plants.” IEEE Transactions on Sustainable Energy 9 (2): 952–960. https://doi.org/10.1109/TSTE.2017.2767780.
- IRENA. 2022. “Renewable Capacity Statistics 2022.” www.irena.org.
- Jin, J., L. Ye, J. Li, Y. Zhao, P. Lu, W. Wang, and X. Wang. May 2022. “Wind and Photovoltaic Power Time Series Data Aggregation Method Based on an Ensemble Clustering and Markov Chain.” CSEE Journal of Power and Energy Systems 8 (3): 757–768. https://doi.org/10.17775/CSEEJPES.2020.03700.
- Kabir, M. N., Y. Mishra, and R. C. Bansal. 2016. “Probabilistic Load Flow for Distribution Systems with Uncertain PV Generation.” Applied Energy 163:343–351. https://doi.org/10.1016/j.apenergy.2015.11.003.
- Karakaya, E., A. Hidalgo, and C. Nuur. 2015. “Motivators for Adoption of Photovoltaic Systems at Grid Parity: A Case Study from Southern Germany.” Renewable and Sustainable Energy Reviews 43:1090–1098. https://doi.org/10.1016/j.rser.2014.11.077.
- Kolenc, M., I. Papič, and B. Blažič. 2015. “Assessment of Maximum Distributed Generation Penetration Levels in Low Voltage Networks Using a Probabilistic Approach.” International Journal of Electrical Power and Energy Systems 64:505–515. https://doi.org/10.1016/j.ijepes.2014.07.063.
- Luthander, R., D. Lingfors, and J. Widén. 2017. “Large-scale Integration of Photovoltaic Power in A Distribution Grid Using Power Curtailment and Energy Storage.” Solar Energy 155:1319–1325. https://doi.org/10.1016/j.solener.2017.07.083.
- Mokryani, G., Y. F. Hu, P. Papadopoulos, T. Niknam, and J. Aghaei. 2017. “Deterministic Approach for Active Distribution Networks Planning with High Penetration of Wind and Solar Power.” Renewable Energy 113:942–951. https://doi.org/10.1016/j.renene.2017.06.074.
- Mortazavi, H., H. Mehrjerdi, M. Saad, S. Lefebvre, D. Asber, and L. Lenoir. 2015. “A Monitoring Technique for Reversed Power Flow Detection with High PV Penetration Level.” IEEE Transactions on Smart Grid 6 (5): 2221–2232. https://doi.org/10.1109/TSG.2015.2397887.
- Mulenga, E., M. H. J. Bollen, and N. Etherden. 2020. “A Review of Hosting Capacity Quantification Methods for Photovoltaics in Low-voltage Distribution Grids.” International Journal of Electrical Power and Energy Systems 115 (February 2019): 105445. https://doi.org/10.1016/j.ijepes.2019.105445.
- Nor, N. M., A. Ali, T. Ibrahim, and M. F. Romlie. November 2017. “Battery Storage for the Utility-scale Distributed Photovoltaic Generations.” IEEE Access 6:1137–1154. https://doi.org/10.1109/ACCESS.2017.2778004.
- Olivier, F., P. Aristidou, D. Ernst, and T. Van Cutsem. 2016. “Active Management of Low-voltage Networks for Mitigating Overvoltages Due to Photovoltaic Units.” IEEE Transactions on Smart Grid 7 (2): 926–936. https://doi.org/10.1109/TSG.2015.2410171.
- Privault, N. 2013. Understanding Markov Chains. http://www.springer.com/series/3423.
- Rallabandi, V., O. M. Akeyo, N. Jewell, and D. M. Ionel. January 2019. “Incorporating Battery Energy Storage Systems into Multi-MW Grid Connected PV Systems.” IEEE Transactions on Industry Applications 55 (1): 638–647. https://doi.org/10.1109/TIA.2018.2864696.
- Reno, M. J., K. Coogan, J. Seuss, and R. J. Broderick. 2016. “Novel Methods to Determine Feeder Locational PV Hosting Capacity and PV Impact Signatures.”
- Santos-Martin, D., and S. Lemon. 2016. “Simplified Modeling of Low Voltage Distribution Networks for PV Voltage Impact Studies.” IEEE Transactions on Smart Grid 7 (4): 1924–1931. https://doi.org/10.1109/TSG.2015.2500620.
- Shayani, R. A., and M. A. G. De Oliveira. August 2011. “Photovoltaic Generation Penetration Limits in Radial Distribution Systems.” IEEE Transactions on Power Systems 26 (3): 1625–1631. https://doi.org/10.1109/TPWRS.2010.2077656.
- Smith, J. (EPRI), M. Rylander (EPRI), M. J. Reno, Robert Broderick, and B. Mather (NREL). 2015. “Alternatives to the 15% Rule – Modeling and Hosting Capacity Analysis of 16 Feeders.”
- Torquato, R., D. Salles, C. O. Pereira, P. C. M. Meira, and W. Freitas. 2018. “A Comprehensive Assessment of PV Hosting Capacity on Low-voltage Distribution Systems.” IEEE Transactions on Power Delivery 33 (2): 1002–1012. https://doi.org/10.1109/TPWRD.2018.2798707.
- US Energy Information Administration. August 2021. “Battery Storage in the United States: An Update on Market Trends.” www.eia.gov.
- Vergara, P. P., M. Salazar, T. T. Mai, P. H. Nguyen, and H. Slootweg. 2020. “A Comprehensive Assessment of PV Inverters Operating with Droop Control for Overvoltage Mitigation in LV Distribution Networks.” Renewable Energy 159:172–183. https://doi.org/10.1016/j.renene.2020.05.151.
- Wang, S., Y. Dong, L. Wu, and B. Yan. 2020. “Interval Overvoltage Risk Based PV Hosting Capacity Evaluation Considering PV and Load Uncertainties.” IEEE Transactions on Smart Grid 11 (3): 2709–2721. https://doi.org/10.1109/TSG.2019.2960335.
- Wang, C., and M. H. Nehrir. 2004. “Analytical Approaches for Optimal Placement of Distributed Generation Sources in Power Systems.” IEEE Transactions on Power Systems 19 (4): 2068–2076. https://doi.org/10.1109/TPWRS.2004.836189.
- Xu, S., M. I. Alhamid, and W. L. Dutre. November 1989. “Reconstruction of Synthetic Meteorological Sequences by Using Markov Transition Matrix for Solar Thermal Simulation.” International Journal of Solar Energy 7 (1): 47–59. https://doi.org/10.1080/01425918908914245.
- Yang, Y., Q. Ye, L. J. Tung, M. Greenleaf, and H. Li. January 2018. “Integrated Size and Energy Management Design of Battery Storage to Enhance Grid Integration of Large-Scale PV Power Plants.” IEEE Transactions on Industrial Electronics 65 (1): 394–402. https://doi.org/10.1109/TIE.2017.2721878.
- Zargar, R. H. M., and M. H. Yaghmaee Moghaddam. 2020. “Development of a Markov-Chain-based Solar Generation Model for Smart Microgrid Energy Management System.” IEEE Transactions on Sustainable Energy 11 (2): 736–745. https://doi.org/10.1109/TSTE.2019.2904436.
- Zubo, R. H. A., G. Mokryani, H. S. Rajamani, J. Aghaei, T. Niknam, and P. Pillai. 2017. “Operation and Planning of Distribution Networks with Integration of Renewable Distributed Generators Considering Uncertainties: A Review.” Renewable and Sustainable Energy Reviews 72 (May 2016): 1177–1198. https://doi.org/10.1016/j.rser.2016.10.036.
