
 ?Mathematical formulae have been encoded as MathML and are displayed in this HTML version using MathJax in order to improve their display. Uncheck the box to turn MathJax off. This feature requires Javascript. Click on a formula to zoom.
ABSTRACT
Egypt’s national development plan aims to diversity energy resources and expand near-zero emission energy (NZEE) generation technologies. The target for NZEE’s share in the Egyptian energy basket is 20% by year 2030. There is a set of NZEE projects on the agenda of the decision-makers that needs reconsideration. This study goal is to assist decision-makers and stakeholders in reprioritising the implementation of these projects based on technical, economic, environmental, and social criteria. Multi-criteria analysis (MCA) was employed to rank five specific projects categorised under pumped storage hydropower, nuclear, clean coal, solar, and wind. The results showed that, for the non-biased set of weights, El Dabaa Nuclear Power Plant took the first rank. It has been also given the first priority according to environment activists’ biased weights. For the social biased weights, Benban Solar Park outranked all the other projects.
Introduction
The Egyptian National Grid supplies about 36.4 million subscribers to meet a peak load of 31.4 GW, with electricity demand growth of 6% (EEHC. Egyptian Electricity Holding Company Citation2019). In 2015, a power generation plan was presented, taking into consideration this exceptionally high demand. This plan called for the expedited installation of 54 GW of additional capacity by 2022 and aimed at raising the NZEE quota of generated energy from 10% in 2014 to 43% by 2022. NZEE shares were allocated as follows: 25% solar and wind energy, 3% hydro resources, 15% clean coal, and 5% nuclear (after 2022) (El-Markabi Citation2015). However, these targets were deviated from due to pressing gap between power demand and supply at this time. Over the last six years, the government made a leap in installed conventional power capacity that accounted for NZEE expansion targets. A total of 28,229 MW was added to the Egyptian National Grid from December 2015 to December 2018, resulting in a total installed capacity of 55 GW. This has been achieved through a 2.7 billion US$ fast-track project that worked on installing 3636 MW of electricity in 8.5 months. In March 2015, another project was signed with Siemens to build 3 mega combined power cycle stations, adding 14,400 MW in 2.5 years. Additional 1850 MW were installed by converting old simple cycle power plants to combined cycle (Egypt Country Commercial Guide Citation2022).
Currently, thermal power generation accounts for more than 90% of the installed capacity. Most of the NZEE projects outlined in the 2015 plan were put on hold and need to be reconsidered and prioritised. These projects are: Benban Solar Park, El Dabaa nuclear power plant, Attaqa pumped storage hydroelectric power plant, Hamrawein clean coal ultra-supercritical, and Ras Ghareb wind farm.
Since energy policies are public policies that involve decision-making affecting the entire nation, their consideration should not be taken lightly. Sustainability of such policies and plans should be guaranteed through methodical energy planning, study, analysis, and reaching agreements among stakeholders. Applying multi-criteria analysis (MCA), as a scientifically based method, to public policy makes it easier to evaluate plans and compare alternative projects in a systematic and efficient manner. This, by itself, does not guarantee that various conflicts and biases present in political decisions will be resolved, but it does act as a negotiation tool that helps stakeholders to reach balanced compromised decisions. Energy planning involves a lot of factors, determining the alternative for decision-makers that best compromises among the technical efficiency, environmental issues, and socio-economic needs. Moreover, the evaluation of energy plans must deal with attributes hard to delineate and elements that may involve both quantitative and qualitative factors.
Afgan and Carvalho (Citation2002) assessed energy systems and rated them based on multi-criteria decision-making (MCDM) procedure. They assumed that the energy system, as a complex entity, interacts with its boundaries by utilising resources, exchanging conversion system products, utilising economic benefits, and absorbing the social cost of the conversion process. In their analysis, they utilised five basic criteria: efficiency (%), installation cost (USD/kW), electricity cost (c/kWh), CO2 emissions (kgCO2 /kWh), and area (km2/kW), to rank ten new and renewable energy plants (options). However, their criteria evaluation was technology-based rather than plant based.
Although Afgan and Carvalho (Citation2002) employed a straightforward aggregative method (weighted summation) to calculate the overall sustainability indicator, they also introduced a complex randomisation technique to determine the weight-coefficient vector under uncertainty.
Demirtas (Citation2013) suggested the use of analytical hierarchy process (AHP) method as an MCDM method for selection among alternative renewable energy (RE) sources. He compared five different sources: solar, wind, hydro, geothermal, and biomass; under four main criteria: technical, economic, environmental and social. Twelve sub-criteria were chosen under the main criteria by 10 management personnel who belong to technical, research, and development departments in the energy sector. The same group of experts assigned weights to each criterion following AHP. They prioritised criteria one-to-one using a nine-point comparative scale. Performing AHP is typically difficult, even when you have a cooperative group of experts, as consistency is not guaranteed. Its difficulty increases as the number of experts (with diverse level and type of experience), criteria, comparison scale points increase.
In 2014 Malik et al. (Citation2014) realised that RE projects cannot compete with conventional energy projects solely on economic grounds. However, the renewable energy projects are likely to be favoured, if externality costs/benefits of competing technologies, such as environmental costs/benefits are carefully calculated and taken into account. They proposed the application of multi-criteria approach to rank alternative RE expansion plans, in one of Oman’s islands where renewable resources can be utilised as a supplementary energy supply. They selected five main criteria with a total of 15 sub-criteria: economic, technical, environmental, planning, and government policy and regulations. Malik et al. (Citation2014) evaluated six alternative RE expansion plans using analytic AHP technique. Only four experts provided their opinions regarding the criteria and sub-criteria weights, as well as qualitative criteria evaluation. The AHP analysis, applied using ‘Expert Choice Comparison’ software, facilitated the evaluation of alternatives using both quantitative (economic) and qualitative (government policy and regulations) criteria.
In 2018 Shaaban et al. (Citation2018) assessed the sustainability of seven electricity generation technologies in Egypt, using multi-criteria decision analysis (MCDA) methodology. They employed AHP for weighing the assessment criteria, and the weighted summation method for generating a general integrated sustainability index for each technology. Hydropower was excluded from the assessment, although there is a large pumping storage hydropower project under consideration by the Egyptian government. Shaaban et al. (Citation2018) selected the typical four main criteria (13 sub criteria): technical, economic, environmental, and social. Because they were comparing the sustainability of technologies that are not exemplified by specific Egyptian projects, almost all of their indicators’ values were obtained from the international literature. Although the title was explicit and the authors were assessing electricity generation technologies in Egypt. The only two indicators that may be country based are job creation and social acceptability. In order to assess the social acceptability, a bi-lingual online anonymous survey was conducted. The dates (years) in which the questionnaire took place were not mentioned. No information about the personnel who did the survey (number, age group, gender, and education) was given, even though the country base of the population was not clear as the survey was web-based. These missing points don’t ensure the validity of the responses and make the final value of the indicator sceptical.
The only country-based indicator (sub criteria) is social acceptability. In order to assess the social acceptability, a bi-lingual online anonymous survey was conducted. The accessibility indicator is calculated based on the answer of interviewees to four questions: level of awareness, general support of the installation in Egypt, how fast the installation should be, and individual concern about closeness to residence location. However, no detailed information about the interviewees sample was provided to substantiate the reliability of the data obtained.
Shaaban et al. (Citation2018) faced difficulties in applying AHP methodology to collect subjective data (weights) via distributing a questionnaire to stakeholders through interviews and emails. Therefore, they used a randomisation technique (Monte Carlo) to assess the technologies ranking under uncertainty. Nevertheless, they applied a classical weights’ sensitivity analysis by adopting irrational biased single-dimension scenarios. It is also worth mentioning that they did not test the ranking sensitivity to different standardisation of the measurement scale (normalisation) formula or aggregation formula other than what they have applied.
All previous past papers, except for Shaaban et al. (Citation2018), assessed energy systems (technologies) and not necessarily under Egyptian conditions. One of the contributions of this manuscript is the evaluation of specific Egyptian projects not technologies. Although Shaaban et al. (Citation2018) considered Egyptian conditions, they assessed seven electricity generation technologies not projects.
In this study, MCA is employed to reprioritise the implementation of five NZEE-specific projects that have been postponed or put on hold by the Egyptian Ministry of Electricity. These projects are categorised under solar, nuclear. hydropower, clean coal, and wind technologies. The analysis is based on technical, economic, environmental, social criteria, and planning objectives.
On the methodological side, this research aims at investigating and analyzing the effects of score normalisation and aggregation formulas on the overall projects’ ranking (priorities). Additionally, criteria weights are subjected to sensitivity analysis considering different decision makers’ and stakeholders’ perspectives to facilitate their dialogue and reach informed, compromised decision.
The manuscript is organised into five sections. After the introduction, a brief description of each project under consideration is provided. The third section explains the adopted methodology for each step of the MCA: criteria selection, performance assessment (scores), scores standardisation, weights’ assignment, and aggregation formula. Section four discusses the results of applying MCA technique to determine the projects’ implementation priority, as well as the results of the sensitivity analysis. The last section includes conclusions and recommendations.
Analysed projects
Benban Solar Park (SP) (NREA. New and Renewable Energy Authority Citation2016)
A 37.2 km2 plot of land located in Benban, Markaz Daraw of Upper Egypt (the Benban PV site) was allocated by the Egyptian government to the New and Renewable Energy Authority (NREA). The site has been divided into 41 separate but contiguous plots available to developers/companies to implement individual projects (the Benban Projects) by NREA. NREA will sign long-term (25 year) agreements with private companies prior to construction and operation. Benban will be the world’s largest solar PV Park, at an estimated total cost of 4 billion US$, once constructed.
The 41 solar photovoltaic plants (projects), with a total installed capacity of 1.8 GW will be connected to the Egyptian high voltage network through four new substations, which will be built by the Egyptian Electricity Transmission Company (EETC). An existing 220 kV line that passes nearby the Benban Site at a distance of approximately 12 km will, in turn, connect to these substations. Meanwhile, NREA will prepare site access roads and on-site roads for the project area.
The distance from Benban to Cairo is approximately 650 km, and to Aswan is 40 km. According to the Egyptian Environmental Affairs Agency (EEAA), the normal environmental and social approval, as well as seeking financial support from international financial institutions, will have to be completed by the developers of the Benban Projects.
El dabaa nuclear power plant (DNPP) (El-Dabaa NPP Project Citation2022)
There were many years of Egyptian effort to introduce nuclear power in Egypt. The plans for constructing DNPP go back to the late 1970s. El-Dabaa was originally selected as the preferred candidate site in 1980. It is located along the Northern West Coast of Egypt on the Mediterranean Sea. Since then, for more than 40 years, the site has been the issue of detailed studies. Owned and operated by the Nuclear Power Plants Authority (NPPA) of Egypt, the DNPP Project is constructed of four 1200 MWe Pressurized Water Reactor (PWR) units each using the Russian VVER-1200 (AES-2006) design.
In 2017, as part of the application for site approval permit, the site evaluation report and environmental impact assessment report were submitted to the Egyptian Nuclear and Radiological Regulatory Authority (ENRRA). The site approval permit for El-Dabaa was granted in early March 2019.
The progress of El-Dabaa NPP is directly linked with the licensing process that ensures plant safety through the application of legal instruments. NPPA has managed to mitigate the negative impact of COVID-19 pandemic and kept a steady implementation pace.
Attaqa pumped storage hydroelectric power plant (APSHPP)
Approximately 15 km west of Suez, at the northern end of the Red Sea mountain range, APSHPP is located on Attaqa Mountain. The estimated total surface area of the project site is 168,000 m². It will be the first power plant in Egypt to generate electricity using water storage and pumping during peak times. Moreover, it will be one of the first facilities of its kind in the Middle East (2.4 GW).
The implementing agency of the project will be the Hydro Power Projects Executive Authority (HPPEA), under the Government of Egypt’s Ministry of Electricity and Renewable Energy. In June 1998, the design and feasibility studies for the project were approved by HPPEA and the Egyptian Electricity Authority. A memorandum of understanding to build and finance the project was signed in March 2015 by the Government of Egypt and Chinese state-owned Sinohydro Corporation, hence the project development began.
With an estimated 2.7 billion US$ investment, the project is being developed. When compared with other electricity generation technologies, the economic viability of PSHPPs is still questionable (Attaqa Mountain Pumped Storage Power Plant Citation2019), but it is scheduled for commissioning in 2024.
The facility will utilise two water reservoirs (lower and upper). The horizontal distance between the upper and the lower reservoir is expected to be 1450 m, resulting in an effective head of 600 m.
The site consists of six reversible turbines with an overall flow rate of 318 m3/s and a total power capacity of 2100 MW (Abdellatif et al. Citation2018).
The water flow from the upper reservoir will be used to drive the turbines for power generation during peak electricity demand. Similarly, for storage during off-peak periods, the water from the lower reservoir will be pumped back to the upper reservoir.
In 1998 Engineering consultancy firm SWECO undertook the design and feasibility studies for the project for a proposed 2100 MW capacity. The technical feasibility study for the expanded 2.4 GW APSHPP was supported by the Swedish International Development Cooperation Agency (Attaqa Mountain Pumped Storage Power Plant Citation2019).
Hamrawein clean coal ultra-supercritical plant (CC-USP)
It was proposed as a 6600 MW clean coal-fired power station near Hamarawein Port, Egypt. ‘Clean coal’ usually means capturing carbon emissions from burning coal and storing them underground (Everything You Need to Know About Clean Coal Citation2022). The approximate location where the project would have been built is about 150 kilometres south of Gouna. The government overturned the ban on coal imports for industry and power generation in April 2014, leading to the subsequent project plans (Hamarawein IPP coal project Citation2022).
In 2014, Egypt’s cabinet voted to allow coal imports for industrial use. To allow coal-fired power plants, the law was amended again in 2015. In November 2016, the Ministry of Electricity received offers from five companies to establish the coal-fueled power plant in Hamrawein. Memorandums of understanding were signed by Chinese companies with the ministry in 2016 and 2017. The project was scheduled to come on stream in 2023–2024. The Chinese Development Bank offered to fund the establishment of the coal-fired power station for 3.7 billion US$ (Everything You Need to Know About Clean Coal Citation2022).
Egypt’s Ministry of Electricity and Renewable Energy intended to assess the environmental and social impacts of the proposed plant through community consultation sessions. The land allocated for the implementation of the clean-coal plant has already been designated, and all necessary studies have been completed. Additionally, all licenses and approvals required for the project have been obtained. The only step remaining before the actual work of the project commences was community consultation session (Everything You Need to Know About Clean Coal Citation2022). In February 2020, it was reported that the Ministry of Electricity decided to launch a renewable energy project and postpone the construction of the Hamrawein coal plant. The long-term strategic plan that begins in fiscal year (FY) 2018/2019 and ends in FY 2029/2030, includes 135.258 billion US$ for electric power, including 38.6 billion US$ for coal power (Everything You Need to Know About Clean Coal Citation2022).
Ras Ghareb Wind Farm (Ras Ghareb Wind Farm: First Wind Farm in Egypt to Use Grout Citation2022)
This wind farm is a 262.5 MW onshore wind project located near the Gulf of Suez, approximately 30 km north-west of Ras Ghareb, Egypt. It marks the first renewable energy Independent Power Producer (IPP) project of its kind and size in Egypt with total investment of about 0.4 billion US$. IPP projects generate electric power for sale to end users.
In December 2017, the project reached financial closure, and construction started in 2018. When fully operational, it will supply power to approximately 500,000 households. There were certain challenges that needed to be addressed to ensure the wind farm functions effectively, due to climate variations in the area and the uniqueness of the project. Those challenges included wind speed challenges, a tight schedule, and ensuring long durability and sustainability for the entire lifespan of the wind turbine structure.
Methodology
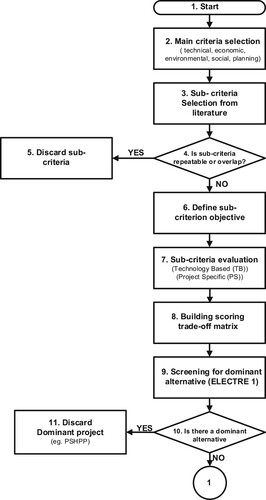
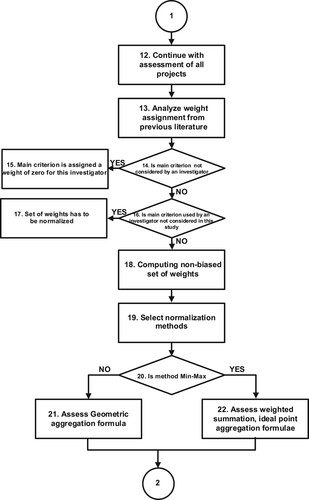
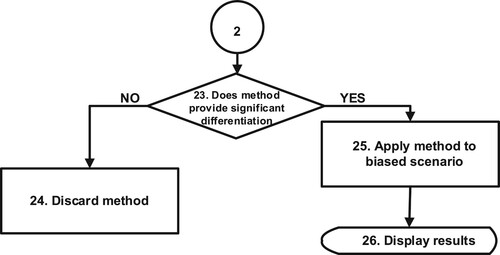
The adopted methodology () encompasses 6 main steps (26 steps all in all with sub-steps) in order to reach a rating or ranking of the alternatives under consideration: (i) criteria selection (steps 3–7), (ii) scoring trade-off matrix (step 8), (iii) screening for dominant alternatives (steps 9–12), (iv) weights’ assignment (steps 13–18), (v) scores’ normalisation (step 19), and (vi) aggregation (steps 20–24). These steps are followed by sensitivity analysis for criteria weights according to economic, environmental, and social biased scenarios (stakeholders’ perspectives) (steps 25 and 26).
Figure 1. Flowchart of adopted methodology.
Criteria selection
Kaya and Kahraman (Citation2010) listed some of the MCDM evaluation criteria that have been used in previously conducted studies on energy issues. These are technical (efficiency, primary energy ratio, reliability, maturity, etc.); economical (investment cost, operation, and maintenance cost, fuel cost, net present value, payback period, service life, equivalent annual cost, etc.); environmental (CO2 emission, NOx emission, SO2 emission, particles emission, land use, noise, etc.) and social (social acceptability, job creation, social benefits, etc.). Other investigators such as Malik et al. (Citation2014), suggested two additional main criteria: planning (capacity credit and time to realisation), and government policy and regulations while ignoring social criteria.
Criteria should address all dimensions of decision-making without repeatability or overlap. Their selection depends on three conditions: technical soundness, socioeconomic relevance, and ability to quantify a specific characteristic of an energy project. However, lack of relevant data may limit the analyst’s selection to build sound trade-off matrix (Handbook on Constructing Composite Indicators Methodology And User Guide Citation2008). In this research, we analysed all the sub criteria used to evaluate similar energy projects or technologies according to the previously mentioned three conditions, as well as the clarity of definition and availability of data. As shown in , the selected criteria are classified under five main categories: technical, economic, environmental, social, and planning. The objective is ‘maximisation’ if the criterion positively contributes to the overall ranking (e.g. job creation), and ‘minimisation’ if it has a negative impact (e.g. CO2 emission). Some criteria are evaluated based on technology type (TB) (e.g. dispatchability, employment, area footprint), while the evaluation of others is project specific (PS) (e.g. nameplate capacity, total value of the project).
Table 1. Selected evaluation criteria.
Sub-criteria definitions and attributes
The fifth column in indicates the source that used the corresponding sub-criteria, or suggested it as an important indicator in the MCDM of different energy-generating technologies/projects.
Technical criteria
Dispatchability of system
A dispatchable source of electricity refers to an electrical power plant that can adjust their power output supplied to the electrical grid on demand in a short period of time (Abdellatif et al. Citation2018). Non-dispatchable renewable energy sources such as wind power and solar photovoltaic (PV) power cannot be controlled by operators. The value of this criteria is binary: 1 for dispatchable sources (El Dabaa NP, Attaqa PSHPP, Hamrawein CC-US) and 0 for non-dispatchable sources (Benban SP, Ras Ghareb WF).
Lifetime (EIA. US Energy Information Administration Citation2015; EIA. US Energy Information Administration Citation2013)
Lifetime is the durability of a power plant in years. The lifetime of the projects under study ranges from 60 years for Eldabaa NP and Attaqa PSHPP to 20 years for solar and wind projects.
Efficiency (EIA. US Energy Information Administration Citation2015; EIA. US Energy Information Administration Citation2013)
Efficiency is the measure of the amount of energy used by an electrical generator or power plant to generate one kWh of electricity. Attaqa Pumped Storage Hydroelectric Power Plant (PSHPP) operates with an efficiency of 75%, which is the highest among all the projects under study. In contrast, the efficiency drops to approximately 17% for Benban SP.
Capacity factor (%)
This is a measure of how often a plant is running at maximum power. Nuclear has the highest capacity factor of any other energy source producing power more than 92% of the time (El Dabaa Nuclear Power Plant Citation2022), followed by coal with a capacity factor of about 70% (Hamarawein IPP coal project Citation2022). For other renewable projects, the capacity factor is about 30% (Abdellatif Citation2016; Benban Solar Park Citation2022; Ras Ghareb Wind Farm: First Wind Farm in Egypt to Use Grout Citation2022).
Economic criteria
Fixed operation and maintenance cost (Fixed O&M) ($/kW-YR) (Abdellatif et al. Citation2018)
Fixed O&M Costs mean the costs incurred to operate and maintain the project in accordance with this project agreement, which are neither capital expenditures nor variable O&M costs. All projects are in the range of 35 $/kW-YR except for El Dabaa NP whose fixed O&M cost is about 95 $/kW-YR.
Non-fuel variable operation and maintenance cost ($/MWh) (Abdellatif et al. Citation2018)
Those include supervision and engineering, coolants and water, steam expenses, Electric expenses, maintenance, structures, reactor and electric plant equipment and miscellaneous expenses. The cost here is minimal for all projects and about 5 $/MWh for Hamrawein CC-USP.
Internal rate of return (IRR) (%)
This indicator refers to the profitability of an investment. The IRR presently ranges in between 15% and 20% (CitationNational Electric Power Regulatory Authority) except for El Dabaa NP whose IRR is relatively low (about 8%) (Kharitonov and Kosterin Citation2017).
Total value of the project (M$)
This involves the capital costs and costs of services procured for the construction of a project. All the projects are in the range of 2–4 $ billion (Abdellatif Citation2016; Benban Solar Park Citation2022; Hamarawein IPP coal project Citation2022) except for El Dabaa NP where the project cost is about 30 $ billion (El Dabaa Nuclear Power Plant Citation2022) and Ras Ghareb WF whose value does not exceed 0.5 $ billion (Ras Ghareb Wind Farm: First Wind Farm in Egypt to Use Grout Citation2022).
Environmental criteria
CO2 emission of the plant (kgCO2/kWh)
This is the amount of CO2 in kg the plant releases to produce 1 kWh (Afgan and Carvalho Citation2002). Hamrawein CC-US has the highest CO2 emission with 0.82 kgCO2/kWh while the other plants range from 0.02 to 0.1 kgCO2/kWh.
Energy return on investment (EROI) (%)
This is a measure of energy return on investment taking into consideration the component’s whole life time. The lowest is for PV technology (4%), while NP has the highest EROI (75%). Coal and PSHP technologies are in the range of 30% (EROI – A Tool To Predict The Best Energy Mix Citation2015).
Heat rate (BTU/kWh)
The heat rate is the amount of energy used by an electrical generator/power plant to generate one kWh of electricity (Abdellatif Citation2016). This indicator only exists for NP and coal technologies in the range of 10,000 BTU/kWh.
Area foot print (km2/ kW)
The land area occupied by the system to generate 1 kWh (Afgan and Carvalho Citation2002) multiplied by an appealing factor given by the author depending on the location of the project as a remote area (0.2) or a recreation appealing area (1).
Social criteria
Employment (jobs//MW)
This indicates the potential jobs that could be created for each type of power system in the construction, installation, manufacturing, O&M, and fuel processing sectors. Hydro shows the highest job creation potential with an average value of 13 jobs/MW whereas coal, NG, and nuclear are below 2 jobs/MW (Shaaban et al. Citation2018). For PSHPP the total jobs created per MW are about 20 jobs/MW (Cambridge Econometrics (DG Energy) Citation2014).
Social acceptability
All stakeholder views and concerns in the decision-making process are guaranteed by social acceptability. This indicator takes into consideration the public sector, which is affected by the project. It represents feedback on the perceived impact of the energy project on landscape. This indicator could be assessed qualitatively through surveys and public hearings with the local community.
Shaaban et al. (Citation2018) conducted a bilingual online anonymous survey in order to assess social acceptability. Wind projects had the highest score (30), followed by PV projects and hydropower (Bronfma et al. Citation2015). The lowest scores were attributed to coal projects, followed by nuclear with a score of about 10.
Planning criteria
Nameplate capacity (MW)
Nameplate capacity, also known as the rated capacity, nominal capacity, installed capacity, or maximum effect, is the intended full-load sustained output of a power station. The largest project capacity is for Hamrawein CC-US (6600 MW) (Hamarawein IPP coal project Citation2022) and the least is for Ras Ghareb Wind Farm (262.5 MW) (Ras Ghareb Wind Farm, Ras Ghareb, Egypt Citation2022). The rest of the projects lie in the range of 1700–5000 MW (Abdellatif et al. Citation2018; Benban Solar Park Citation2022; El Dabaa Nuclear Power Plant Citation2022).
Grid connection (km)
This indicator refers to the location of the electrical power plant to a distribution point in the Egyptian unified grid (CitationEgyptian Grid Map). For Attaqa PSHPP there is a 5000 V transmission line in Attaqa so the distance is minimal set to be 0.5 km. Ras Ghareb WF is the most distant from any grid connection, 93 km from the nearest distribution point and all the other projects range from 20 to 50 km.
Scoring tradeoff matrix
Scoring is simply the evaluation of each project performance under specific criteria, which could be quantitative (objective) or qualitative (subjective). Ideally, evaluation of the performance under specific criteria should be carried or calculated for each project. Scores of some criteria such as IRR, total value of the project, or distance to grid connection have been made available through the project documents or web page; and they are called project specific (PS). When the scores of the selected criteria are not available for the projects under consideration, they were acquired based on the technology type adopted from international energy organisation reports; and they are called technology based (TB). indicates If the evaluation criteria is PS or TB.
While references from which scores are obtained listed in the ‘Sub-criteria Definition and Attributes’ section. Some of the criterion scores in were taken directly from the listed reference without modification or adjustment. While others were operated to better fit the Egyptian socio-economic context.
Table 2. Scored Tradeoff Matrix.
Screening for dominant alternatives
Before jumping to the hardcore analysis and to avoid extra effort, there should be an overall screening to ensure the exclusion of dominant solution as mentioned previously. Questioning the excel of Attaqa PSHPP could be directly derived from the seminal work of Borda (Handbook on Constructing Composite Indicators Methodology And User Guide Citation2008) and ELECTRE I selection method (El Amine, Pailhes, and Perry Citation2014). ELECTRE I is a simple computational procedure (counting). It is used only as pre-analysis procedure (screening) to weed the dominant alternative so that the ranking results, of the other more articulate methods of MCA, are not distorted. The method is based on a pair-wise comparison between all indicators of projects considered. For each pair of projects, a concordance index is computed by counting how many individual sub criteria are in favour of each project. In this way, an outranking matrix, the elements of which hold the ‘constant sum property’ is constructed. In our case, the majority threshold (number of individual indicators greater than 50% of the indicators considered) is eight indicators. Typically, the results of this counting procedure are presented in what is called the outranking matrix (a square matrix with zero diagonal elements).
Weighting
One of the key issues in MCA is the choice of the weighting and aggregation formula. Assigned weights have a significant effect on power generation technologies or projects ranking. A number of weighting techniques exist; some are derived from participatory methods like budget allocation processes (BAP), AHP, and conjoint analysis (CA) (Pramangioulis et al. Citation2019).
The AHP method was employed in (Demirtas Citation2013; Malik et al. Citation2014; Shaaban et al. Citation2018). Afgan and Cravalho (Afgan and Carvalho Citation2002) used an initial set of equal weights and then randomised them using a complex technique, to take weights’ uncertainty into consideration. Shaaban et al. (Citation2018) applied AHP to obtain their initial set of weights, rather than starting with an equal set, and approached uncertainty similar to Afgan and Carvalho (Citation2002).
Demirtas (Citation2013), Malik et al. (Citation2014) and Shaaban et al. (Citation2018) have carried out the exercises of obtaining experts/stakeholders opinion on the relative importance (weights) of the main criteria used in ranking similar renewable energy plans or projects. In this research, it was decided to make use of the weights they generated by consolidating the results of their experts/stakeholder consultations. Consolidation is carried out by averaging weights they obtained, and assigning them to the main criteria adopted in this study. refers to weights of main criteria obtained by different investigators (Demirtas Citation2013; Malik et al. Citation2014; Shaaban et al. (Citation2018)). These criteria are (Technical, Economic, Environmental, Social, Planning, and Governmental). If a main criterion is not considered by an investigator, it is assigned a weight of zero.
Table 3. Weights of main criteria obtained by different investigators.
shows main criteria average weights computed by the authors based on the three investigators’ Demirtas (Citation2013), Malik et al. (Citation2014) and Shaaban et al. (Citation2018) weights. Governmental criteria are discarded as it is only used by Malik et al. (Citation2014) and its score is divided proportionally to other main criteria.
Table 4. Main criteria average weights.
When using equal weights, it may happen that by combining criteria with a high degree of correlation double counting may be introduced into the overall project’s score (ranking). To minimise the possibility of producing meaningless overall ranking, sensitivity, and robustness analysis are required. Analysis of this type can improve the accuracy, credibility and interpretability of the final ranking (Handbook on Constructing Composite Indicators Methodology And User Guide Citation2008). For sensitivity analysis in this study, the assigned average set in is used as a base to generate economic, environmental, and social biased scenarios. In , a weight of 0.5 is assigned to the stakeholder favourable criteria, while the remaining 0.5 is distributed among the other main criteria proportional to their initial average weights (the base).
Table 5. Weights of biased scenarios.
Normalisation
Scores of each criterion have to be normalised prior to the application of any aggregation formula that calculates the total project’s score. Normalisation is required because as criteria scores have different measurement units. It should be noted that the un-normalised score could have a negative sign if the objective is ‘minimisation’. In other words, if the project performance under specific criteria is worsen as the value of the score gets higher (e.g. CO2 emission).
Normalisation method selection should take into account data properties, utilised aggregation method, as well as MCA objectives. Robustness tests might be needed to assess their impact on the projects ranking (Handbook on Constructing Composite Indicators Methodology And User Guide Citation2008). Two normalisation procedures that suit the quantitative scores, were studied to be applied to the problem at hand, taking into account score properties according to their measurement units. The first one is called Min–Max and is carried out using Equation (1):
(1)
(1) where Iij is the normalised score of criteria i and alternative (project) j, minj xij, and maxj xij are the minimum and maximum values of the un-normalised score xij across all projects j. This procedure does not produce negative normalised score (scores always range between 0 and 1). Min–Max normalisation procedure was discarded, when geometric aggregation formula was applied, due to the zero score produced by it.
The second procedure is called Max-Absolute and is implemented using Equation (2):
(2)
(2) where maxj │xij │is the maximum absolute value of the un-normalised score xij across all projects j. It should be noted this procedure may produce normalised scores always ranging between −1 and 1.
Aggregation
Aggregation formulas also vary and some of them may not fit specific normalisation procedure or encounter the problem of weights (not expressing the importance of the associated criterion). Compensability occurs when a deficit in one dimension (main criterion) is counterbalanced by a surplus in another. This creates discrepancy between the concept of weights and the actual score when geometric or linear aggregations are used (Handbook on Constructing Composite Indicators Methodology And User Guide Citation2008). Geometric aggregation functions are more appropriate if some degree of non-compensability, between individual sub-criteria or main criteria, is required.
Furthermore, sub-criteria score linear aggregations are rewarded proportionally to the weights, while geometric aggregations reward those alternatives (projects) with higher scores. This abides the suspicion of impartiality of assigned weights. Other aggregation formulas should be used, in particular methods that do not allow compensability, to ensure that weights remain a measure of non-negligible importance. Non-compensability could be assured by finding an aggregation formula, such as Ideal Point, that compromise among multi-policy goals. Ideal Point in its basic form, as it retains only ordinal information does not reward outliers (Handbook on Constructing Composite Indicators Methodology And User Guide Citation2008).
Therefore, in this study three aggregation formulas: additive (weighted summation), compromise (Ideal point), and geometric functions are tested and compared Equations (3), (4), (5), and (6).
Weighted summation
Weighted sum is the most widely used aggregation formula reflects the proportional importance of the different aggregated variables is reflected by weights assignment. The principle of annihilation is dissatisfied by this method, which is a disadvantage in design decision problems. The performance index is expressed as:
(3)
(3) where Iij is the normalised score of criteria i and alternative (project) j, and wi is the weight of criteria i. Here the criteria with minimisation objectives are expressed in their negative sign.
Geometric
The weighted product (WP) satisfies the principle of annihilation. However, the meaning of weights is less intuitive than weighted sum. They reflect the exponential relative importance, and not proportional between variables. The performance index is expressed by:
(4)
(4) where Iij is the normalised score of criteria i and alternative (project) j, and wj is the weight of criteria i. Since the Max Absolute procedure may result in negative normalised scores for sub criteria with minimisation objective, it is decided to employ the inverse of the mathematical operation adopted in this particular aggregation formula. Therefore, any sub criteria with minimisation objective is expressed as
.
Ideal point
(5)
(5) where
(6)
(6) where Iij is the normalised score of criteria i and alternative (project) j, wj is the weight of criteria I, p is 2 (Euclidean distance) (Shaikh, Memon, and Kim Citation2021).
Results and discussion
Sensitivity to aggregation formula
Applying ELECTRE I resulted in generating the outranking matrix as shown in . Based on the tabulated ELECTRE I results, Attaqa PSHPP is discarded from further analysis as it is a dominant alternative.
Table 6. Outranking matrix.
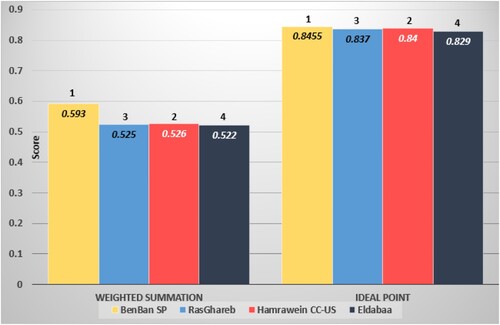
To avoid confusion in demonstrating the results the Euclidian distance deduced from Equation (6) (ideal point formula) is subtracted from one so the maximum score remains the highest rank. It should be also noted Non-biased weighted scenario () is adopted in the following analysis. As illustrated by , the score of last three projects in case of weighted summation and the four projects in case of ideal point formula is very close (almost same score). Min–max standardisation method does not provide significant differentiation among alternatives. The geometric aggregation formula cannot be applied in conjunction with this standardisation method, since it may produce zero standardised scores. However, if both applied together this will lead to zero aggregated score of some projects so no proper ranking can be attained. Therefore, in order to compare geometric aggregation formulas with the other two aggregation formulae, the maximisation standardisation method has to be applied. Moreover, the binary criteria (dispatchability of the system) and zero score criteria (non-fuel variable O&M and heat rate) have been discarded.
Figure 2. Min-Max standardisation method with different aggregation formulas.
shows the scoring and ranking of the three aggregation formulas after discarding zero score criteria and applying maximisation standardisation method.
Figure 3. Max standardisation method with different aggregation formulas.
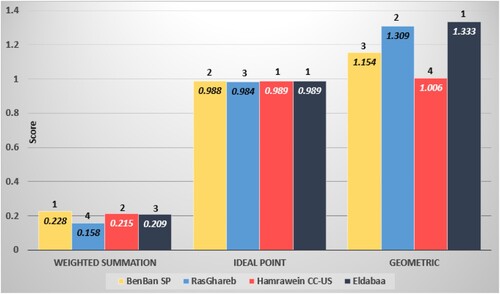
The ranking of the projects of the three formulae was different. The score of last three projects in case of weighted summation and first three projects in case of ideal point formula is very close (almost same score). For the geometric formula or weighted product first place went to El Dabaa NP because the weighted product gives more emphasis to the criteria’s score rather than the weights given to each criterion. Also, as seen from only the geometric aggregation formula leads to clear differentiable scores that’s why this formula is used in the following section.
Projects’ ranking based on biased weight scenarios
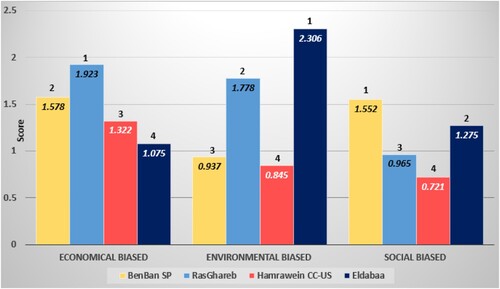
shows projects ranking under three biased weighing scenarios, as explained in the weighing section (). For the economical biased scenario Ras Ghareb WF project is ranked first as it has the lowest value of the project (0.4 biliion $). El Dabaa NP dropped to last place as the project costs about 30 billion $ and the highest fixed O&M cost. The environmental biased scenario resulted in similar ranking to the non-biased weights scenario but with higher differentiable scores. El Dabaa NP excelled due to the low CO2 emission of the plant. For the social biased scenario Benban SP project rose to first place due to its high social acceptance and employment rate. It is followed by El Dabaa NP despite its low social acceptance due to its low area footprint.
Figure 4. Projects ranking based on biased scenarios.
Conclusion
As the pressure to mitigate climate change impacts increases, Egypt has to increase the share of NZEE projects, including renewable energy, in its energy matrix. Therefore, this paper presents MCDA to decision-makers and stakeholders to reprioritise the implementation of five NZEE national projects based on technical, economic, environmental, and social criteria. Throughout the manuscript, the applicability of the different combination aggregation formulas and normalisation methods was questioned. The pros and cons of employing each combination was objectively investigated with respect to criteria weighting concept (compensability) and negative or zero scores. The authors made use of the efforts carried out by previous investigators to select the sub criteria and to obtain an unbiased set of weights for the main criteria that have been used to evaluate similar energy projects/technologies.
Screening alternatives by ELECTRE I method was a necessary primary step discard Attaqa PSHPP for further analysis, as its exceling could distort the results.
The scoring and ranking of the three aggregation formulas were distinct after excluding criteria with zero scores and applying the maximisation standardisation method. In case of weighted summation, the scores of the last three projects were very close, and similarly, for the ideal point formula, the scores of the first three projects were almost identical (nearly the same score). However, for the geometric formula or weighted product, El Dabaa NP secured the top position because the weighted product emphasises the criteria’s scores more than the assigned weights for each criterion. Ras Ghareb wind farm takes the second position, while BenBan SP and Hamrawein CC-US gain the third and fourth places, respectively.
For the non-biased scenario, the ranking of the projects went as follows: El Dabaa NP followed by Ras Ghareb WF and Benban SP, and last place went to Hamrawein CC-US. For the biased scenarios, Ras Ghareb WF outdid in the economical biased scenario due to the very low budget of the project compared to other projects. It went down one place in the environmental biased scenario and dropped to third place in the social biased one. El Dabaa NP topped in the environmental biased scenario which could sound unusual but this is due to the low CO2 emission of the plant and discarding heat rate used by the electrical power plant criteria. It was ranked second place in the social biased scenario and dropped to last place when economic criteria were favoured. For the social biased scenario, Benban SP outrated all the other projects which is very logic as it’s the most established renewable technology. It was ranked second place in the economical biased scenario and surprisingly dropped to third place in the environmental biased due to its low EROI.
As the energy matrix of developing countries experiences an increase in renewable energy sources, MCDA has potential in prioritisation of projects. It allows the inclusion of different views of decision makers, stakeholders, and is expressed in the form of different criteria in a planned and transparent manner. It must still advance towards comprising best practices that allow giving fair weights and applying an appropriate standardisation method and aggregation formula to the criteria to find appropriate solution for the problem at hand. Also, the decision of presence and exclusion of certain criteria has to be very carefully taken, as this can change the solution entirely.
Disclosure statement
No potential conflict of interest was reported by the author(s).
References
- Abdellatif, D. 2016. “Economic Assessment of Installing Pumped Storage Hydroelectric Power Plant In Egypt.” A Thesis Submitted to the Faculty of Engineering, Cairo University, MSc Electrical Power and Machines Engineering, Giza, Egypt, 2016.
- Abdellatif, D., R. AbdelHady, A. M. Ibrahim, and E. A. El-Zaha. 2018. “Conditions for Economic Competitiveness of Pumped Storage Hydroelectric Power Plants in Egypt.” Renewables: Wind, Water, and Solar 5 (1): 1–4. https://doi.org/10.1186/s40807-018-0048-1.
- Afgan, N. H., and M. G. Carvalho. 2002. “Multi-criteria Assessment of New and Renewable Energy Power Plants.” Energy 27 (8): 739–755. https://doi.org/10.1016/S0360-5442(02)00019-1.
- Attaqa Mountain Pumped Storage Power Plant. 2019. https://www.power-technology.com/projects/attaqa-mountain-pumped-storage-power-plant/. Last Updated July 2019. Visited May 2022.
- Benban Solar Park. 2022. https://en.wikipedia.org/wiki/Benban_Solar_Park. Last updated May 2022. Visited May 2022.
- Bronfma, N. C., R. B. Jiménez, P. C. Arevalo, and L. A. Cifuentes. 2015. “Public Acceptance of Electricity Generation Sources: The Role of Trust in Regulatory Institutions.” Energy & Environment 26 (3): 349–368.
- Cambridge Econometrics (DG Energy). 2014. “Employment Effects of Selected Scenarios from the Energy Roadmap 2050.” Final report for the European Commission. October 2013. https://ec.europa.eu/energy/sites/ener/files/documents/2013_report_employment_effects_roadmap_2050_2.pdf.
- Demirtas, O. 2013. “Evaluating the Best Renewable Energy Technology for Sustainable Energy Planning.” International Journal of Energy Economics and Policy 3 (4): 23–33.
- EEHC. Egyptian Electricity Holding Company. 2019. “Annual Report 2018/2019, Arab Republic of Egypt, Ministry of Electricity and Renewable Energy, 2019.” http://www.moee.gov.eg/english_new/EEHC_Rep/2018-2019en.pdf.
- Egypt Country Commercial guide. 2022. https://www.trade.gov/country-commercial-guides/egypt-electricity-and-renewable-energy . Last updated: September 2021, Visited: May 2022.
- Egyptian Grid Map. http://www.geni.org/globalenergy/library/national_energy_grid/egypt/egyptiannationalelectricitygrid.shtml.
- EIA. US Energy Information Administration. 2013. “Updated Capital Cost Estimates for Utility Scale Electricity Generating Plants April 2013 Independent Statistics & Analysis.” https://www.eia.gov/outlooks/capitalcost/pdf/updated_capcost.pdf.
- EIA. US Energy Information Administration 2015. “Assumptions to the Annual Energy Outlook 2015 September 2015 Independent Statistics & Analysis.” https://www.eia.gov/outlooks/aeo/assumptions/pdf/0554(2015).pdf.
- El-Markabi, M. S. 2015. “Addressing Egypt’s Electricity Vision.” Ministry of Electricity and Renewable Energy of Egypt.
- El Amine, M., J. Pailhes, and N. Perry. 2014. “Comparison of Different Multiple-Criteria Decision Analysis Methods in the Context of Conceptual Design: Application to the Development of a Solar Collector Structure.” Proceedings of Joint Conference on Mechanical, Design Engineering & Advanced Manufacturing, Toulouse, France.
- El-Dabaa NPP Project. 2022. https://nppa.gov.eg/en/el-dabaa-npp-project-2/#ProjectOverview. Last Updated April 2022. Visited May 2022.
- El Dabaa Nuclear Power Plant. 2022. https://en.wikipedia.org/wiki/El_Dabaa_Nuclear_Power_Plant. Last updated: December 2021. Visited: May 2022.
- EROI – A Tool To Predict The Best Energy Mix. 2015. https://www.forbes.com/sites/jamesconca/2015/02/11/eroi-a-tool-to-predict-the-best-energy-mix/?sh=53859007a027. Last updated February 2015. Visited: May 2022.
- Everything You Need to Know About Clean Coal. 2022. https://www.popularmechanics.com/technology/infrastructure/news/a27886/how-does-clean-coal-work/. Last updated 2022. Visited May 2022.
- Hamarawein IPP coal project. 2022. https://www.gem.wiki/Hamarawein_IPP_coal_project. Last updated December 2021. Visited May 2022.
- Handbook on Constructing Composite Indicators Methodology And User Guide. 2008. “The Organisation For Economic Co-Operation And Development (OECD).” www.oecd.org/publishing/corrigenda.
- Kaya, T., and C. Kahraman. 2010. “Multicriteria Renewable Energy Planning Using an Integrated Fuzzy VIKOR & AHP Methodology: The Case of Istanbul.” Energy 35 (6): 2517–2527.
- Kharitonov, V. V., and N. N. Kosterin. 2017. “Criteria of Return on Investment in Nuclear Energy.” Nuclear Energy and Technology 3 (3): 176–182. https://doi.org/10.1016/j.nucet.2017.08.006. https://www.sciencedirect.com/science/article/pii/S2452303817300730.
- Malik, A., M. Al Badi, A. Al Kahali, Y. Al Nabhani, A. Al Bahri, and H. Al Barhi. 2014. “Evaluation of Renewable Energy Projects Using Multi-Criteria Approach.” In IEEE Global Humanitarian Technology Conference (GHTC 2014), 350–355. IEEE.
- National Electric Power Regulatory Authority. “Tariff Division. Determination of Rate of Return For Power Sector.” https://nepra.org.pk/Admission%20Notices/2016/Nov/Concept%20Paper%20Rate%20of%20Return.pdf.
- NREA. New and Renewable Energy Authority. 2016. Benban 1.8gw Pv Solar Park, Egypt Strategic Environmental & Social Assessment Final Report, February 2016. https://www.eib.org/attachments/registers/65771943.pdf.
- Pramangioulis, D., K. Atsonios, N. Nikolopoulos, D. Rakopoulos, P. Grammelis, and E. Kakaras. 2019. “A Methodology for Determination and Definition of Key Performance Indicators for Smart Grids Development in Island Energy Systems.” Energies 12 (2): 242. https://doi.org/10.3390/en12020242.
- Ras Ghareb Wind Farm: First Wind Farm in Egypt to Use Grout. 2022. https://www.master-builders-solutions.com/en-eg/about-us/news/ras-ghareb-wind-farm-first-wind-farm-in-egypt-to-use-grout?gclid = Cj0KCQjw4PKTBhD8ARIsAHChzRKFzCLy7VnFwVknVxZVngEZSTjdEFlTmSD1A0zWysqpVeyfTisGO7IaAvEkEALw_wcB. Visited May 2022.
- Ras Ghareb Wind Farm, Ras Ghareb, Egypt. 2022. https://www.power-technology.com/projects/ras-ghareb-windfarm/. Last updated April 2022. Visited May 2022.
- Shaaban, M., J. Scheffran, J. Böhner, and M. S. Elsobki. 2018. “Sustainability Assessment of Electricity Generation Technologies in Egypt Using Multi-Criteria Decision Analysis.” Energies 11 (5): 1117. https://doi.org/10.3390/en11051117.
- Shaikh, S. A., M. Memon, and K. S. Kim. 2021 May. “A Multi-Criteria Decision-Making Approach for Ideal Business Location Identification.” Appl. Sci 11 (11): 4983. https://doi.org/10.3390/app11114983.
