
 ?Mathematical formulae have been encoded as MathML and are displayed in this HTML version using MathJax in order to improve their display. Uncheck the box to turn MathJax off. This feature requires Javascript. Click on a formula to zoom.
ABSTRACT
This study demonstrates the optimal design of a hybrid renewable energy system for the electrification of a potential rural national park reserve. The objective is to evaluate the feasibility of utilising renewable energy sources (RESs) to reduce GHG emissions. The core components studied are photovoltaic solar (PV) panels, wind turbines (WTs), diesel generators (DGs), and battery banks (BBs). The research involves estimating the reserve’s load profile, assessing the potentials of RESs, and designing various system configurations. Each configuration is evaluated to derive the most efficient option. For a building with an energy demand of 832,640 kWh/yr, it is found that PV-WT-BB is the best configuration which comprises of 500-kW PV, 200-kW WT, and 1424-kW BBs and contributes an annual generation of 1,821,732 kWh/year. With a net present cost of $2,206,308 for the lifetime of the project, it saves 757,162 kg/year of total GHG emissions if the reserve operated using DGs.
Nomenclature
| Symbol | = | Description (Unit) |
| PPV | = | output power of PV panel ( |
| PPV, rated | = | rated power of PV panel at STC ( |
| fPV | = | PV derating factor ( |
| GT | = | solar irradiance incident ( |
| = | solar irradiance incident at STC ( | |
| = | power temperature coefficient ( | |
| Tc | = | PV cell temperature ( |
| Tc,STC | = | PV cell temperature at STC ( |
| vhub | = | wind speed at hub height ( |
| vanem | = | wind speed at anemometer height ( |
| zhub | = | wind turbine hub height ( |
| zanem | = | anemometer height ( |
| = | surface roughness | |
| = | wind turbine electrical power output ( | |
| = | actual air density ( | |
| = | standard air density ( | |
| = | wind turbine electrical power output at STC ( | |
| = | renewable energy fraction ( | |
| = | energy by non-renewable sources ( | |
| = | total energy consumed by load ( | |
| = | salvage income ( | |
| = | replacement cost ( | |
| = | residual life of component ( | |
| = | replacement cost duration ( | |
| = | component’s lifetime ( | |
| = | project’s lifetime ( | |
| = | function takes real number and returns an integer | |
| = | net present cost ( | |
| = | capital cost ( | |
| = | operating and maintenance cost ( | |
| = | fuel cost ( | |
| = | levelised cost of energy ( | |
| = | total annualised cost of the system ( | |
| = | total energy served to the load ( | |
| = | capital expenditure ( | |
| = | operating expenditure ( | |
| = | total annualised capital cost ( | |
| IRR | = | internal rate of return ( |
1. Introduction
1.1. Overview of renewable energy sources
In recent years, innovations in renewable energy (RE) technologies have not only offered sustainable alternatives to traditional fossil-fuels power plants but have also presented opportunities for mitigating climate change. The continuous improvement in RE technologies allows them to be competitive energy-generating methods to decrease greenhouse gas (GHG) emissions. The reliance on abundant natural resources makes renewable energy sources (RESs) highly dependable for energy usage. For example, the usable power received from the sun , (Hosenuzzaman et al. Citation2015) which can be converted into electrical power by photovoltaic (PV) panels or concentrated solar power (CSP) is higher than the overall global power consumption in 2021
(The International Energy Agency Citation2023). Also, there is the wind energy that could be captured by wind turbines (WTs) and converted into electricity. The biomass, hydropower and geothermal are other forms of RESs that are used nowadays to generate electrical energy. Harnessing these resources to generate clean and inexhaustible energy has become an interesting field of research and development, promoting a transition towards a more sustainable and eco-friendly future. According to The International Energy Agency (Citation2024), 29% of the global energy generation in 2022 is from RESs and it is projected that this number will increase to 42% by 2028.
1.2. Status of renewable energy sources in Kuwait
Kuwait’s electrical demand, similar to any other developing countries, is consistently increasing over the years. This is primarily due to the increasing population and industry needs (The Ministry of Electricity, Water and Renewable Energy Citation2023; The Public Authority for Civil Information Citation2024). In addition, Kuwait is located in a distinctive geographical location, situated along the Arabian Gulf, making it a crucial maritime passage for trading, transportation, shipping activities, as well as the exchange of resources, and the import and export of goods (The United Nations Statistics Division Citation2024). The rising electrical demand in Kuwait is almost exclusively fulfilled by conventional power plants relying on fossil fuel energy, with less than 1% of energy generation coming from RESs. To be specific, in 2022, the installed capacity of Kuwait’s electric grid operated by the Ministry of Electricity, Water, and Renewable Energy (MEWRE) was 20,250 MW with only 97 MW coming from RESs (Schmela Citation2022; The International Renewable Energy Agency Citation2023; The Ministry of Electricity, Water and Renewable Energy Citation2023).
It is well known that the use of fossil fuels in the energy sector is linked to several issues, such as the associated GHG emissions, oil spills, or even depletion of resources. Over the past decade, GHG emissions in Kuwait had surged by 203% (Crippa et al. Citation2020). In 2022, Kuwait was ranked 7th among the most polluted countries globally, based on the average particulate matter (PM) 2.5 concentration, reaching 55.8 μg/m³ of air (The Statistics Portal Citation2023). Furthermore, the generation of electricity and heat was the primary contributor to GHG emissions in Kuwait, accounting for 58% of total emissions (Schmela Citation2022). Consequently, Kuwait’s government was pressured to pursue safer alternatives to generate energy, stating a national goal to generate 15% of the total energy demand from RESs by 2030 (Al-Abdullah et al. Citation2023).
The utilisation of RESs is experiencing significant growth not only in developed countries, but also in some underdeveloped regions (The International Energy Agency Citation2024). Examining Kuwait, a country with long, sunny, and windy summers that make solar and wind energies potentially feasible, the country has the potential to emerge as a strong competitor in the race to adopt RE technologies for energy generation (Alawadhi Citation2022; Kamel, El Badawi, and Alanzi Citation2023). Kuwait has already harnessed the potential of both solar and wind energy in various projects, such as Shagaya Renewable Energy Park (SREP) project, located 100 km west of Kuwait City, with Phase 1 fully commissioned in 2019. The project is divided into 3 phases. SREP Phase 1 has an installed capacity of 70 MW consisting of a 50-MW CSP, 10-MW PV panels, and 10-MW WTs (Kuwait Institute for Scientific Research Citation2024; Steensma et al. Citation2018). Phases 2 and 3 are expected to be completed before 2030 with an installed capacity of 4000 MW with potentially a hybrid PV-WT or PV-WT-CSP configurations, with PV seizing the majority of the installed capacity (The Ministry of Electricity, Water and Renewable Energy Citation2023).
1.3. Literature review, motivation, and contribution
Recent studies had explored the use of hybrid renewable energy sources (HRES) to electrify off-grid remote areas. In Abdul Hafedh (Citation2021), a study explored the feasibility of utilising an HRES to electrify a remote village in Mendely City, Iraq. The author proposed an optimal system sizing of 6-kW PV, 35-kW WT, 7-kW inverter, and 138.8-kWh battery bank (BB). Similarly, in Asghar, Kamal, and Ashraf (Citation2023), an off-grid HRES was designed to supply a rural site in Lucknow, India. The HRES configuration consisting of 16-kW PV, 4-kW WT, 13-kW diesel generator (DG), and 50-kWh BB was found to be the optimal solution. Meanwhile, in Sen and Bhattacharyya (Citation2014), the authors suggested using hydropower, PV, WT, bio-diesel generator, and BB to meet the electrical demand of an off-grid remote village in the state of Chhattisgarh, India. However, the study revealed that the optimal configuration included 30-kW hydropower, 20-kW PV, 10-kW bio-diesel generator, 6.94-kWh BB, and 20-kW converter by excluding WTs from the design. Alternatively, in Kamal, Asharaf, and Fernandez (Citation2022a), the authors introduced the bio-gas generator as an energy source in addition to the PV, WT, and DG for the purpose of electrifying a remote village in Uttarakhand, India. The results showed that the optimal HRES consisted of 8-kW PV, 5-kW WT, 6-kW DG, 6-kW bio-gas generator, and 145-kWh BB. In Kanata et al. (Citation2021), the techno-economic-environmental assessment of various HRES configurations was examined with the purpose of supplying an isolated island in Indonesia, known as Sebesi Island. The authors found that the combination of 100-kW biogas generator, 69.5-kW PV, 4-kW WT, 0.5-kW converter, and 1215-kWh BB was the best scenario to meet the island’s demand. In Kamal, Asharaf, and Fernandez (Citation2022b), the authors recommended implementing a HRES with 144-kW PV, 42-kW WT, 30-kW bio-gas generator, 40-kW hydropower, and 35-kW biomass as energy sources to electrify an isolated region in India. Moreover, an HRES configuration including PV, WT, DG, and BB with a 92% renewable energy fraction (REF) emerged as the optimal solution in Kamal, Asharaf, and Fernandez (Citation2022c) to meet the energy demand of a rural location in Uttarakhand, India.
Addressing HRES utilisation in Kuwait, the feasibility of powering off-grid 4G/5G cellular base stations were examined in Baidas et al. (Citation2021) and Baidas et al. (Citation2022). Optimal hybrid systems were designed that incorporated PV, WTs, batteries, and backup DGs to reduce costs while minimising CO2 emissions. It was found that utilising a hybrid system (PV-DG-BB) decreased annual fuel consumption by 95% in comparison to a conventional DG system.
Prior to the implementation of any HRES configuration, comprehensive technical, economic, and environmental feasibility studies must be conducted to clarify and justify the investment and budgets allocated. Numerous computer-aided design methods are available for the analysis and evaluation of hybrid systems. One notable tool in this field is HOMER® which is used in this paper. HOMER® is a user-friendly computer program widely employed to construct RE power system models and perform technical, economic, and environmental analyses with the capability of comparing various designs (UL Solutions Citation2024).
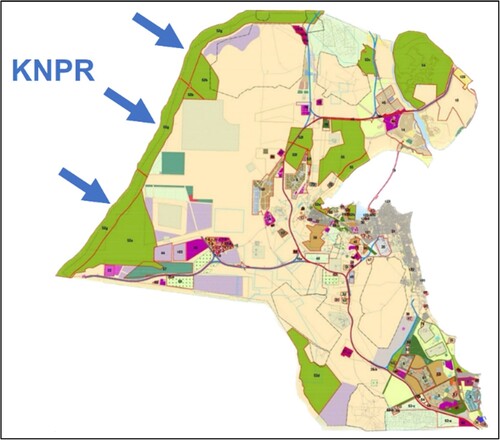
In this study, the feasibility of utilising RESs to electrify a rural national park reserve in Kuwait, named as Kuwait National Park Reserve (KNPR), is examined. There are distinctive characteristics of the park's location, terrain, climate, and energy demands, which sets this paper apart from other published work about off-grid systems. The investigated park is a planned reserve that will be constructed by 2030 according to Kuwait’s fourth master plan (Dar Al-Handasah Citation2024). The park will be located along the northwest borders of Kuwait, as shown in (area number 52 g). Aligning with Kuwait’s goal to generate 15% of the total demand from RESs and aiming to diminish harmful GHG emissions associated with the electrification process, an off-grid HRES is proposed and designed in this paper to supply electricity to KNPR. The proposed design includes comprehensive technical, economical, and environmental assessments and it also includes a detailed load estimation study tailored to the unique characteristics of the national park.
Figure 1. Kuwait's map showing the planned land use as outlined in Kuwait’s 4th master plan (Dar Al-Handasah Citation2024).
It is important to clearly state two points regarding this study:
The goal of this paper is to perform feasibility studies for establishing the HRES needed for the electrification of one administration building inside KNPR. It is expected that the park will be divided into major zones with several administration buildings. This paper investigates the establishment of one building. Therefore, the suggested HRES size and configuration will be duplicated for every zone containing an administration building.
One of the main objectives of establishing national park reserves is to protect and conserve natural ecosystems and wildlife. Therefore, KNPR's huge land size will not be used as a potential site to build large utility-scale RES power plants. The focus of this paper is electrification of only the administration buildings.
This paper is organised into six sections, beginning with this introduction and followed by Section 2 which provides the used methodology presenting essential data related to KNPR, the employed simulation software, the mathematical model, and the evaluation criteria. Section 3 focuses on the results and evaluation of various system configurations designed for the HRES, while Section 4 extends the exploration by examining the impact of varying the renewable energy component’s generation contributions in PV-WT-BB configuration. Section 5 presents a conclusion summarising key findings and contributions of the research followed by Section 6 with recommendations for future work to advance knowledge and address potential gaps.
2. Methodology and used system
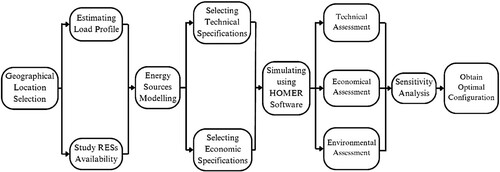
shows a detailed flowchart of the sequential steps of the used methodology in this paper starting from assessing the location of KNPR and the available weather resources (solar irradiance and wind speed) to modelling HRES configurations and performing the feasibility and sensitivity studies to choose the optimal HRES option.
Figure 2. Flowchart of the sequential steps of the methodology used in this paper.
2.1. Details of the proposed Kuwait National Park Reserve
In this study, the proposed system is designed to fulfil the energy demand of one administration building in KNPR, which is situated at latitude 29° 42′ 43″ north and longitude 47° 02′ 13″ east. The area features an arid desert climate characterised by long, hot, and dry summers and short warm winters. The average temperature over the year is 26°C, while the annual average rainfall is 89 mm (Kuwait Meteorological Center Citation2024). The development of KNPR serves two primary purposes. Firstly, it aims to purify the air from harmful gases and toxins by enhancing oxygen levels through the photosynthesis process. Secondly, it intends to mitigate the effect of sand encroachment associated with the northwest wind, which is the prevailing wind direction in Kuwait (Kuwait Meteorological Center Citation2024).
An administration building in one zone in KNPR requires a power supply to meet a daily average energy demand of 2281 kWh (reaching over 3000 kWh in summer as explained in Section 2.2). Since Kuwait’s electrical grid faces a recurring challenge of providing sufficient electricity to the increasing electrical demand (Kamel, El Badawi, and Alanzi Citation2023), the small country could face an energy crisis in 2024–2026 with the peak load potentially surpassing the 24-safe running capability of the electric grid, exacerbated by ongoing delays in future power station projects. Hence, to reduce the stress on the grid and to eliminate the associated efforts and costs of connecting KNPR to the existing electrical grid (due to KNPR’s remote location with no existing transmission lines or substations nearby), an alternative electrifying system is proposed. Given that the park area receives sufficient amounts of solar irradiance and wind (Section 2.2), HRES is suggested. Utilising RE technologies not only aim to meet the park’s energy demand but also reduce harmful GHG emissions. This is important since the main objective of any national park is to minimise its carbon footprint. Additionally, the use of RESs aligns with the national goal of generating 15% of Kuwait’s total electrical generation from RE technologies.
2.2. System design and renewable energy resources data
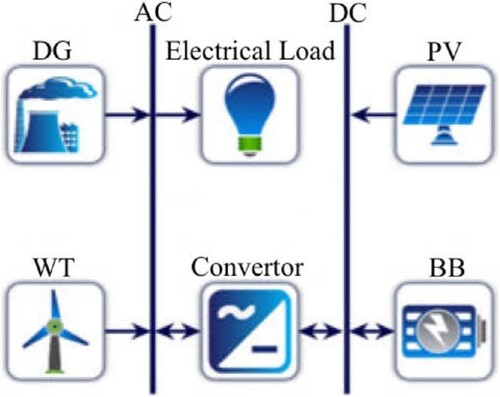
To design HRES, various inputs must be provided, including the daily load profile, monthly average solar irradiance, monthly average wind speed, costs associated with each component, project lifetime, and more. The proposed system diagram is shown in . The components used are (1) photovoltaic solar panels, (2) wind turbines, (3) conventional diesel generators, (4) battery banks, and (5) DC-to-AC converters. The simulation in this study is carried out for 8760 h in a year, with 60 min per timestep. After simulating all possible configurations, the infeasible systems are eliminated based on applied constraints. The feasible scenarios are presented and organised by net present cost (NPC) in Section 3.
Figure 3. Proposed system diagram for KNPR using HOMER® software showing major components.
The electrical load estimation for one administration building of KNPR is determined based on expected building size (1500 m2) and occupant’s requirements as shown in . It illustrates the maximum load calculations for both summer and winter. The load is divided into categories (lighting, sockets, pumps, etc.) (Joshi Citation2008). For each category, the load is initially estimated and then multiplied by the demand factor. Estimated load and demand factor values are both obtained based on MEWRE standards (The Ministry of Electricity, Water and Renewable Energy Citation2024). Further, a 50% margin is added to the total demand load and daily energy load to include a safety margin and to allow future expansions if needed. Moreover, the calculated values in the table are rounded up in the simulation for simplicity. As seen from , for a typical summer day, the total demand load and energy need is 260 and 3100 kWh, respectively. The simulated daily load profile is shown in with a calculated annual energy demand of 832,640 kWh.
Figure 4. Daily load profile of KNPR during typical (a) summer, and (b) winter days.
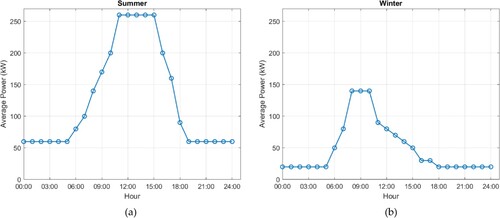
Table 1. KNPR estimated load power and energy calculations during typical summer and winter days.
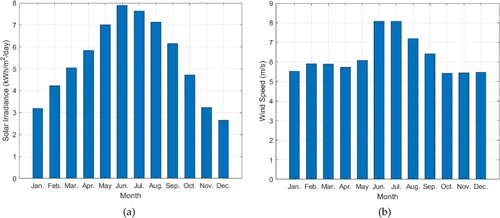
For the specified area in this study, the solar and wind data are obtained from the NASA Prediction of Word Energy Resources (POWER) database (NASA Langley Research Center Citation2024). The monthly average daily irradiance and wind speed are illustrated in . For solar irradiance, the annual cumulative value is 1971.74 kWh/m² with the peak month is June (7.89 kWh/m²/day) and the lowest month is December (2.65 kWh/m²/day). For wind, the annual average wind speed is 6.27 m/s with the peak months in June and July (8.09 m/s) and the lowest month in October (5.42 m/s). This is a useful conclusion since the months with the higher energy-generating potentials (summer months) are also the months with the highest energy-demanding in the administration building leading to favourable results.
Figure 5. Monthly weather data of KNPR showing average daily (a) solar irradiance, and (b) wind speed at 50 m (NASA Langley Research Center Citation2024).
2.3. Mathematical model and economic details of the system components
In this section, a brief summary of the mathematical model of each component is presented along with their economic parameters. The considered components are PV panels, WT, DGs, BBs, and DC-to-AC converters.
2.3.1. Photovoltaic solar modules
PV panels, which convert sunlight to electricity, is one of the main sources in HRES. PV systems are considered a feasible energy source in the selected location of KNPR with the irradiance values shown earlier. However, a major issue with PV systems is the fact that they only generate power during specific hours in the day (known as peak hours). This is why in off-grid PV systems, energy storage devices (BBs) are essential. Further, the use of WTs and/or DGs diversifies the electrification process and increases the reliability of the overall system. The selected PV panels for this study are SunPower X21-335-BLK panels with technical and economic data presented in (SunPower Corporation Citation2024). To account for the losses in practical operation scenarios (e.g. wiring losses, shading, aging, etc.), an 80% derating factor is applied to the energy production of the PV panels. Thus, the output power of the PV panels can be calculated by (1) as explained in UL Solutions (Citation2024) and Masters (Citation2023)
(1)
(1) where
is the rated power of in kW under standard test conditions (STC),
is the derating factor,
is the solar irradiance incident on the panel,
is the incident irradiance at STC (1 kW/m²),
is the power temperature coefficient (%/°C),
is the cell temperature, and
is the cell temperature at STC (25°C).
Table 2. SunPower X21-335-BLK PV panels datasheet (SunPower Corporation Citation2024).
2.3.2. Wind turbines
WTs convert the mechanical energy of the wind into useful electrical energy. Unlike PV systems, WTs do not follow a typical energy-generating curve. Depending on the existence of sufficient wind speeds, the reliability of off-grid WT systems can increase by adding PV systems and/or DGs, and the essential energy storage system (BBs). This is the essence of incorporating RESs in hybrid configurations.
The chosen Eocycle EO20 WT data are shown in (Eocycle Citation2024). The power output of this particular WT is calculated through a three-step process. Firstly, the wind speed must be adjusted from anemometer height (50 m) to the WT’s actual hub height (36 m) as shown in (2). Moreover, the surface roughness is considered to include the effect of friction on the wind speed (Ehrmann et al. Citation2017; UL Solutions Citation2024). In Kuwait, the surface roughness value is approximated to be 0.14 (Al-Nassar et al. Citation2005).
(2)
(2) where
is the wind speed at hub height (m/s),
is the wind speed at anemometer height (m/s), and
is the surface roughness.
Table 3. Eocycle EO20 WT datasheet (Eocycle Citation2024).
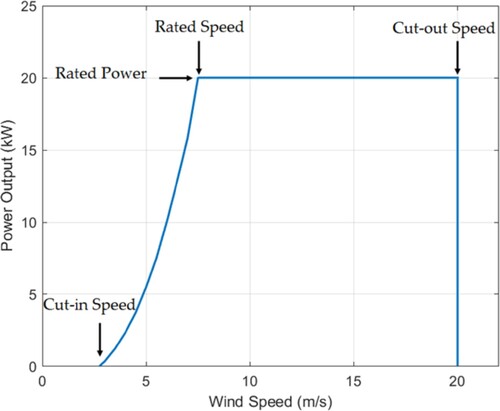
After determining the wind speed at the hub height, the power generated by the WT at standard air density is calculated. This calculation is done by referring to the WT’s power curve shown in . The power curve depicts the expected power output from the WT at a specific speed under standard conditions of temperature and pressure (ambient T = 25°C, P = 100 kPa). If the wind speed at the hub height falls outside the range defined in the power curve, it implies that the wind speed is either below the minimum cut-in wind speed or above the maximum cut-out wind speed. In both cases, the turbine generates zero power. Finally, the output power is adjusted to reflect the actual air density. The adjustment aims to account for the actual conditions by multiplying the predicted power value, obtained from the power curve, by the air density ratio, as described in (3) and explained in UL Solutions (Citation2024)
(3)
(3) where
is the turbine power output at STC,
is the actual air density and
is the air density at STC (1.225 kg/m³).
Figure 6. Eocycle EO20 WT power curve showing the cut-in, cut-out, rated speeds, and the rated power (Eocycle Citation2024).
2.3.3. Diesel generator
Although diesel generators can provide constant power supply as long as fuel is available, this energy-generating method is not an RE technology as DGs contribute to air pollution and GHG emissions. However, DGs are included in the presented investigation to provide a base case for comparison purposes. In this proposed design, a generic diesel generator is used with a capital cost of $350/kW. The average diesel price is set at $1.2/L according to Global Petrol Prices (Citation2024). The generator size will be set automatically depending on the configuration’s generation distribution. Hence, if the DG is the sole source of the configuration, its size needs to be large to provide all the required power. displays technical and economic data related to the generator, while provides information on the produced emissions during DG operation. For every litre of fuel consumed, the generator produces a total of 2656.84 g of GHG emissions. The predominant contributor to these emissions is the carbon dioxide (CO₂), accounting for 98.5% of the total emissions.
Table 4. Datasheet of the generic DG used in the proposed design (UL Solutions Citation2024).
Table 5. GHG emissions of the generic DG used in the proposed design (UL Solutions Citation2024).
2.3.4. Battery bank
Off-grid systems must include energy storage systems. One of the most popular options is battery banks. Although the operation of BBs does not directly contribute to air pollution and GHG emissions, their production and disposal process can have negative environmental impacts. Despite that, BBs are still essential in off-grid electrification. There are two types of batteries that are common for storing energy in HRES: (1) Lead-Acid and (2) Lithium-Ion. Based on several studies assessing their performance in PV power plants, it is found that Lithium-Ion batteries are the better choice from both economic and technical point of views. This is primarily due to their 30% increased depth of discharge (DoD) compared to Lead-Acid batteries. Additionally, Lithium-Ion batteries have longer lifetimes and higher efficiencies (Rajanna and Kumar Citation2021). Although the initial cost of Lithium-Ion batteries is higher, their lower maintenance costs can result in lower overall expenses in the long run (Dufo-López et al. Citation2021). Therefore, Lithium-Ion batteries are selected for energy storage in this study. displays the datasheet for the selected batteries. As mentioned earlier, the replacement and recycling of Lithium-Ion batteries produce some GHG emissions which are not included in this study. Furthermore, it is important to store the batteries at room temperature, in a secure, cool, dry, and well-ventilated area, and away from heat sources and direct sunlight to ensure longer lifetime and to avoid any hazards(Environmental Protection Agency Citation2021).
Table 6. Lithium-ion batteries datasheet (UL Solutions Citation2024).
2.3.5. DC-to-AC converter
A generic converter is used for the design to maintain energy flow between AC and DC components. Its capacity changes depending on the component’s generation distribution in each HRES configuration. The converter datasheet is shown in .
Table 7. Generic converter datasheet (UL Solutions Citation2024).
2.4. Evaluation criteria
The following criteria are derived from HOMER® software used in this study and explained in UL Solutions (Citation2024). A detailed explanation of the financial terms can be found in the literature.
2.4.1. Renewable energy fraction
Renewable energy fraction (REF) denotes the percentage of energy provided by RES out of the total energy supplied by the system. This measurement is important for assessing progress toward promoting sustainable energy practices and transitioning to an energy configuration that is more environmentally friendly. REF is calculated as shown in (4)
(4)
(4) where
is the electrical energy produced by non-renewable sources (kWh/year) and
is the total energy consumed by the load (kWh/year).
2.4.2. Salvage income
Salvage income (SI) refers to the residual value of a power system component at the end of the project’s lifetime. For each component, a linear depreciation is assumed, signifying that the salvage income corresponds to the remaining lifetime proportion. Furthermore, it is assumed that salvage income depends on the replacement cost (), not the capital cost (
). The salvage income occurs at the end of the project’s lifetime and is computed as shown in (5)
(5)
(5)
where is the residual life of the component at the end of the project’s lifetime and is determined by (6)
(6)
(6) and
is the replacement cost duration and is determined by (7)
(7)
(7) where
is the component lifetime,
is the project lifetime, and INT() is a function that takes a real number and returns its integer value.
2.4.3. Net present cost and levelised cost of energy
The net present cost (NPC) of a system represents the cost of all expenses incurred by the system throughout its operational lifetime, subtracted by the cost of all incomes over the same period as illustrated in (8). The costs incorporate capital, replacement, operational and maintenance, and fuel costs, while the income is represented by salvage income,
(8)
(8) where
is the operating and maintenance cost and
is the fuel cost. Note that RESs carry no fuel costs. The NPC is the primary economic metric evaluated in this study and represents the basis for calculating the levelised cost of energy (LCOE). This term is defined as the average cost per kWh of beneficial electrical energy generated by the system. In order to compute LCOE, the annualised cost of generated electricity is divided by the overall, supplied electrical load. This calculation is conducted as shown in (9)
(9)
(9) where
is the total annualised cost of the system and
is the total electrical load served.
2.4.4. CAPEX and OPEX
CAPEX refers to the capital expenditure, which represents the initial investment capital cost associated with a component. Hence, this cost reflects the total installed expenses of the component at the commencement of the project. On the other hand, OPEX refers to the operating expenditures, which represent the annual equivalent of all costs and revenues, excluding the initial capital cost. This calculation is performed using (10)
(10)
(10) where
is the total annualised capital cost.
2.4.5. Internal rate of return and discounted payback period
The internal rate of return (IRR) represents the discount rate at which the NPC of both the conventional configuration and the proposed system configuration becomes equal. It is computed by finding the discount rate that makes the present value of the difference between the two sets of cash flows equal to zero. Further, the discounted payback period (DPP) refers to the period of years when the difference between the cumulative cash flows of the proposed system configuration and the conventional configuration system changes from negative to positive. DPP occurs precisely when the line representing the difference in discounted cash flows crosses the zero. This metric provides insight into the timeframe needed to recover the difference in investment costs between the two systems.
2.4.6. GHG emissions
In this study, six types of GHG emissions are considered which are CO₂, CO, UHC, PM, SO₂ and NOₓ. The emission of these gases occurs due to the electricity generation process carried out by DGs. Notably, only emissions associated with the energy-generating process are considered. Manufacturing, installation, and replacement emissions are neglected. Before simulating the power system, the emissions factor in kilogram of gases emitted per unit of fuel consumed is identified. Following the simulation, the yearly emission of the given gas is calculated by multiplying the emission factor by the total annual fuel consumption.
3. Simulation results and discussion
This paper focuses on ten configurations, nine of which are examined for the designed hybrid systems. The tenth configuration, utilising only DG, is provided as a base case to compare with other configurations to assess the feasibility of implementing HRESs in the subject location. The outcomes of these hybrid configurations, outlined in , are evaluated considering technical, economic, and environmental aspects. This evaluation aims to provide the insights necessary to make an informed decision regarding the optimal HRES configuration suitable for the studied area.
Table 8. Considered hybrid systems configurations showing component's sizes.
3.1. Technical assessment
First, the technical assessment of HRES configurations is performed. It is important to analyse the components generation contribution in each configuration to assess the technical aspects. presents the generation distribution of each configuration. In the PV-BB and WT-BB configurations, energy generation is derived from a single source, leading to decreased system reliability. In the event of low-production event in that single source (such as dark hours for PV or low wind speed for WTs), energy supply would be disturbed. Furthermore, in the PV-WT-DG, PV-DG and WT-DG configurations, the absence of an energy storage element decreased system dependability due to the high reliance on the intermittent-natured RESs. Meanwhile, in the PV-WT-DG-BB, PV-WT-BB, PV-DG-BB, and WT-DG-BB configurations, the energy generation distribution among two or more components and the availability of the BB, an energy storage element, increased both system reliability and dependability. Finally, as stated earlier, case no. 10 (only DGs) serves as a base case for comparison purposes and will not be a viable option. All results are plotted in . It can be seen that WT-BB configuration resulted in the highest total energy generation with 2,731,094 kWh/year (180.64% higher than DG base case). As discussed earlier, the fact that only WTs are used in this configuration, the system reliability decreases.
Figure 7. Technical assessment (energy generation distribution) for each hybrid configuation.
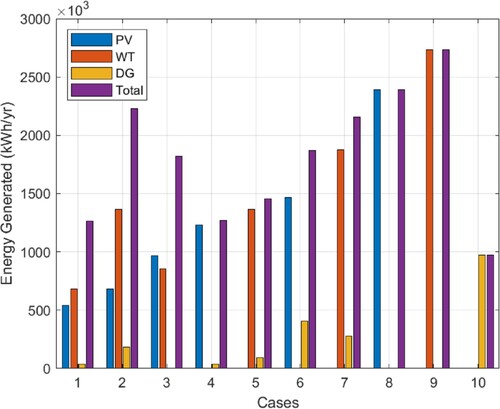
Table 9. Technical assessment (energy generation distribution) for each hybrid configuration.
3.2. Economic assessment
The economic assessment offers insights into the expected budget at the project’s commencement, throughout its lifetime, and at the end stage of the project including salvage incomes. Therefore, it is important to conduct this assessment before implementing major projects to thoroughly study and evaluate the economic feasibility. presents a summary of key metrics considered in the economic assessment, including NPC, LCOE, CAPEX, and more. Main results are also plotted in .
Figure 8. Economic assessment showing (a) NPC, CAPEX, and OPEX, and (b) LCOE for each hybrid configuation.
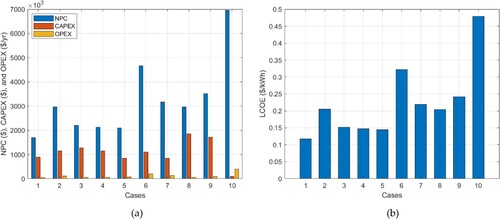
Table 10. Economic assessment for each hybrid configuation.
The PV-WT-DG-BB configuration stands out with the lowest NPC, LCOE, and OPEX, as well as the highest IRR among the considered configurations. On the other hand, while the DG configuration has the lowest CAPEX, it also has the highest NPC, rendering it the worst from an economic standpoint. Furthermore, the WT-DG-BB configuration has the lowest discounted payback period; however, its NPC is higher than that of the PV-WT-DG-BB configuration. In conclusion, from an economic perspective, the PV-WT-DG-BB configuration emerges as the most desired choice, as it features the lowest NPC, indicating lowest overall costs during the project’s lifetime. However, due to the existence of DGs in this design, this will result in lower REF and high GHG emissions as seen in Section 3.3.
3.3. Environmental assessment
The environmental assessment provides useful information regarding the GHG emissions of each HRES configuration depending on fuel consumed. Recall that one of the main functions of national park reserves is to reduce the negative effects of GHG emissions and to have low carbon footprint. Hence, no DGs are used in the optimal configuration regardless of the cost-reduction benefit, if any. Obviously, RESs consume no fuel (at least not sufficient to warrant an inclusion in the assessment). provides a summary of the environmental aspects associated with each configuration with the main results plotted in . Notably, the PV-WT-BB, PV-BB, and WT-BB configurations exhibited zero emissions, representing the ideal case. Furthermore, these configurations achieve a 100% REF. In contrast, the DG configuration, having the DG as a single source of generation, exhibits the highest GHG emissions, followed by the PV-DG configuration. In this specific configuration, the increased GHG emissions is attributed to the higher fuel consumption resulting from extended DG operation times throughout the year to complement the low- and no-production hours of PV panels, given the absence of a storage element.
Figure 9. Environmental assessment showing (a) fuel consumption, and (b) CO2 and total GHG emissions for each hybrid configuation.
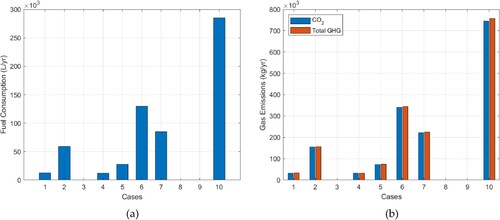
Table 11. Environmental assessment for each hybrid configuation.
3.4. Discussion of simulation results
After conducting the three assessments (technical, economic, and environmental), the PV-WT-BB configuration (no. 3) is determined to be the best choice.
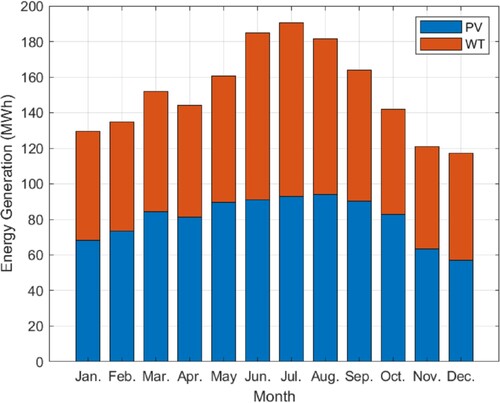
Firstly, the technical assessment reveals that this configuration offers enhanced system reliability, dependability, and overall performance. The total energy generated from this configuration is 1,821,732 kWh/year (87.2% increase from the DG base case). Further, the cumulative energy generation peaks in July (190.73 MWh), coinciding with the highest load, as depicted in . During this summer month, WTs attain maximum generation of 97.66 MWh, while the PV panels provide peak values of 93.07 MWh. This is important since most of the demand load in the administration building in summer months originates from A/C units (56%). Conversely, the minimum cumulative energy generation occurs in December (117.26 MWh), aligning with the lowest load. In this same month, the PV generation reaches its lowest point (57.06 MWh), while the WTs generation reaches its lowest point in November (57.70 MWh). Again, this is important since the generation capability of the selected HRES configuration (PV-WT-BB) is lower in winter months coinciding with low demand load requirement of KNPR.
Figure 10. Optimal configuration (No. 3. PV-WT-BB) electrical generation dispatch in MWh.
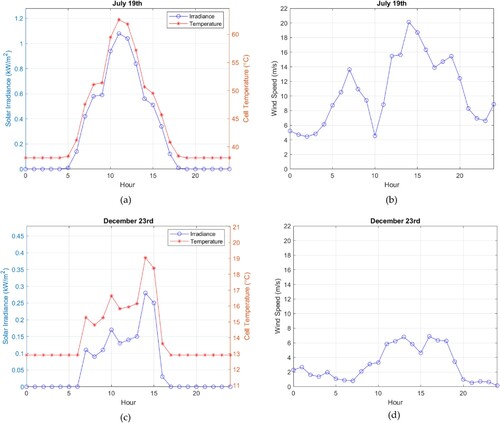
For additional in-depth analysis, the performance of the selected PV-WT-BB configuration during two typical days in summer (July 19th) and winter (December 23rd) are investigated. First, the weather data of these days are plotted in . The first subplots (a) and (b) show the vast difference between the solar irradiance in the site location of KNPR between a typical summer day (maximum reaching 1.08 kW/m2) and a winter day (maximum reaching 0.28 kW/m2). It is noteworthy to point out that these days are typical days and obviously a clear-sky winter day may possibly outperform a cloudy or dusty summer day. Further, the second subplots (c) and (d) show how summer days are windier in KNPR location with the maximum wind speed reaching 20.12 m/s in the summer day compared to 6.89 m/s in the winter day.
Figure 11. Weather data at KNPR showing (a) solar irradiance and cell temperature, (b) wind speed for a typical summer day (July 19), (c) solar irradiance and cell temperature, and (d) wind speed for a typical winter day (December 23).
The detailed hourly power generation of the proposed HRES (PV-WT-BB) for the typical summer and winter typical days is shown in . In subplot (a), it is shown how the RESs outperforms the need of the load served. In fact, when the load peaks from 11:00 to 15:00, the PV generation also peaks around that time. The wind, in this day performed well, but as it is known, the WTs generation does not follow a similar expected generation curve as PV systems. In subplot (b), the state of charge (SoC) of the batteries is shown. Only during the late-night hours (0:00–5:00), energy is extracted from BBs. During the remaining hours, RESs are providing more energy than the demand load and hence the batteries are being charged or fully charged. These subplots show that the proposed optimal HRES configuration (PV-WT-BB) outperforms the energy needs of one administration building, with maximum power of 665 kW compared to the maximum load requirement of 260 kW in this specific day.
Figure 12. Hourly analysis for the optimal HRES configuration no. 3 (PV-WT-BB) showing (a) electrical generated power and load served, (b) BB energy status for a typical summer day (July 19th), (c) electrical generated power and load served, and (d) BB energy status for a typical winter day (December 23rd).
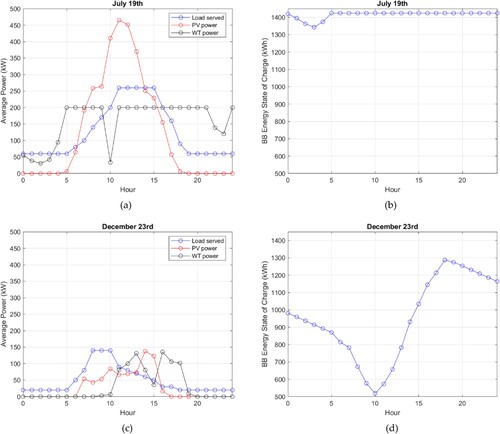
The same power generation examination is conducted for the typical winter day and plotted in subplots (c) and (d) of . These subplots show that although the proposed HRES configuration (PV-WT-BB) manages to provide the necessary energy to operate the administration building, this configuration depends on the reserves of BBs lowering its state of charge to 40.3% (reaching 518.75 kWh from the maximum value of 1287.38 kWh). This is observed while keeping in mind that used BBs, with a total capacity of 1424 kWh, has a 20% (or 285 kW) minimum SoC to ensure better performance and longer lifetimes of the batteries. Hence, the usable capacity of BBs in this study is 1139 kWh.
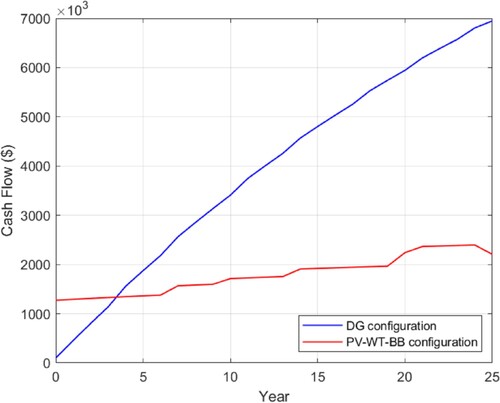
Secondly, from an economical aspect, the PV-WT-BB configuration demonstrates a significant 68.25% reduction in NPC compared to the DG base configuration over the 25-years lifetime period. This is attributed to the lack of need for the costly fuels for DGs. Specifically, the absence of the DG in this selected configuration results in the elimination of an annual fuel cost of $341,982 compared to the DG base configuration. Similarly, the reduction in LCOE reaches 68.27% from the base case. The IRR of the PV-WT-BB configuration is considerably high, reaching 29.9% and the cumulative cash flow of the PV-WT-BB configuration is projected to surpass that of the DG configuration in 3.47 years, as illustrated in .
Figure 13. Cumulative cash flow in US dollar for both DG and PV-WT-BB configurations over the project’s lifetime.
Additionally, provides a detailed cost breakdown of the PV-WT-BB configuration. Notably, the capital cost constitutes the majority of the cost, contributing 57.7% of the total cost, whereas the operating and maintenance cost contributes to only 15.2%. Furthermore, within the components, the PV incurs the highest cost, accounting for 46.1% of the overall expenditure, while the WT represents the least cost at only 21.1%. This is because the selected PV size (550 kW) in this optimal configuration is larger than the selected WT size (200 kW). The cost obviously increases with the selected installed capacity of any power source.
Table 12. Cost breakdown of the PV-WT-BB configuration based on cost type and component over the project lifetime.
Thirdly and finally, from an environmental aspect, it is found that the PV-WT-BB configuration achieves 100% REF, whereas the DG configuration has 0% REF. This indicates a significant increase of 100% in the REF. Furthermore, the PV-WT-BB configuration does not require burning any type of fuel for operation, which results in a reduction in fuel consumption by 0.293 L/kWh compared to the DG configuration leading to a cumulative saving of 7,124,625 L over the 25 years project lifetime. This saved fuel will prevent the emission of an annual 757,161.50 kg of GHG, distributed as 745,982 kg of CO₂, 4702 kg of CO, 205 kg of UHC, 28.5 kg of PM, 1827 kg of SO₂, and 4417 kg of NOₓ.
In summary, a comparison between the optimal configuration of PV-WT-BB and the base case using DG is shown in . It contains the major points of the technical, economic, and environmental assessments.
Table 13. Comparison between optimal HRES configuration and base case of DG.
4. Sensitivity analysis
In this section, a sensitive study is conducted to assess the impact of altering the generation contribution of various components by adjusting their rated capacities. The focus of this investigation is on the optimal configuration (PV-WT-BB) by varying the energy generation capacity of either the PV or WT, while the sizes of the other components are determined based on the lowest NPC index.
4.1. Impact of altering WT generation contribution
This subsection explores the impact of adjusting the number of WTs to increase wind energy contribution in a PV-WT-BB configuration. The number of WTs is varied from 7 to 15, with the sizes of the PV and BB determined based on the configuration with the lowest NPC. summarises the results.
Table 14. Sensitivity analysis performed on optimal HRES configuration (PV-WT-BB) by only varying number of WTs.
Initially, the NPC decreases with the addition of more WTs, reaching its lowest point at 10 WTs. After that, the NPC begins to rise again due to increased total energy generation. This leads to additional excess energy, indicating redundant energy generation components. One potential solution is reducing the rated capacity of the PV to lower excess energy generation. However, this necessitates an increase in BB storage capacity, leading to higher costs. Additionally, removing the PV reduces system reliability, as this system would rely on a single energy source for power generation. While increasing the number of WTs enhances wind energy generation, it may not be sufficient to supply the load at all times without increasing the BB capacity. This is attributed to the variation and intermittent-nature of wind generation times. The peak of wind generation does not necessarily align with peak load demand, leading to energy loss when the BB is fully charged.
4.2. Impact of altering PV generation contribution
This subsection explores the impact of varying the PV contribution by increasing the PV rated capacity from 470 kW to 650 kW. The sizes of the WT and BB are selected based on the configuration with the lowest NPC, as detailed in . Initially, the NPC decreases until the PV capacity reaches 550 kW, after which it starts to increase. This increase in NPC is attributed to the added energy generation components. Furthermore, for PV rated capacities of 490 kW or more, the PV energy generation alone becomes sufficient to meet the load without relying on WT energy generation. However, given the limited generation times of the PV, from sunrise to sunset, increasing BB storge capacity is necessary to eliminate the need for WTs. Moreover, eliminating the WTs and increasing the BB capacity will result in a higher NPC and a reduced system reliability.
Table 15. Sensitivity analysis performed on optimal HRES configuration (PV-WT-BB) by only varying PV capacity.
4.3. Discussion of sensitivity analysis
The sensitivity analyses confirm the selected configuration of HRES in Section 3. It establishes that the optimal configuration for achieving reliable and dependable energy-generating sources, attaining minimum NPC, and reducing GHG emissions to near-zero, involves 550-kW PV, 200-kW WTs. Combining these with a 1426-kWh BB results in the optimal configuration architecture for a HRES designed to electrify one administration building in KNPR.
5. Conclusion
The main conclusions of the presented work can be summarised as follows:
The establishment of rural national park reserves serves multiple objectives and one of which is mitigation of climate change impacts by lowering the harmful effects of GHG emissions. Hence, electrification process of administration buildings in these reserves must take this into consideration.
Reserves are often situated in remote areas and connecting them to existing grids is financially challenging due to the lack of transmission lines and nearby substations.
Off-gird electrification of rural reserves using hybrid renewable energy sources (HRESs) is the most practical, feasible solution.
To determine optimal HRES configurations, technical, economic, and environmental assessments are required.
In this study, the potentials of utilising HRESs in a rural national park reserve in Kuwait (KNPR) were examined with the aim of using reliable and dependable energy-generating sources, minimising NPC, and reducing harmful GHG emissions.
It was found that in KNPR, the optimal configuration comprised of 550-kW PV, 200-kW WT, and 1426-kWh BB. This configuration contributed an annual generation of 1,821,732 kWh (87.2% increase from the DG base case), had a net present cost of $2,206,308 (68.25% decrease from the DG base case), and saved an estimated 757,162 kg/year of total GHG emissions (100% decrease from the DG base case).
6. Future work
There are several areas that could be investigated in future research to attain more precise and thorough results, such as the following:
In this study, the process of implementing HRES was assumed to contain zero GHG emissions, while in reality, the process includes indirect emissions associated with material extraction, production, transportation, components assembly, and more. In addition, installing HRES may require the construction of infrastructure, such as roads, foundations, and support structures, incurring costs and emissions that were not considered in both economic and environmental assessments.
The only considered energy storage element in this study was the battery bank, however, there are several storage technologies that can be explored and may provide better performance. These technologies include compressed air, supercapacitors, superconducting magnetic, and cryogenic systems. Moreover, there are some alternative clean power generation methods worth investigating for off-grid rural electrification such as fuel cells and biomass energy. However, the climate of Kuwait may not suit these technologies. Hence, further investigation is needed.
Acknowledgements
The authors confirm that the data supporting the findings of this study are available within the article.
Disclosure statement
No potential conflict of interest was reported by the author(s).
References
- Abdul Hafedh, S. 2021. “Feasibility Study of Hybrid Energy System for off-Grid Electrification in Rural Areas.” Diyala Journal of Engineering Sciences 14 (1): 57–66 . https://doi.org/10.24237/djes.2021.14105.
- Al-Abdullah, Y. M., M. Al-Saffar, A. Al-Yakoob, and M. Sahraei-Ardakani. 2023. “Impacts of Kuwait’s Proposed Renewable Energy Goals on Grid Operations.” International Journal of Sustainable Energy 42 (1): 776–792 . https://doi.org/10.1080/14786451.2023.2234057.
- Al-Nassar, W., S. Alhajraf, A. Al-Enizi, and I. Al-Awadhi. 2005. “Potential Wind Power Generation in the State of Kuwait.” Renewable Energy 30 (14): 2149–2161 . https://doi.org/10.1016/j.renene.2005.01.002.
- Alawadhi, E. 2022. “The Potential of Wind Energy in Kuwait: A Complete Feasibility Investigation.” Journal of Engineering Research 11 (1B): 349–361 . https://doi.org/10.36909/jer.18167.
- Asghar, A., M. M. Kamal, and I. Ashraf. 2023. “Planning of Renewable and Storage-Based Standalone Microgrid for Reliable Electrification.” Energy Storage 5 (4): e426 . https://doi.org/10.1002/est2.426.
- Baidas, M. W., M. F. Almusailem, R. M. Kamel, and S. S. Alanzi. 2022. “Renewable-Energy-Powered Cellular Base-Stations in Kuwait’s Rural Areas.” Energies 15 (7): 2334 . https://doi.org/10.3390/en15072334.
- Baidas, M. W., R. W. Hasaneya, R. M. Kamel, and S. S. Alanzi. 2021. “Solar-Powered Cellular Base Stations in Kuwait: A Case Study.” Energies 14 (22): 7494 . https://doi.org/10.3390/en14227494.
- Crippa, M., D. Guizzardi, M. Muntean, E. Schaaf, E. Solazzo, F. Monforti-Ferrario, J. G. J. Olivier, and E. Vignati. 2020. “Fossil CO2 Emissions of All World Countries – 2020 Report.” EUR 30358 EN, Publications Office of the European Union, Luxembourg, 2020, https://doi.org/10.2760/143674.
- Dar Al-Handasah. 2024. “Kuwait Master Plan 2040.” [Online]. Accessed April 9, 2024. https://www.dar.com/work/project/kuwait-master-plan-2040.
- Dufo-López, R., T. Cortés-Arcos, J. S. Artal-Sevil, and J. L. Bernal-Agustín. 2021. “Comparison of Lead-Acid and Li-Ion Batteries Lifetime Prediction Models in Stand-Alone Photovoltaic Systems.” Applied Sciences 11, https://doi.org/10.3390/app11031099.
- Ehrmann, R. S., B. Wilcox, E. B. White, and D. C. Maniaci. 2017. “Effect of Surface Roughness on Wind Turbine Performance.” Technical Report Office of Scientific and Technical Information (OSTI), United States. [Online]. https://doi.org/10.2172/1596202.
- Environmental Protection Agency. 2021. “Summary Report: Lithium-Ion Battery Disposal and Recycling Stakeholder Workshop. [Online]. Accessed April 9, 2024. https://www.epa.gov/system/files/documents/2022-03/final_lithium-ion-battery-workshop-public-report_508web.pdf.
- Eocycle. 2024. [Online]. Accessed April 9, 2024. https://eocycle.com/.
- Global Petrol Prices. 2024. [Online]. Accessed April 9, 2024. https://www.globalpetrolprices.com/diesel_prices/.
- Hosenuzzaman, M., N. A. Rahim, J. Selvaraj, M. Hasanuzzaman, A. B. M. A. Malek, and A. Nahar. 2015. “Global Prospects, Progress, Policies, and Environmental Impact of Solar Photovoltaic Power Generation.” Renewable and Sustainable Energy Reviews 41: 284–297. https://doi.org/10.1016/j.rser.2014.08.046.
- The International Energy Agency. 2023. “Electricity Market Report Update Outlook for 2023 and 2024.” [Online]. Accessed April 9, 2024. https://www.iea.org/reports/electricity-market-report-2023.
- The International Energy Agency. 2024. “Renewable Energy Progress Tracker.” [Online]. Accessed April 9, 2024. https://www.iea.org/data-and-statistics/data-tools/renewable-energy-progress-tracker.
- The International Renewable Energy Agency. 2023. Renewable Energy Statistics 2023. Abu Dhabi: International Renewable Energy Agency.
- Joshi, H. 2008. Residential, Commercial and Industrial Electrical Systems: Equipment and Selection. 1st ed. New York: McGraw Hill Education (India) Private Limited.
- Kamal, M. M., I. Asharaf, and E. Fernandez. 2022a. “Optimal Renewable Integrated Rural Energy Planning for Sustainable Energy Development.” Sustainable Energy Technologies and Assessments 53 (Part B), https://doi.org/10.1016/j.seta.2022.102581.
- Kamal, M. M., I. Asharaf, and E. Fernandez. 2022b. “Planning and Optimization of Standalone Microgrid with Renewable Resources and Energy Storage.” Energy Storage 5 (1), https://doi.org/10.1002/est2.395.
- Kamal, M. M., I. Asharaf, and E. Fernandez. 2022c. “Optimal Planning of Renewable Integrated Rural Microgrid for Sustainable Energy Supply.” Energy Storage 4 (4), https://doi.org/10.1002/est2.332.
- Kamel, R. M., M. El Badawi, and S. S. Alanzi. 2023. “An Optimum Design and Economic Feasibility Analysis of Wind Farms in Kuwait Using Different Wind Generation Technologies.” Journal of Engineering Research, https://doi.org/10.1016/j.jer.2023.10.028.
- Kanata, S., S. Baqaruzi, A. Muhtar, P. Prasetyawan, and T. Winata. 2021. “Optimal Planning of Hybrid Renewable Energy System Using HOMER in Sebesi Island, Indonesia.” International Journal of Renewable Energy Research 11 (4): 1507–1516. https://doi.org/10.20508/ijrer.v11i4.12296.g8303.
- Kuwait Institute for Scientific Research. 2024. “Government Initiative.” [Online]. https://www.kisr.edu.kw/en/research-centers/government-initiative/.
- Kuwait Meteorological Center. 2024. [Online]. Accessed April 9, 2024. https://www.met.gov.kw/.
- Masters, G. M. 2023. Renewable and Efficient Electric Power Systems, 3rd ed., 339–356. New Jersey: John Wiley & Sons, Inc.
- The Ministry of Electricity, Water and Renewable Energy. 2023. “Statistical Yearbook 2022 – Electrical Energy.” [Online]. Accessed April 9, 2024. https://www.mew.gov.kw/media/0fpnlm2 h/electrical-annual-report-2022-for-qr.pdf.
- The Ministry of Electricity, Water and Renewable Energy. 2024. “Regulations for Electrical installations, Sixth Edition 2013.” [Online]. Accessed April 9, 2024. https://www.mew.gov.kw/media/230lp1h2/regulation-m-e-w-r-1-04-03-14.pdf.
- NASA Langley Research Center. 2024. [Online]. Accessed April 9, 2024. https://power.larc.nasa.gov/.
- The Public Authority for Civil Information. 2024. “Central Statistical Bureau (2024).” [Online]. Accessed April 9, 2024..https://www.paci.gov.kw/stat/Default.aspx.
- Rajanna, B. V., and M. K. Kumar. 2021. “Comparison Study of Lead-Acid and Lithium-Ion Batteries for Solar Photovoltaic Applications.” International Journal of Power Electronics and Drive Systems 12 (2), https://doi.org/10.11591/ijpeds.v12.i2.pp1069-1082.
- Schmela, M. 2022. “Global Market Outlook for Solar Power 2022-2026.” [Online]. Accessed April 9, 2024. https://www.solarpowereurope.org/insights/market-outlooks/global-market-outlook-for-solar-power-2022.
- Sen, R., and S. C. Bhattacharyya. 2014. “Off-Grid Electricity Generation with Renewable Energy Technologies in India: An Application of HOMER.” Renewable Energy 62, https://doi.org/10.1016/j.renene.2013.07.028.
- The Statistics Portal. 2023. “Global Air Quality.” [Online]. Accessed April 9, 2024. https://www.statista.com/.
- Steensma, G., R. Román, C. Marshall, J. Bermejo, K. Iyer, S. Al-Hajraf, and A. Al-Qattan. 2018. “Shagaya Renewable Energy Park Project.” SOLARPACES 2018: International Conference on Concentrating Solar Power and Chemical Energy Systems, 1–11. https://doi.org/10.1063/1.5117583.
- SunPower Corporation. 2024. [Online]. Accessed April 9, 2024. https://us.sunpower.com/products/solar-panels.
- UL Solutions. 2024. “Information about HOMER Pro.” [Online]. Accessed April 9, 2024. https://www.homerenergy.com/products/pro/index.html.
- The United Nations Statistics Division. 2024. “ISO Country Codes – Country Names and Code Elements.” [Online]. Accessed April 9, 2024. https://data.un.org/en/iso/kw.html.