
ABSTRACT
Germany has one of the most ambitious energy transition policies dubbed ‘Die Energiewende’ to replace nuclear- and fossil power with renewables such as wind-, solar- and biopower. The climate gas emissions are reduced by 25% in the study period of 2002 through 2022. By triangulating available information sources, the total nominal expenditures are estimated at EUR 387 bn, and the associated subsidies are some EUR 310 bn giving a total nominal expenditures of EUR 696 bn. Alternatively, Germany could have kept the existing nuclear power in 2002 and possibly invest in new nuclear capacity. The analysis of these two alternatives shows that Germany could have reached its climate gas emission target by achieving a 73% cut in emissions on top of the achievements in 2022 and simultaneously cut the spending in half compared to Energiewende. Thus, Germany should have adopted an energy policy based on keeping and expanding nuclear power.
1. Introduction
There is a considerable debate in many countries as to the path going forward concerning climate policy and energy policy. More than 22 countries signed an agreement in COP28 in Dubai committing themselves to tripling the nuclear capacity by 2050 (Donovan Citation2023). This makes environmental sense since nuclear power scores the best on most overall environmental impact assessment metrics (UNECE Citation2021) including lifecycle Greenhouse Gas (GHG) emissions. Others, such as Germany, have closed down the Nuclear Power Plants (NPP) and aimed for energy transition based on bioenergy and Variable Renewable Energy (VRE) such as wind power and solar photovoltaic (PV) power. There could hardly be a larger difference in policy.
Thus, this paper poses the simple question – what if Germany had spent their money on nuclear power and not followed their policy from 2002 through 2022 (20 years); would Germany have achieved more emission reductions and lower expenses? To answer this research question requires first an assessment of the results of the German policy covering the period of 2002 through 2022 to establish a baseline. Then, two choices occur that could have been dealt with independently given Germany’s long nuclear history and competence – (1) to keep existing NPPs running, and/or (2) to invest in new NPPs. As noted, Germany has opted out of both these choices and invested in VREs, which makes the case particularly interesting.
The relevance of the research is not only given by the difference in policy choices observed, but also that the German Federal Accounting Office (Bundesrechnungshof) writes about the German policy dubbed ‘Die Energiewende’ in German, and it concludes: ‘The Bundesrechnungshof warns that the energy transition in its current form [based on the Energiewende] poses a threat to the German economy and overburdens the financial capacity of electricity-consuming companies and households’ (Bundesrechnungshof Citation2021a). Thus, understanding these policy choices is vital for Germany but also for other countries considering various energy transition paths.
The paper is organised as follows. In Section 2.0, the methodological issues are discussed. Then, in Section 3.0, the current policy is discussed followed by a discussion in Section 4.0 of an alternative nuclear policy. The alternative nuclear policy has two major components. First, we assess the costs of keeping operational the NPPs that existed in 2002, and second estimate how much additional nuclear capacity could have been built for the same cost that the Energiewende has incurred by yearend 2022. The research is critically reviewed in Section 5.0 followed by conclusions in Section 6.0.
2. Method
On the surface, the paper is a simple comparison of three alternatives. The baseline alternative is the current policy, which must be established. The challenge with the baseline alternative is that the data are not transparently published. In fact,
The German government invests billions in climate protection, but does not know how successful its investments are and whether they are worthwhile. To achieve climate neutrality, the federal government needs a three-digit billion sum by 2030 alone. In order to ensure the effective and economical use of these funds, the German government must better manage its climate protection policy. The climate protection report in its current form is not suitable for this purpose. (Bundesrechnungshof Citation2023)
The other two alternatives revolve around either keeping the NPPs in 2002 operational and/or expanding with new NPPs. Concerning the first, there exists a multitude of data on operating NPPs, but the challenge is that none of them are exactly like the ones that existed in Germany in 2002. Also, a key aspect of option theory is the moving baseline where an
… incremental cash flow attributable to a capital investment decision is higher than the capital investment model dictates because a company’s cash flow without the investment is unlikely to remain constant. Therefore, the incremental cash flows that should be built into the capital investment model should be based on an assumption of declining cash flows in the future (Howell and Schwartz Citation1997)
Note that the supply of capacity and the demand for capacity and the differences between measures of expenses and costs are critical (Cooper Citation1990);
‘Cost’ is a measure of resource consumption that related to the demand for jobs to be done whereas ‘expense’ is a measure of spending that investigates the capacity provided to do a job.
Capacity/expense numbers are found in the general ledger – not costs (Emblemsvåg and Cokins Citation2021). To the knowledge of this author, the above cost versus expense distinction is lost in grid costing analyses, and it is lost in daily parlance and also many reports. Since proper cost analyses require more detailed information that are unavailable, this paper will operate at the expense level and more specifically cash flow. Unfortunately, there is no universally-accepted definition of cash flow (US SEC Citation2014), but at the level of accuracy this analysis operates at the finer distinctions are lost.
The most difficult part of this paper is to construct a reasonable alternative of expanding the NPP capacity even if we model the uncertainty. There are several methods as outlined shortly. It should be noted that using several methods is referred to as a type of ‘triangulation’ initially also denoted ‘convergent validation’ (Webb et al. Citation1966). Several studies across many fields estimate that only around 40% of published findings can be replicated reliably, but replication may not be enough (Munafò and Davey Smith Citation2018), and an essential protection against flawed ideas is triangulation (Lawlor et al. Citation2016). Indeed, Denzin (Citation1970) extended the idea of triangulation beyond its conventional association with research methods and designs (Bryman Citation2004) and proposed four types of triangulation:
Data triangulation, which entails gathering data through several sampling strategies.
Investigator triangulation, which refers to the use of more than one researcher in the field to gather and interpret data. This type of triangulation is important with interviews and the like, and not applicable for this paper.
Theoretical triangulation, which refers to the use of more than one theoretical position in interpreting data. Theoretical triangulation is always possible, but in a relatively concrete case as discussed here, it becomes too metaphysical to bring into this paper.
Methodological triangulation, which refers to the usage of more than one method for gathering data.
Triangulation sometimes refers to all instances in which two or more research methods are employed (Bryman Citation2004), but Denzin (Citation1970) drew a distinction between within-method and between-method triangulation but this broader view of triangulation is not without controversy (Mertens and Hesse-Biber Citation2012). In this paper, however, we will use the more conventional methodological triangulation due to the high level of uncertainty as to how an expansion of NPP capacity could have been implemented given different approaches. This is the most common type of triangulation used (Jick Citation1979).
This being said about triangulation, we must identify possible approaches that we in the end will triangulate to obtain a scientifically justifiable investment estimates of expanding the NPP capacity in Germany. In no particular order, this author has identified the following two approaches given that Germany kept its existing NPPs:
Expand with new NPPs according to the increase in power production year by year offered by the baseline option. The result is a difference in cost for a given amount of power. The assumption is that Germany would be capable of building and financing accordingly.
Expand with new NPPs according to the actual spending of the baseline option. The result is a difference in power production for a given amount of spending. As before, the assumption is that Germany would be capable of building and financing accordingly.
However, the assumptions concerning construction and financing also require triangulation. Starting with construction and construction times, it is well known that the construction time of NPPs varies greatly, and we must identify a realistic solution space. Given that Siemens was heavily involved in the development of the European Pressurized Reactor (EPR) reactor together with mainly Framatome (part of Areva between 2001 and 2017) and Électricité de France (EDF), it is likely that for political reasons new NPPs would have been EPRs. Currently, we have only two data sets as discussed later, but as prototypes these data sets will give a very conservative estimate, known in the nuclear industry as First-Of-A-Kind (FOAK), since little learning has been achieved.
If we assume, that Germany chose the most industrialised reactor design without any export control issues to reduce expenses, however, the country would have ended up with something like the Advanced Pressurized Reactor (APR) from KEPCO of South-Korea. Here, there are many more data sets, as discussed later, but still not fully approaching the Nth-Of-A-Kind (NOAK), which in the nuclear industry designates the long-term equilibrium construction performance of a reactor, and none built in Europe. Arguably, and as a triangulation, the construction times and expenses would be somewhere in between these two extremes.
When it comes to financing, the baseline alternative does not include financial expenses and they should therefore be excluded from the nuclear option expenses. However, it is an important topic to discuss as a caveat because historical evidence shows that financing NPPs is much more difficult than other power plants. With state guarantees, the debt part should be identical concerning required returns for both the baseline alternative and the nuclear alternatives. However, on the investor side the situation is very different. The importance of state guarantees for nuclear power is driven by the fact that nuclear power has several special features that introduce risks for financing (OECD/NEA Citation2009). For example, the politics surrounding nuclear power can range in everything from shutdown or expensive upgrades following the Fukushima accident to more manageable changes in requirements. Lately, the volatility of the electricity prices in the market has become a key concern (OECD/NEA Citation2015).
The baseline alternative has attracted many different investor classes. Nuclear power, however, has a tendency to attract either public financing only or private financing with state guarantees. In this so-called Finnish model, several large industrial electricity consumers are jointly investing in the new plant (as they did in the two existing units at Olkiluoto) through their TVO joint venture (OECD/NEA Citation2009). They invest out of self-interest, i.e. they need the electricity. In the greater picture of nuclear financing, the trends are moving towards a greater involvement of private capital instead of a reduction of the share in public funds through government financing, corporate financing, hybrid financing, project finance including financial models such as Government-to-Government Financing, Loan Guarantees, Host Government-Backed Power Purchase Agreement (PPA), Vendor Financing, and Investor Financing (Terlikowski et al. Citation2019). Thus, there seem to be a growing financial appetite for NPPs, but it boils down to risks and in particular two risks – political risks and construction risks. The latter is solvable as demonstrated by KEPCO and argued convincingly by Zabelle (Citation2024). Political risks, however, seem to follow the politics in individual countries more than anything else. Since Germany opted for a nuclear phase-out, made a priority by the new government in 1998 (Matthes Citation2012), the political risk cannot be handled in this case. It must therefore be axiomatically accepted that this risk is immaterial for the purpose of this paper therefore essentially voiding the financing triangulation. The paper will therefore exclude any financial considerations.
When these factors are taken into account, we must moderate the two approaches above because it is very unlikely to follow either one. A third alternative is therefore presented where Germany will invest in new NPPs on par with another country that has also invested significantly in renewables – China. This is expanded on in Section 4.2.
Finally, it should be noted that the methods used rest upon the scenario planning method. Scenario planning is a tool for strategic thinking (Schwartz Citation1997) and a source for learning (De Geus Citation1988). Note that scenario planning is not about foretelling the future. That is impossible. Scenario planning is about identifying the key parameters and assessing their impact on something. Thus, the paper focuses solely on the two technologies – VREs and nuclear – while keeping the rest of the energy system in Germany as constant. In other words, the analysis will be based on the well-established ceteris paribus (all other things being equal) assumption, which is often key to scientific inquiry, because scientists seek to eliminate factors that perturb a relation of interest (Schlicht Citation1985).
Hence, this paper is not about foretelling or forecasting what an alternative policy of keeping existing NPPs and/or building new NPP capacity would have given in detail, but to rather estimate a likely solution space given that all other things being held constant and financing was available. Due to the large uncertainties, inflation is ignored and all monetary values are in nominal terms. Ignoring inflation makes sense because nuclear contracts are long-term contracts and it is impossible from the outside to estimate the true impact of inflation without having full insight into the execution details.
3. The results of the energiewende – the baseline alternative
There are three key components of the Energiewende; (1) reduce and remove nuclear power, (2) reduce and remove fossil energy sources, and (3) expand environmentally friendly sources defined as wind power, solar power and bioenergy. Note, that Hake et al. (Citation2015) explicate the historical roots of the Energiewende and highlight that it started really in late 70s/early 80s from the anti-nuclear movement in Germany. To estimate the results, we must first estimate the changes in capacity and the associated costs as performed in Section 3.1. Then, the impact on the electricity production and subsequently the indirect expenses are presented in Section 3.2. The reductions in emissions are discussed in Section 3.3.
3.1. Capacity, direct expenditures and future expenditures
The development of the power capacities of Germany during the 20-year period is shown in , and in the capacities are shown in detail. The annual changes are presented in .
Figure 1. Net installed power capacity in Germany 2002–2023. Data source: Energy-Charts.info.
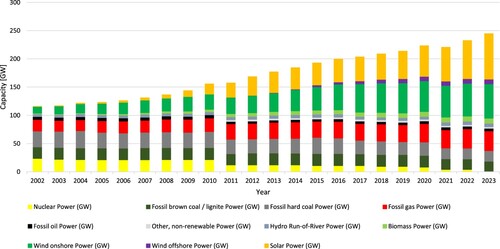
Figure 2. Annual changes in net capacity in Germany 2003–2023. Data source: Energy-charts.info.
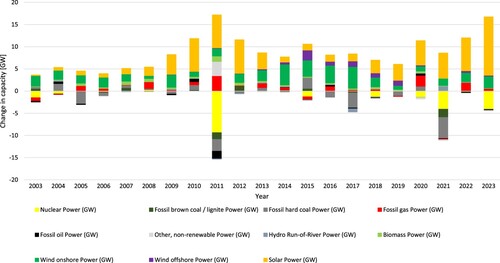
Table 1. Capacities in the German grid 2002–2022. Data source: Energy-Charts.info.
We see that nuclear power is completely missing from the mix by 2023, whereas renewables including hydro, biomass and VREs grew substantially. Natural gas also grew significantly by 71% pushing the total fossil capacity up by 7%. Overall, the capacities of the power system grew by 111%. More careful inspection of the data reveals that the nuclear phaseout came mostly in steps whereas the growth in VREs was more or less continuous, as shown in .
The years 2011, 2021 and 2023 accounted for 74% of nuclear phaseout. The mid-2010s were good years for wind power capacity expansions whereas solar photovoltaics (PV) grew at an almost exponential rate (apart from the latter half of the 2010s) with 2023 reaching 13.2 GW of added capacity and therefore surpassing the record nuclear phaseout of 9.4 GW in 2011 following the Fukushima disaster.
Due to the poor transparency of the costs of executing the Energiewende, as noted earlier, data have to be reconstructed to calculate the expenditures of the baseline option. Data from IRENA (Citation2023) allowed relatively accurate estimates concerning the investments, see .
Table 2. Annual direct expenditures related to wind power and solar power in Germany 2002–2022 in nominal billion USD. Source: Author’s calculations based on data from (IRENA Citation2023). Onshore wind uses numbers from Europe whereas offshore wind and solar power are German numbers. The expenditures are nominal numbers since detailed numbers for every year is not available. The expenditures early in the period are therefore understated due to lack of inflation adjustment. For example, CAPEX of 42.6 bn USD in 2002 would give a much higher amount of adjusted to 2022 numbers. However, the exact project execution profile of the investment decisions in 2002 are unknown and can deviate substantially over years, which implies that the analysis is conservative. Also note that the CAPEX is the cashflow in a specific year and these expenditures are not depreciated over time to reflect costs. For example, the 42.6 bn USD CAPEX will probably be depreciated over 20 years giving an annual cost related to the equipment of roughly 2 bn USD. Due to different accounting rules in different countries, it is therefore best to work with expenditures as cashflow and not cost. Unfortunately, that makes any conversion into the cost of power more difficult, but that is not the topic of this paper.
However, added capacities also have Operations and Maintenance (O&M) expenses for which numbers from Germany are found except for offshore wind, where Ørsted numbers are used. Note that expenses associated with bioenergy are omitted due to very large uncertainties. Also, bioenergy from biomass represents thermal capacity that does not induce the same challenges as VREs because they are controllable, see Emblemsvåg (Citation2021) for a thorough explanation. Ultimately, as we see from , bioenergy from biomass is negligible.
Given these limitations, the numbers in indicate that Germany has spent about 470 bn dollars, nominally. Converted to euros, using the average exchange rate for each year from OECD, the corresponding number in euros is 387 bn. The indirect expenses are discussed later because those expenses depend on actual production and system expenses.
3.2. Changes in electricity production and indirect expenses
From , we see that the electricity production first increased a little and then fell so that the net results for the period is a small decline despite an overall increase in capacity of 111%. As a reference, assuming a Power Capacity Factor (PCF) of 90%, the 23,538 MW of nuclear power in 2002 would itself have given 186 TWh/yr. This can only be achieved by baseload operation.
Figure 3. Electricity production in Germany from 2001 through 2022. Source: Statista.
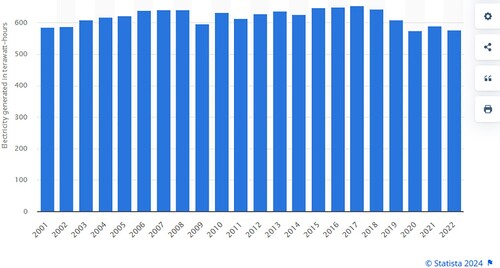
Note that there is an interesting phenomenon called ‘global stilling’ because it essentially implies less wind physically speaking. Since 1980, the effect is about 10% reduction globally (19% in Europe) until 2020 with some variations according to season and month (Zhou et al. Citation2021). The exact causes behind this are still being researched, but it shows the weather risks introduced directly into the power system not by the typical hourly variation of the wind but by its very existence in some years and longer periods.
The impact of high increases in capacity and almost no change in electricity production gives a predictable increase in electricity costs and subsequently prices as any official statistics of Germany will show. Since prices are determined in the market and not directly by the costs and the power costs derived from the expenses depend on a multitude of factors not included in this paper, this paper will not include a discussion on prices except to note that they have increased substantially and are, of course, part of the worries flagged by the German Federal Auditors mentioned initially in Section 1.
We can now estimate the indirect expenditures of the Energiewende, which come in addition to the direct expenditures in Section 3.1, i.e. the EUR 387 bn in nominal terms. Essentially, the total expenditures of the Energiewende are the sum of the expenditures that the power plant owners have used (dubbed direct expenditures in this paper) and the sum of the expenditures that society in addition have used to make the system work, i.e. subsidies, and subtracted any profits. This is where we run into a methodological challenge to avoid double counting.
Obviously, some of the subsidies would cover direct expenditures and some would have resulted in profits, but we do not know how much. Furthermore, there are expenditures of maintaining grid stability through either import/export and keeping dispatchable fossil power plants running. Let us start by trying to grasp the subsidies.
According to Zaboji (Citation2021), the subsidies in the period 2017–2019 were EUR 26.3 bn, EUR 26.7 bn, EUR 26.3 bn and EUR 30.9 bn, respectively. The German Transmission System Operators estimated the subsidies in 2021 to amount to EUR 33.1 bn (50Hertz Transmission GmbH et al. Citation2021). A few years earlier, Bundesrechnungshof (Citation2018) estimated the subsidies in the period 2013–2017 to EUR 160 bn, and that 2017 alone required EUR 34 bn, which is EUR 8 bn higher than the 2017 estimate of Zaboji (Citation2021). In 2016, the total cost up to 2025 was estimated at EUR 520 bn by Haucap et al. (Citation2016) – a number referenced by the Bundestag, i.e. the German National Assembly. It is unclear whether this number is expenses or costs. Unnerstall (Citation2017) states that by yearend 2016 the amount had run up to almost EUR 500 bn, which by now should be somewhere around EUR 700 bn. However, he has calculated the costs and not expenditures and included other costs such as the costs of prematurely closing NPPs. The closures of existing NPPs are estimated by two studies to cost EUR 45–50 bn (Keppler Citation2012), which is within the margin of error.
The most complete overview of subsidies is provided by BDEW (Citation2023). Unfortunately, they offer yet another set of numbers and not for the years 2003, 2005, 2007, 2009 and 2011. However, by using linear interpolation for these odd years, we can construct data set shown graphically in . The sum of each year is shown on top of each column and the total, nominal sum for the period is EUR 490.6 bn. Simply adding this number with the estimated direct expenditures from Section 3.1 will give EUR 877 bn and almost certainly with a significant amount of double-counting.
Figure 4. Total burden of taxes, fees and levies in bn euros excluding VAT. Data source: (BDEW Citation2023).
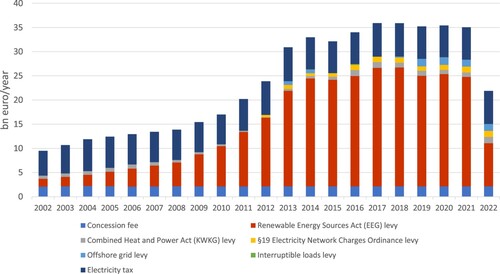
This sum contains fees, taxes and levies. If we remove the fees and taxes that are likely to be spent across the entire power system since they were similar in 2002, and focus only on the levies, then we obtain a total nominal subsidy of EUR 309.5 bn. This nominal subsidy is the difference between the money earned from selling power in the market and the actual costs to ensure financial viability for the power industry. The sum of subsidies and revenues should be the same as the sum of all costs and profits, but unfortunately not cashflow.
However, if we assume 20 years depreciation of the USD 400 bn CAPEX, add the OPEX and the nominal subsidies, we end up roughly around EUR 400 + bn. Then, adding the costs of prematurely closing NPPs, etc., it seems that the costs and cashflow numbers match sufficiently well to conclude that the cashflow numbers presented in are roughly right. The result is a total net expenditure of EUR 696 bn for Energiewende per yearend 2022.
Although using cashflow numbers made the triangulation of numbers compared to other estimates somewhat more difficult, it becomes easier for the next step because we can focus on CAPEX and OPEX of nuclear alternatives without taking into account different depreciation rules for different asset classes. First, however, the environmental results are discussed.
3.3. The improvements in climate gas emissions
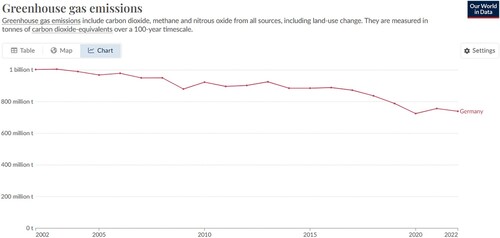
The GHG emissions are shown in . The emissions in 2002 from fossil energy consumption and industry were 999 million tonnes and 20 years later they were 746 million tonnes, or 25% reduction.
Figure 5. GHG emissions in Germany 2002–2021. Source: Our World in Data.
Given the large costs and expenses, it is understandable that Bundesrechnungshof (Citation2021b) states that
The energy transition is a topic that has already been addressed by the German Federal Audit Office [Bundesrechnungshof] on several occasions. This was the case in 2016 and in a special report most recently in 2018. At that time, we came to the conclusion that the BMWi was insufficiently coordinating and inadequately managing the energy transition. And that the enormous effort and the great burdens on citizens and the economy were disproportionate to the meagre return that had been achieved up to that point
The emission increase from 2021 to 2022 is due to coal consumption being increased. Indeed, while the German federal government discusses the closure of coal power plants, the Budensnetzagentur (the Federal Network Agency) recently vetoed the decision to close coal power plants (Wetzel Citation2023) due to system criticality. Reliability, which is a major part of system stability, is also key for the process industry because such industries need 100% reliability (Emblemsvåg Citation2023). Thus, there are reliability and stability issues of the Energiewende that a more detailed analysis should include particularly concerning future ambitions of increasing VREs even more. We also have other issues to discuss in order to complete the picture but they are addressed in Section 5.0 since they are beyond the scope of this paper.
4. The nuclear alternatives
As noted earlier, first we must estimate the cost of keeping the NPPs Germany had in 2002, and second, how much new NPP capacity could have been built and the results given the limitations discussed earlier.
4.1. The cost of keeping NPPs Germany had in 2002
Keeping the German NPPs in operations is assumed to be Long-Term Operations (LTO). LTO of NPPs can be defined as ‘operation beyond an established time frame which has been justified by a comprehensive safety assessment’ (IAEA Citation2008), and some NPPs have extended their lifespan to 80 years.
Data from IEA (Citation2020) and the IEA LCOE Calculator online are useful. The data are based on a refurbishment period of two years, fixed O&M expenses of USD 85,000/MW, variable O&M costs of USD 1500/MWh, front-end fuel costs of USD 7000/MWh and back-end fuel cost (decommissioning and storage of waste) of USD 2330/MWh. The German NPPs in 2002 had a capacity of 23.5 GW and an annual production of about 185.6 TWh/yr assuming a PCF of 90%, which is comparable to US NPPs under LTO.
In we see the undiscounted numbers split into different countries and different LTO approaches, but modelled as triangular uncertainty distributions as shown in to account for the uncertainties of assessing where the German NPPs would have been in comparison to the ones in . Thus, we assume that Germany would be neither worse not better than any of the ones in . Furthermore, by mixing 20-year and 10-year LTOs, we take into account the fact that we do not know exactly which ones would apply. This has a significant impact on the CAPEX as the 20-year LTO gives roughly half the cost per MWh compared to the 10-year LTO. The annual expenses will then become about USD 5.5 bn or USD 110.6 bn in total (or EUR 91.3 bn) over the 20-year period, or about twice the amount of prematurely closing them.
Figure 6. CAPEX and OPEX uncertainty distributions derived from .
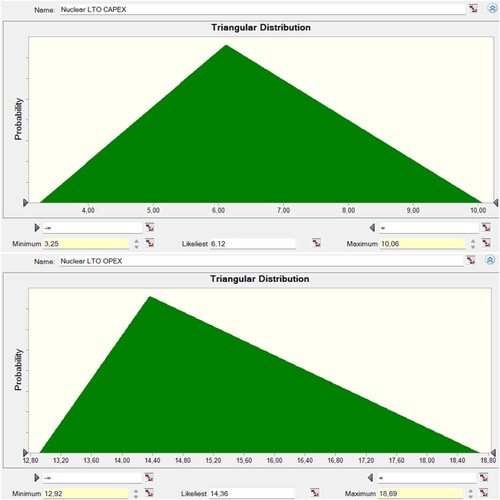
Table 3. Operation, maintenance and fuel costs for NPPs at LTO. Source: IAE LCOE Calculator.
By inserting these uncertainty distributions into the model for keeping operational the NPPs in 2002, the expenses of keeping the NPPS in 2002 operational would have an expected value of 91.3 bn euros nominally ranging linearly from 82.6 to 103.2 bn euros nominally – a span of more than EUR 20 bn.
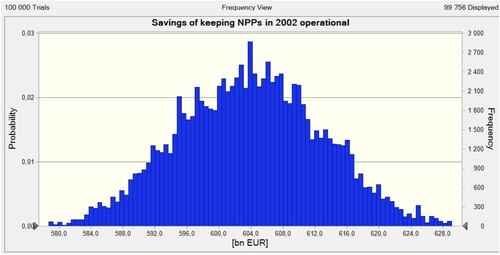
By adding ±10% uncertainty to the current policy numbers to account for the uncertainty not specified by the sources, we obtain the result shown in . Clearly, keeping the NPPs in 2002 would have given much lower expenses compared to the current policy in nominal terms although there is an uncertainty span of almost EUR 50 bn nominally.
Figure 7. The savings of keeping the 2002 NPPs operational compared to the Energiewende policy.
The result in terms of reduced climate gas emissions, would be almost the same as today since the annual production of VREs (181.8 TWh/yr) and the annual production of NPPs in 2002 (185.6 TWh/yr) are roughly the same given that the NPPs operated under baseload policy.
4.2. The cost of new NPPs for Germany
Due to all the intricacies of constructing new NPPs discussed in Section 2, this part of the paper is by far the most difficult. Furthermore, to simplify the analysis we assume that the facilities would go online at the start of 2023 to avoid the politics of funding such megaprojects (except construction loans) and project execution issues. Therefore, we must limit ourselves to NPPS that have taken a maximum of 20 years to construct to have a verifiable case.
Given that Germany would have spent an expected EUR 91.3 bn to keep the NPPs at yearend 2002 in operations until yearend 2022, Germany would have had roughly EUR 600 bn to construct new nuclear capacities. However, the number and their capacities will depend on many factors. Therefore, to assess a possible outcome, we must select relatively realistic reactor designs and identify real life data sets because plans often deviate substantially from reality during the construction of NPPs. It is highly likely that Germany would have seriously considered the EPR 1600 design (nameplate capacity of 1600 MW), as discussed earlier.
Here, we have one data set – Olkiluoto 3 (OL3) in Finland – which took 199 months from construction start to grid connection despite being FOAK (World Nuclear Association Citation2023). Note that most energy projects start much earlier than construction and for NPPs it varies substantially. Hence, we must assume that the politics of going for new NPPs would already have been settled so that construction would have started not too long after 2002. The costs of OL3 ended up three times higher than planned at about 11 bn euros (Proctor Citation2023).
At the other end, we have Barakah in the UAE, considered by the IAEA to be ‘an example of turning vision into reality’, according to Rafael Mariano Grossi, IAEA Director General (Madsen Citation2021). Here, South Korean KEPCO together with UAE built 4 APR 1400 in 12 years with a combined nameplate capacity of 5600 MW and a cost of USD 32 bn (Power Technology Citation2020). This project performed well along all four categories that (OECD/NEA Citation2020) identify as critical for low cost and short construction time; (1) design and supply chain maturity; (2) effectiveness of project management; (3) nuclear safety regulation stability and predictability; and (4) policy framework (in terms of political leadership and multi-unit projects). Indeed, costs fell more than 50% between the first and the fourth units at Barakah (Gogan Citation2019).
Furthermore, overruns in NPP projects consist primarily of indirect costs, including the nonrecurrent costs associated with deploying a new generation of reactors (OECD/NEA Citation2020). It is therefore unlikely that if Germany built new NPPs they would on average come close to the OL3 experience. However, the difficult part is to make reasonable assumptions concerning how many could have been built. In , we get the numbers of using the data above ignoring construction capacity bottlenecks of any sort resulting in an average, triangulated ‘Average NPP.’ The result clearly indicates that Germany could have had a completely carbon free power grid if the country had invested in new NPPs. On average, a 1000 TWh/yr added.
Table 4. Investment alternatives to illustrate ideal solution space; Olkiluoto 3 and Barakah.
Note that NPPs offer more than electricity, and in 1/3 is electric and more than 80% of the total energy is possible to use (Partanen Citation2017) for district heating, production of fresh water, industry purposes and much more. The importance of considering the entire energy production from thermal power plants, and not just electricity, is illustrated well by (Emblemsvåg Citation2023) who investigates using nuclear power as an alternative to wind power with balancing power on a large industrial facility in Norway called Melkøya. The findings show that the nuclear alternative costs half of the wind power alternative partly due to the utilisation of thermal rest energy. Thus, using one of the most expensive NPP technology – the EPR 1600 – would have given better results and an almost emission-free power system than the current policy even when no learning effects are included.
However, the challenge with this simple model is that it is most likely impossible to execute in real life due to the sheer volume on a single technology and company at the same time. In comparison, currently, there are 56 with a combined effect of 57.8 GW under construction.Footnote1 In other words, Germany would have to assume the entire world NPP construction capacity according to the simple model above. That would, obviously, have been an impossibility in 2002. It would not have been an impossibility earlier. 95 GW came online between 1970 and 1990 after another 67 planned builds were cancelled from 1979 through 1988 (US EIA Citation2017). Thus, the level of ambitions was very high but only partially executed due to the Three Mile Island accident.
Thus, the results in would require a setting in Germany in 2002 similar to the US in the 70s prior to Three Mile Island accident, which is very unrealistic today. A more realistic approach would have been to follow China’s rise because it is demonstrated in real life after the major nuclear accidents. In 2010, China’s nuclear production barely surpassed German in 2002, and it can therefore serve as a reference year. Using the growth in VREs in both countries to scale the new German NPPs according to the Chinese construction tempo but using the Average NPP in , gives the results in .
Table 5. New German Average NPPs built in the tempo of China but scaled to match overall energy system investments.
The second column shows the Chinese nuclear production scaled to German context using the investments in renewables as guide as a proxy for investment appetite. The fall from 2019 is the result of the scaling mechanism, but to reflect the fact that Germany kept the NPPs in 2002 and built new NPPs the fall from 2019 and onwards is ignored meaning that the output from new German NPPs flattens out at 186.3 TWh/yr. Using this logic, the first new NPP in Germany would have been operational in 2010 with 1477 MW electric capacity, i.e. the Average NPP in . Then, several NPPs would have followed in the consecutive years with the last in 2019. All in all, this construction process would have given a doubling compared to 2002.
In real life, this plan could only have been realised if the construction plans were already developed, because we are discussing construction time without all the politics that often come with nuclear power. Despite the large variation in reactor construction times, the median construction time for reactors grid-connected in 2022 was little changed from that in 2021, being one month longer, at 89 months (World Nuclear Association Citation2023), or seven years and 5 months. Thus, the model assumes average performance of the Germans in this respect, which is not unrealistic.
In , the results are presented graphically. In the upper section, we see that keeping the existing NPPs in 2002 would have reduced the need for spending by about EUR 5 bn per year, however, it is not until the new NPPs come online in 2010 that we see significant improvements. All in all, the nuclear policy including keeping the existing NPPs in 2002 operational, would have required an expenditure of EUR 364 bn, which is EUR 332 bn less than Energiewende.
Figure 8. Nuclear versus Energiewende. Authors calculations.
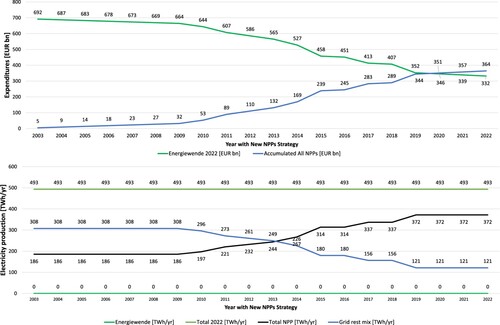
From the lower section of , we see the impact on power production. On top, we find the total production in 2022 as a reference. At the bottom we find Energiewende indicating that there would be no need for any VREs at any point in time if the NPPs in 2002 were kept intact and fully operational. This is easy to understand since the existing NPPs in 2002 produced 185.6 TWh/yr whereas the VREs only produced 181.8 TWh/yr. Furthermore, we see as the expansion of new NPPs comes into force from 2010 and onwards, the rest mix in the grid would fall. Indeed, in 2022 the rest mix in the grid would be 121 TWh/yr out of which 58.9 TWh/yr would be fossil – a 73% reduction compared to the actual situation in 2022 (216.1 TWh/yr). Germany would then also have reached its climate goals by a huge margin.
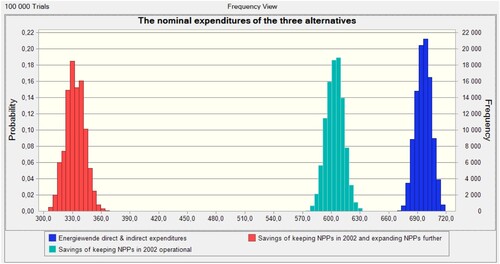
In , the same results are shown including data uncertainties. Furthermore, the alternatives are more clearly formulated using Energiewende expenditures as baseline and the two others as savings compared to Energiewende. The closure of all Germany NPPs has therefore been very costly and the improvements generated by the expansion of VREs have been offset so that the net result is nil. A further expansion of NPPs, however, would have secured Germany its climate gas emission targets at much lower expenditures.
Figure 9. The expenditure of Energiewende and possible savings of alternatives policies with uncertainty.
Given these results, there can be no doubt whatsoever that if Germany had invested in NPPs instead of VREs, Germany would have decarbonised more with far less nominal expenditures. The short conclusion is that Germany would have reached its climate goals with a substantial margin at half the expenditures of Energiewende.
5. Critical review of research
The paper offers a simple comparison of two alternative policies compared to a baseline (Energiewende). All alternatives have their data availability challenges. However, some reasonable triangulation of data from various sources has provided a relatively fair estimate for all three alternatives. When it comes to nuclear expenditures, the challenge is more the large spread in the data available. To overcome this challenge, the average of two extremes is used together with verified data from LTO operations.
The LTO data are overall quite reliable, which means that keeping the NPPs in 2002 alone would have given more emission-free power than all the VREs in 2022 and more than EUR 500 bn saved. This conclusion is robust even if major discrepancies in the data exist. The challenge is far greater when modeling new NPPs.
The study has made some simplifications that are easy to question. First of all, the very strategy of building new NPPs itself is negated by German politics for the last 20 years, where closing all NPPs has been an objective in itself. Thus, the paper sets aside the established politics. Furthermore, the paper has, as an extension, also assumed that financing will be available at reasonable rates comparable to other nuclear projects in the world. Given that the politics was resolved, this is a far less questionable assumption as argued earlier simply by observing what is taking place elsewhere in the world.
Then, the results rely on a more recent historically verified construction tempo scaled to German context than the rapid expansion observed in the 70s. The quality of this approach can always be questioned, but since it is actually within current construction experiences its main drawback is that it presupposed politically backed plans for further expansion of NPPs existing in Germany in 2002.
The analysis also assumes baseload operation for the NPPs, which would have been technically possible only if Germany had been allowed to export and import larger volumes than today. The impact on the power costs could have been substantial. At baseload operation NPPs often run at a PCF of 90%, while ramping up and down more to demand (load-following mode) would bring it more to the French level of 60–80% (World Nuclear Association Citation2023). Therefore, the actual decarbonisation of the German grid would most likely be lower than shown unless export/import was possible on larger scale than today. However, it is unlikely to worsen to the extent that the climate goals would not have been met.
Including the financial costs should ideally be done, but it is very difficult for two reasons. First, energy project financing is very political. Second, the inherent uncertainties of the expenditures of Energiewende and new NPPs would make a fair comparison unlikely. Thirdly, estimating the impact on power prices and potential subsidies would be difficult due to import/export balance, how loads would have been handled, the details of constructing and financing the new NPPs, the utilisation of thermal rest energy and hence location of the new NPPs and much more.
Finally, the analysis operates on an annual level, which is very low resolution for power systems. A model operating at hourly resolution would improve some of the issues addressed above. However, it is unlikely to alter the conclusion because two of the critical issues in this paper cannot be resolved by increasing the resolution – the first issue is the actual expenses of Energiewende and their causality to VREs (and not any other factors), and the second issue is the construction of new NPPs and all the project related intricacies. Therefore, the presented study should be seen as an estimate and not an accurate simulation.
We must not forget that there are positive aspects of nuclear power that are ignored. First and foremost, NPPs offer almost twice the amount of thermal rest energy that can be used compared to its electrical output. VREs offer no such thermal energy component, which means that VREs will always require more capacity than NPPs even if we ignore the difference in PCF in favour of NPPs as illustrated by Emblemsvåg (Citation2023).
The fuel costs of NPPs normally include decommissioning and waste handling. At the end of a plant’s lifetime, decommissioning and waste management costs are linearly spread over the decommissioning period, and the operator makes annual contributions to a Decommissioning Trust Fund during operations whose sum plus accrued interest will eventually correspond to the estimated total costs of decommissioning (IEA Citation2020). The model does not include the expenditures of establishing a German depository of nuclear waste. The cost of this, however, is far less than the value of the rest energy in the waste. It is estimated that the nuclear waste in the US can power the country for 100 years but the technology is not yet commercially available (Clifford Citation2024).
In contrast, substantial future costs for the Energiewende are missing associated with (1) the cost of expanding the grid physically since wind power often is generated at places far from consumers, (2) the subsidies controllable generators received to stay operational in case the wind is missing and the sun does not shine, (3) subsidies of bioenergy, (4) the costs of prematurely closing NPPs, (5) the subsidies of securing revenues to VREs when overproduction drive electricity prices down towards zero or even negative, (6) the costs of removing the power plants and (7) handling the waste.
The latter will become substantial costs as VRE waste has negative value (costs higher than selling price). By 2050, 43 million tonnes of rotor blade waste is expected globally (Liu and Barlow Citation2017), and recycling is minimal (Martin Citation2020). Another 78 million tonnes solar panels are expected globally by 2050 (IRENA Citation2016). Recycling is at the same level of ordinary e-waste, i.e. approximately 20% (Liu et al. Citation2023) or 40% in the EU (European Parliament Citation2023), but e-waste is projected to double by 2050 (Parajuly et al. Citation2019). Major volume of rest waste is sent to Afrika for further processing (Kaledzi Citation2022).
Energiewende has also performed poorly on energy security due to its reliance of gas power for balancing and backup purposes as the war in Ukraine revealed. It is illustrative that the energy crisis cost Germans EUR 1500 bn (Woodard et al. Citation2023), which would have been avoided if Germany had not relied on gas imports from Russia. Of course, the benefits of hindsight are advantageous. However, the weaponisation of energy cannot be ignored anymore as the situation in 1973 was not that different (LaBelle Citation2023).
The impact on competitiveness is another alternative cost that is not factored into this paper, but it should be kept in mind. Indeed, Emblemsvåg and Ôsterlund (Citation2023) performed a study of the energy trilemma whereby they show that a large number of US states have outperformed Germany on emission reductions, market volatility and electricity prices. Thus, there can be no questions about the fact that Energiewende has also had some non-financial costs that are substantial for the country.
The overall competitiveness of the 27 EU countries has lost out to the US on industry retail electricity prices, in particular (European Commission Citation2020), and the same can be said about Germany. Moreover, as early as 2013, the IEA sounded a warning on Energiewende, and IEA Executive Director Maria van der Hoeven said that ‘The fact that German electricity prices are among the highest in Europe, despite relatively low wholesale prices, must serve as a warning signal,’ as she presented the report (IEA Citation2013). The German Federal Accounting Office has also sounded the alarms repeatedly as mentioned in Section 1.
Thus, for all its weaknesses, this simple study does not err on the positive side of nuclear apart from the political aspects and the spill-over effects of politics into financing.
6. Concluding remarks
The paper has attempted to estimate the expenditures and climate gas reductions of the current energy transition policy known as Energiewende, pursued by Germany over the last 20 years. The results are subsequently compared to an alternative policy where NPPs in 2002 are kept in operation and new additional NPPs are built. There are many aspects not covered in this simple analysis, which means that keeping an eye on assumptions is important.
However, regardless of uncertainties in data and assumptions, there can be no doubt that if the political environment in Germany had been favourable to NPPs in 2002, the country would have fared far better than with the current Energiewende both concerning expenditures and climate gas emissions. In the grand scheme, the alternative policy of keeping existing NPPs in 2002 and building new NPPs would have cut expenditures in half and Germany would have secured its climate goals in the process.
Acknowledgement
The author would like to express his gratitude towards three anonymous reviewers and their highly valuable comments which have been incorporated in this final version of the manuscript.
Disclosure statement
No potential conflict of interest was reported by the author(s).
Notes
1 According to the IAEA Power Reactor Information System (PRIS), accessed 2024-04-15 from PRIS – Reactor status reports – Under Construction – By Country (iaea.org).
References
- 50Hertz Transmission GmbH, Amprion GmbH, TenneT TSO GmbH and T. GmbH. 2021. “2021 EEG Surcharge Capped at 6.5 cents per Kilowatt-Hour, Requiring Federal Subsidy of €10.8 billion.” http://www.netztransparenz.de/EEG/Mittelfristprognosen/Mittelfristprognose-2021-2025, 50Hertz Transmission GmbH.
- BDEW. 2023. BDEW-Strompreisanalyse Dezember 2023: Haushalte und Industrie (BDEW Electricity Price Analysis December 2023: Housholds and Industry). Berlin: BDEW (Bundesverband der Energie- und Wasserwirtschaft e. V.).
- Bryman, A., et al. 2004. Triangulation.Encyclopedia of Social Science Research Methods, edited by M. S. Lewis-Beck and A. Bryman, 1143–1144. Thousand Oaks, CA: Sage.
- Bundesrechnungshof. 2018. Bericht Nach § 99 BHO über die Koordination und Steuerung zur Umsetzung der Energiewende Durch das BMWi (Report According to § 99 BHO on the Coordination and Management of the Energy Transition by the BMWi). Bonn: Bundesrechnungshof.
- Bundesrechnungshof. 2021a. Bericht Nach § 99 BHO zur Umsetzung der Energiewende im Hinblick auf die Versorgungssicherheit und Bezahlbarkeit bei Elektrizität (Report According to § 99 BHO on the Implementation of the Energy Transition with Regard to Security of Supply and Affordability of Electricity). Bonn: Bundesrechnungshof.
- Bundesrechnungshof. 2021b. The Federal Government Continues to Manage the Energy Transition Inadequately. Bonn: Bundesrechnungshof. Accessed 2023-12-27 from https://www.bundesrechnungshof.de/SharedDocs/Statements/DE/2021/energiewende.html.
- Bundesrechnungshof. 2023. Climate Protection, Property Management, IT Security, Taxes, Transport, Federal Financial aid, Archiving. Bonn: Bundesrechnungshof. Accessed 2023-12-27 from https://www.bundesrechnungshof.de/SharedDocs/Pressemitteilungen/DE/2023/ergaenzungsband-2022.html?nn=23488.
- Clifford, C. 2024. The Energy in Nuclear Waste Could Power the U.S. for 100 Years, but the Technology was Never Commercialized. CNBC. Accessed 2024-04-15 from https://www.cnbc.com/2022/2006/2002/nuclear-waste-us-could-power-the-us-for-2100-years.html.
- Cooper, R. 1990. “Explicating the Logic of ABC.” Management Accounting (UK) 68 (November): 58–60.
- De Geus, A. P. 1988. “Planning as Learning.” Harvard Business Review 66 (March-April): 70–74.
- Denzin, N. K. 1970. The Research act in Sociology: A Theoretical Introduction to Sociological Methods. London: Butterworths.
- Donovan, J. 2023. Nuclear Energy Makes History as Final COP28 Agreement Calls for Faster Deployment. Vienna: International Atomic Energy Agency (IAEA). Accessed 2023-12-27 from https://www.iaea.org/newscenter/news/nuclear-energy-makes-history-as-final-cop2028-agreement-calls-for-faster-deployment.
- Emblemsvåg, J. 2021. “Wind is Not Sustainable When Balanced by Fossil Energy.” Applied Energy 305. https://doi.org/10.1016/j.apenergy.2021.117748
- Emblemsvåg, J. 2023. “Powering Large Industrial Facilities – Using Wind- or Nuclear Power?” International Journal of Sustainable Energy 42 (1): 1241–1263. https://doi.org/10.1080/14786451.2023.2260008
- Emblemsvåg, J., and G. Cokins. 2021. “The ABCs of Calculating Hourly Cost Rates.” Cost Management 35 (May/June): 5–22.
- Emblemsvåg, J., and A. Ôsterlund. 2023. “How the Energy Trilemma Can Provide Learning Points Between Countries – the Case for Nuclear.” Internation Journal for Nuclear Power 68 (2): 31–42.
- European Commission. 2020. Study on Energy Prices, Costs and Their Impact on Industry and Households. Brussels: The European Commission.
- European Parliament. 2023. E-waste in the EU: Facts and Figures (Infographic). Brussels: European Parliament. Accessed 2023-12-27 from https://www.europarl.europa.eu/news/en/headlines/society/20201208STO20293325/e-waste-in-the-eu-facts-and-figures-infographic.
- Gogan, K. 2019. “The Potential for Nuclear Cost Reduction.” International Conference on Climate Change and the Role of Nuclear Power, Vienna, International Atomic Energy Agency (IAEA), Department of Nuclear Energy, 7–11 October 2019. Accessed 2024-04-15 from https://inis.iaea.org/search/search.aspx?orig_q=RN:52006627.
- Hake, J.-F., W. Fischer, S. Venghaus, and C. Weckenbrock. 2015. “The German Energiewende – History and Status Quo.” Energy 92: 532–546. https://doi.org/10.1016/j.energy.2015.04.027
- Haucap, J., I. Loebert, and S. Thorwarth. 2016. Kosten der Energiewende: Untersuchung der Energiewendekosten im Bereich der Stromerzeugung in den Jahren 2000 bis 2025 in Deutschland. Düsseldorf: DICE Consult.
- Howell, R. A., and W. A. Schwartz. 1997. “Asset Deployment and Investment Justification.” In Handbook of Cost Management, edited by B. J. Brinker, D4-1–D4-32. Boston, MA: Warren, Gorham & Lamont.
- IAEA. 2008. The Economic Assessment of Long-Term Operation of Nuclear Power Plants: Approaches and Experience.IAEA Nuclear Energy Series. Wien: International Atomic Energy Agency (IAEA), Department of Nuclear Energy, Nuclear Power Technology Development Section (NPTDS).
- IEA. 2013. Energy Policies of IEA Countries; Germany 2013 Review. Paris: International Energy Agency (IEA) / Organization for Economic Co-operation and Develop (OECD).
- IEA. 2020. Projected Costs of Generating Electricity. Paris: International Energy Agency (IEA) / Organization for Economic Co-operation and Develop (OECD).
- IRENA. 2016. End-of-life Management: Solar Photovoltaic Panels. Abu Dhabi: United Arab Emirates,International Renewable Energy Agency (IRENA).
- IRENA. 2023. Renewable Power Generation Costs in 2022. Global Energy Transformation Paper. Abu Dhabi: United Arab Emirates, International Renewable Energy Agency (IRENA).
- Jick, T. D. 1979. “Mixing Qualitative and Quantitative Methods: Triangulation in Action.” Administrative Science Quarterly 24 (4): 602–611. https://doi.org/10.2307/2392366
- Kaledzi, I. 2022. “Activists Slam Europe for Dumping on Africa. Deutsche Welle.” Accessed 2023-12-27 from https://www.dw.com/en/activists-slam-europe-for-dumping-on-africa/a-61315412.
- Keppler, J. H. 2012. “The Economic Costs of the Nuclear Phase-out in Germany.” NEA News 30 (1): 8–14.
- LaBelle, M. C. 2023. “Energy as a Weapon of War: Lessons from 50 Years of Energy Interdependence.” Global Policy 14 (3): 531–547. https://doi.org/10.1111/1758-5899.13235
- Lawlor, D. A., K. Tilling, and G. Davey Smith. 2016. “Triangulation in Aetiological Epidemiology.” International Journal of Epidemiology 45 (6): 1866–1886. https://doi.org/10.1810/1093ije/dyw1314
- Liu, P., and C. Y. Barlow. 2017. “Wind Turbine Blade Waste in 2050.” Waste Management 62: 229–240. https://doi.org/10.1016/j.wasman.2017.02.007
- Liu, K., Q. Tan, J. Yu, and M. Wang. 2023. “A Global Perspective on e-Waste Recycling.” Circular Economy 2 (1), https://doi.org/10.1016/j.cec.2023.100028.
- Madsen, M. A. 2021. IAEA Chief in the UAE: Nuclear Energy Key to Country’s Climate Action. International Atomic Energy Agency (IAEA), Office of Public Information and Communication. Accessed 2022-01-20 from https://www.iaea.org/newscenter/news/iaea-chief-in-the-uae-nuclear-energy-key-to-countrys-climate-action.
- Martin, C. 2020. “Wind Turbine Blades Can’t Be Recycled, So They’re Piling Up in Landfills.” Bloomberg: Accessed 2023-12-27 from https://www.bloomberg.com/news/features/2020-2002-2005/wind-turbine-blades-can-t-be-recycled-so-they-re-piling-up-in-landfills.
- Matthes, F. C. 2012. “Exit Economics: The Relatively low Cost of Germany’s Nuclear Phase-out.” Bulletin of the Atomic Scientists 68 (6): 42–54. https://doi.org/10.1177/0096340212464360
- Mertens, D. M., and S. Hesse-Biber. 2012. “Triangulation and Mixed Methods Research: Provocative Positions.” Journal of Mixed Methods Research 6 (2): 75–79. https://doi.org/10.1177/1558689812437100
- Munafò, M. R., and G. Davey Smith. 2018. “Robust Research Needs Many Lines of Evidence.” Nature 553 (7689): 399–401. https://doi.org/10.1038/d41586-018-01023-3
- OECD/NEA. 2009. The Financing of Nuclear Power Plants. Paris: Organization for Economic Cooperation and Development (OECD), Nuclear Energy Agency (NEA).
- OECD/NEA. 2015. Nuclear New Build: Insights Into Financing and Project Management. Paris: Organization for Economic Cooperation and Development (OECD), Nuclear Energy Agency (NEA).
- OECD/NEA. 2020. Unlocking Reductions in the Construction Costs of Nuclear: A Practical Guide for Stakeholders. Paris: Organization for Economic Cooperation and Development (OECD), Nuclear Energy Agency (NEA).
- Parajuly, K., R. Kuehr, A. K. Awasthi, C. Fitzpatrick, J. Lepawsky, E. Smith, R. Widmer, and X. Zeng. 2019. Future E-Waste Scenarios. Osaka: United Nations Environment Programme (UNEP), International Environmental Technology Centre (IETC).
- Partanen, R. 2017. Decarbonizing Cities: Helsinki Metropolitan Area: Providing District Heating, Power and Transportation Fuels with Advanced Nuclear Reactors. Helsinki: Energy for Humanity.
- Power Technology. 2020. Barakah Nuclear Power Plant. Verdict Media Limited. Accessed 2023-12-28 from https://www.power-technology.com/projects/barakah-nuclear-power-plant-abu-dhabi/.
- Proctor, D. 2023. “Olkiluoto 3 Finally Online in Finland; Germany Closes Last Three Nuclear Plants.” Power: Accessed 2024-04-15, from https://www.powermag.com/olkiluoto-2023-finally-online-in-finland-germany-closes-last-three-nuclear-plants/.
- Schlicht, E. 1985. Isolation and Aggregation in Economics. Berlin: Springer Verlag.
- Schwartz, P. 1997. The Art of the Long View. New York: John Wiley and Sons.
- Terlikowski, P., J. Paska, K. Pawlak, J. Kaliński, and D. Urbanek. 2019. “Modern Financial Models of Nuclear Power Plants.” Progress in Nuclear Energy 110 (January): 30–33. https://doi.org/10.1016/j.pnucene.2018.09.010
- UNECE. 2021. Life Cycle Assessment of Electricity Generation Options. Geneva: United Nations Economic Commission for Europe (UNECE).
- Unnerstall, T. 2017. “How Expensive is an Energy Transition? A Lesson from the German Energiewende.” Energy, Sustainability and Society 7 (38). https://doi.org/10.1186/s13705-13017-10141-13700.
- US EIA. 2017. Most U.S. Nuclear Power Plants Were Built Between 1970 and 1990. Today in Energy. Washington, DC: US Energy Information Administration. Accessed 2024-04-15 from https://www.eia.gov/todayinenergy/detail.php?id=30972.
- US SEC. 2014. Beginners’ Guide to Financial Statements. Washington DC: U.S. Securities and Exchange Commission (SEC), Office of Investor Education and Advocacy. https://www.sec.gov/oiea/reports-and-publications/investor-publications/beginners-guide-financial-statements.
- Webb, E. J., D. T. Campbell, R. D. Schwartz, and L. Sechrest. 1966. “Unobtrusive Measures: Nonreactive Research in the Social Sciences.” Social Forces 45 (2): 290–291. https://doi.org/10.2307/2574409
- Wetzel, D. 2023. Verbot der Stilllegung – Bundesnetzagentur überrascht mit Veto Gegen Kohleausstieg (Ban on Decommissioning – Federal Network Agency Surprises with Veto Against Coal Phase-out). Berlin: Die Welt. https://www.welt.de/wirtschaft/plus249179614/Verbot-der-Stilllegung-Bundesnetzagentur-ueberrascht-mit-Veto-gegen-Kohleausstieg.html.
- Woodard, J., J. Glascock, P. Block, D. Harris, and C. Flanagan. 2023. The RIC Report: The Nuclear Necessity. New York: Bank of America Securities, Research Investment Committee.
- World Nuclear Association. 2023. World Nuclear Performance Report 2023. London: World Nuclear Association.
- Zabelle, T. R. 2024. Built to Fail: Why Construction Projects Take So Long, Cost Too Much, And How to Fix It. Jersey City, NJ: Forbes Books.
- Zaboji, N. 2021. Ökostromförderung Erreicht Rekord (Green Electricity Subsidies Reach Record). Frankfurt: Frankfurter Allgemeine. https://www.faz.net/aktuell/wirtschaft/klima-energie-und-umwelt/30-39-milliarden-euro-oekostromfoerderung-erreicht-rekord-17141915.html.
- Zhou, L., Z. Zeng, C. Azorin-Molina, Y. Liu, J. Wu, D. Wang, D. Li, A. D. Ziegler, and L. Dong. 2021. “A Continuous Decline of Global Seasonal Wind Speed Range Over Land Since 1980.” Journal of Climate 34 (December): 9443–9461. https://doi.org/10.9410/1175JCLI-D-9421-0112.9441
