
 ?Mathematical formulae have been encoded as MathML and are displayed in this HTML version using MathJax in order to improve their display. Uncheck the box to turn MathJax off. This feature requires Javascript. Click on a formula to zoom.
ABSTRACT
Modelling the effect of reaction time, catalyst concentration, and oil-to-methanol ratio on the waste cooking oil biodiesel was studied using response surface methodology. Biodiesel was made using three different heterogeneous catalysts. Analysis showed catalysts 2 and 3 to be significant in transesterification. However, all catalysts had second-degree significance for esterification yield. For catalysts 1 and 2 there was a clear interaction between catalyst concentration and oil-to-methanol ratio. Clear interaction was also noticed between reaction time and oil-to-methanol ratio for all catalysts. There was moderate to no interaction between the effects of time and catalyst concentrations for all catalysts. The best yield was found at lower oil-to-methanol ratios (nearly 0.02) and higher catalyst concentrations (at 10%). Reaction times close to 7 hours for catalyst 1 and close to 5 for the other catalysts were the optimum values for best yield and lowest acid value.
Introduction
Since the invasion of Ukraine, which started the current economic and energy cold war, the world has been searching for fresher ways to produce energy. The production of biodiesel from sustainable feedstock presents a promising option to the world's heavy reliance on fossil fuels and the issues associated with environmental pollution.
A variety of processes, including heating, pyrolysis, thermal cracking, and transesterification, can be used to create biodiesel, but transesterification is still one of the most popular and effective methods.
Based on Venkatesan and Sivamani (Citation2022), long-chain mono-alkyl esters are effectively converted into short-chain fatty acid methyl esters (FAMEs) through base-catalysed transesterification of methanol and acid-catalysed transesterification of sulphuric acid at high temperatures.
When used to make vegetable-based biodiesel, non-edible feedstocks like Karanja, linseed, cottonseed, mahua, and Pongamia find themselves in a stronger position. In the Indian subcontinent, grapeseed is another possible biodiesel source. In India, 79.6000 hectares of arable land are used to grow about 24.7 lac tons of grapes annually.
Demirbas (Citation2005) stated that according to estimates, grape seeds, which are 4% by weight on average, can serve as a potentially renewable fuel for biodiesel.
Despite having many benefits like Eco-friendliness, biodegradability, renewable nature, higher miscibility with petro-diesel, and relatively high flash and fire point, its use as vegetable-based biodiesel faces a significant level of commercial challenges because it requires more capital than fuel made from petroleum.
There are two methods to resolve this problem. One method involves converting used cooking oil into transportation fuel, which could significantly lower the sourcing cost; a second method entails streamlining the production of biodiesel with the aid of soft computing tools like the Krigin model, adaptive neuro-fuzzy interference system (ANFIS), artificial neural network (ANN), and response surface methodology (RSM), which can significantly lower the cost of processing and producing the fuel. The biodiesel production process can be optimised by using soft computing tools like ANN, ANFIS, and RSM systems to forecast the variable parameters of the transesterification procedure. As a result, the processing time and cost are significantly decreased.
Gunawan et al. (Citation2014) used a continuous transesterification method to produce biodiesel from Xylocarps Moluccas seed oil. They reported a reduction in saturated fatty acid content from 22% to 1.2% by 20 minutes of esterification, 2 ml/g of methanol to oil, 0.3% KOH, and 1% sulfuric acid, and further produced 97% of biodiesel. They reported that the derived biodiesel had improved cold flow properties.
In their 2010 study, Fernández et al. (Citation2010) extracted 18.4% of bio-oil from grapeseed using n-hexane solvent and a soxhlet device. Additionally, it was discovered that biodiesel produced through the in situ transesterification process had improved cold flow properties and excellent oxidative stability.
Only a few other studies (2014; Duz, Saydut, and Ozturk Citation2011; Gui, Lee, and Bhatia Citation2008 and Al-Sheikh and Yamin Citation2019) have reported on the solvent and soxhlet extraction methods used to extract oil. Thermal cracking, microemulsion, and microwave-assisted transesterification processes were used to produce the biodiesel, which produced better results.
RSM is a powerful and reliable computational tool in simulation, modelling, Design of Experiments (DoE), and optimisation studies. The main benefit of using RSM is its ability to reduce the necessary number of experimental trials for determining how input and output operating parameters interact. A small number of researchers have successfully developed linear regression statistics and established the empirical relationship to produce biodiesel based on vegetable oil.
To produce the moringa biodiesel determined by RSM, Rashid et al. (Citation2011) developed the central composite design (CCD) using variable parameters. 94.3% of Moringa oleifera Methyl Ester (MOME) was produced using the following conditions: 6.4:1 methanol to oil molar ratio, 55°C reaction temperature, 0.80% catalyst concentration, and 71.08 minutes of reaction time.
Ngige et al. (Citation2023) conducted an optimisation alkali transesterification of pawpaw seed extract to biodiesel using a NaOH catalyst. They used the Response Surface Methodology (RSM) and Multiple Linear Regression (MLR) algorithms to optimise the biodiesel yield. They reported a maximum yield of 80% at 60°C reaction temperature, 1.0 wt.% catalyst weight, and 3:1 methanol-to-oil ratio. They found that the interaction between the reaction temperature and catalyst concentration was the most significant factor.
Razzaq et al. (Citation2022) used the RSM and ANN methods to optimise the yield of biodiesel from a mixture of Palm oil and cotton seed oil. They reported a maximum yield of 96.41% at 35 minutes reaction time, and a Methanol-to-oil ratio of 47.5 v/v % and 1 wt. % catalyst concentration. Using ANN, they reported a maximum yield of 96.67% respectively under the same operating parameters.
Betiku et al. (Citation2021) compared the predictive power of RSM, ANN, Genetic Algorithm (GA), and adaptive neuro-fuzzy inference system (ANFIS) to assess the efficacy of computing models in the bio-oil extraction process. The extraction procedure included the introduction of a five-level, three-factorial CCD with the function of time. RSM also demonstrated the improved interaction between the input parameters and the responses. They also reported that reaction time and catalyst loading were the most significant parameters affecting yield.
Kumar et al. (Citation2023) used the RSM (Using Box Behnken design), ANN, and Support Vector Machine (SVM) to optimise the biodiesel yield using Karanja oil as feedstock. They reported that, for SVM, the root mean square error (RMSE) = 1.20, R2 = 0.91, and mean square error (MSE) = 1.45. Results using ANN were R2 = 0.86, RMSE = 1.55, MSE = 2.42, and those using RSM were R2 = 0.85, RMSE = 1.67, MSE = 2.78.
Dharmalingam et al. (Citation2023) in their study, compared the use of ANN and RSM techniques for biodiesel yield prediction and optimisation. They concluded that both methods are recommended for this purpose due to the high accuracy of the results.
Helmi, Helmi, and Hemmati (Citation2022) also conducted an RSM and kinetic study on the production and optimisation of biodiesel using Pomegranate seed oil. They used a new green solid catalyst called (HPA) for the process. They achieved a maximum biodiesel yield of 95% in 74 min using the catalyst weight of 1.25 wt% and methanol to oil molar ratio of 6:1 at the temperature of 65°C. They also reported reusability of 6 times for the new catalyst without losing its catalytic characteristics. Based on the ANOVA test, reaction time was reported to be the most significant in their study.
Tamoradi et al. (Citation2022) also used the Box–Behnken RSM technique to optimise biodiesel production from rapeseed and waste corn oils using a new and green catalyst. They reported that using this novel catalyst, biodiesel separation was easy and obtained at a shorter time with more cycles of catalyst reusability.
Another novel method to produce biodiesel from waste cooking oil was done by Bora et al. (Citation2022) using nanocatalysts. The best results of biodiesel yield were found to be 98.8% at 46 minutes, methanol to oil ratio-9.4:1, and catalyst loading-8.9 wt% using the RSM method.
Along the same line, Xia et al. (Citation2022) used a novel technique to produce biodiesel from waste cooking oil feedstock using a magnetic catalyst derived from waste shells. The process was then optimised using the RSM (Box Behnken method). They obtained 92.12% as the optimal Fatty acid methyl ester (FAME) content at 12:1 methanol to oil ratio (by mole), 0.25 wt% catalyst loading, and 29 V electrolytic voltage for 50 min at room temperature. The RSM analysis also revealed that the yield was more dependent on the electrolytic voltage than the other parameters.
Abu-Ghazala et al. (Citation2022) utilised the white powder from the waste bricks as a catalyst to produce biodiesel from waste cooking oil. They optimised their results using the RSM technique. They reported an optimum of 92.7% biodiesel yield at 64oC mixture temperature, 5.5:1 methanol-to-oil ratio, and 1.3% catalyst load using the RSM optimisation technique.
Muhammad et al. (Citation2022) used both RSM and ANN methods to optimise biodiesel production from wet microalgae biomass. The highest yield obtained in their study was 19.90% on a dry biomass weight basis under the optimum conditions of 240 min, 146°C, 2.83 (vol/wt), and 3.86 M acid concentration.
More recently, Aurtherson et al. (Citation2023) used the DOE technique to analyze and optimise the production of biodiesel from a new Prunus domestica kernel oil. The ANOVA study revealed that the best operating conditions were at 150 min reaction time, 60°C reaction temperature, 8:1 oil-to-methanol ratio, and 1 wt% NaOH which gave a yield of 97.86%. They reported that the methanol-to-oil ratio was the most significant parameter.
Kolakoti, Setiyo, and Rochman (Citation2022) also studied the production of biodiesel production using green heterogeneous catalysts with the help of ANN and RSM mathematical tools. They reported a maximum biodiesel yield of 92.82% at 8 wt.% catalyst usage, methanol to triglyceride (7:1), 50°C reaction temperature, and 120 min reaction time.
Özgür (Citation2022) conducted a research study on the optimisation of biodiesel production from pomegranate seed oil using Artificial Neural Networks (ANN) and Response Surface Methodology (RSM) with a central composite design. They found that the optimum yield was 95.68% at 8.01:1 methanol/oil molar ratio, 1.08 wt. % catalyst rate, 70℃ reaction temperature, and 45 min reaction time.
Gülüm, Yesilyurt, and Bilgin (Citation2020) used the Taguchi and the full factorial design approaches to optimise the reaction conditions for the transesterification of waste cooking oil (WCO). They reported the highest biodiesel yield to be 98.19% at sodium methoxide amount of 1.00 wt%, reaction time of 60 min, reaction temperature of 55°C, and methanol to oil molar ratio of 6:1. They also reported that the most significant factors affecting the yield and viscosity of the biodiesel were the catalyst amount and methanol to oil molar.
A summary of the literature related to the use of mathematical modelling and optimization of biodiesel yield is shown in below.
Table 1. Summary of literature review.
The main aim of the present study is to comprehend the transesterification process and its optimisation methodology using RSM for three different catalysts under various operating conditions. Using the DOE technique helps achieve several goals: first; it helps build a mathematical model between the various parameters and the output, second; it helps study the interaction between the input parameters and between the inputs and output to find how they interact, and finally it helps optimise the input parameters for best output (increased biodiesel yield).
Materials and methods
Material source
Olive cake was obtained from Al-Husban Typical Squeezer in Madaba in central Jordan. The Gulf Coast Company (GCC) supplied sodium hydroxide (99% NaOH), which was used to extract lignin. Sulfuric acid (H2SO4, 95-97%) was bought from the Merck Company. For the creation of the catalyst, phosphoric acid (H3PO4) analytical grade (90%) was purchased from M&B Laboratory Reagent Company. Sulfuric acid (H2SO4) of analytical grade (98%) was supplied by Scharlau Company. The details of the process of making the three types of catalysts can be found in Sandouqa, Al-Hamamre, and Asfar (Citation2019).
Experimental design and RSM model development
The main independent variables that affect biodiesel yield are the molar ratio (x1), catalyst concentration (x2), and reaction time (x3). The biodiesel yield is significantly impacted by the variables, so it is essential to find the best combination of catalyst concentration, methanol-to-oil molar ratio, and reaction time to minimise time and energy loss. To increase and optimise the process operational variables and achieve the highest yield of grapeseed bio-diesel, the RSM approach was used. The central composite rotatable design (CCRD) of a three-factor, five-level design was used to carry out the experimental trials, and the input variables were coded into five levels namely 2, 1, 0, 1, and +2 as shown in .
Table 2. Independent variables and coded levels.
Equation (1) is a mathematical equation for a second-order polynomial that was used to fit the experimental data from the CCRD.
(1)
(1) where k is the number of variables,
is the constant term,
represents the coefficients of the linear parameters, xi represents the variables, ϵ is the residual associated with the experiments, and
represents the coefficients of the quadratic relationship. To estimate the parameters in Equation (1), the experimental design is to ensure that all studied variables are carried out at least three-factor levels.
Response surface analysis was performed by fixing one variable while varying the other two to investigate how they vary or interact. ANOVA (analysis of variance) was used to determine the significance of the variables and their interaction with the response.
Results and discussion
Prediction models used and their accuracy
As stated above in equation (1), the model used for prediction and analysis was the quadratic model. The general form used was:
(2)
(2) Where
represents the coefficient of the parameter e.g.
represents the coefficient of the parameter
in the equation. The parameters
represent the inputs to the model i.e. reaction time, catalyst concentration, and oil/methanol ratio respectively.
represents the coefficient for the interaction term between A and B.
A sample of the equations obtained for the biodiesel esterification using catalyst 1 is shown below:
(3)
(3) The accuracy of the equation is given by the following and :
Table 3. Model accuracy details.
Table 4. Response 1: Catalyst 1 esterification conversion.
There is less than a 0.2% difference between the R² (Adj) of 0.9844 and the R² (Pred) of 0.9754, indicating a fair agreement.
The signal-to-noise ratio is measured with adequate precision. Adequate precision examines the average prediction error with the range of the expected values at the design points. The ratio ought to be more than 4. With this model, a suitable signal-to-noise ratio of 62.730 is produced. This suggests that additional analysis can be done with this model.
The F-value of 246.17 for the model suggests that it is significant. This kind of huge F-value has a 0.01% probability of being caused by noise. Model terms are considered significant when P-values are less than 0.0500. A, B, C, AB, AC, BC, A², B², and C² are important model terms in this instance. The model terms are not important if the value is bigger than 0.1000. The following and summarise the coefficients for the equations of the study parameters.
Table 5. Model coefficients for different catalysts.
Table 6. Coefficients for the acid value using different catalysts.
The figures for the model verification using the reaction time of 8 hours are shown below. First, the esterification conversion is shown in .
Figure 1. Model verification for the esterification conversion. The legends are as follows: 
 for catalyst 2, and * for catalyst 3.
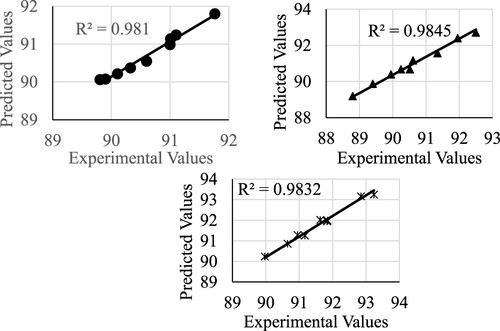
The accuracy of the tested models is shown in below.
Table 7. Model accuracy details.
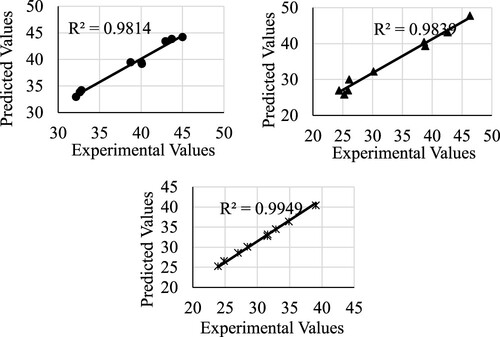
And that for the transesterification conversion is shown in below.
Figure 2. Model verification for the transesterification conversion.
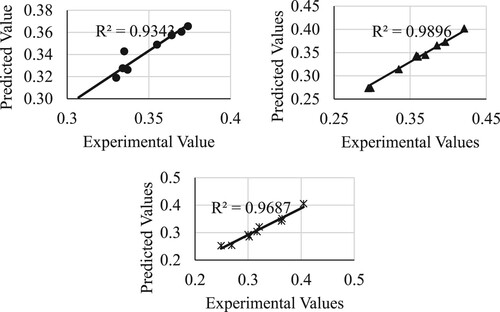
Finally, that for the acid values are shown in below.
Figure 3. Model verification for the acid value.
Uncertainty analysis
Before proceeding with the analysis using the above equations obtained from the experimental data, uncertainty analysis on the obtained models must be carried out.
Uncertainty comes from various sources (Uusitalo et al. Citation2015) e.g. measurement error, inherent randomness Systematic error in the measurement results, and model uncertainty. Models are always abstractions of the natural system. Some less important variables and interactions are left out, and the shapes of the functions are always abstractions of the real processes. This causes the existence of uncertainty in the models.
There are various methods suggested for the measurement of uncertainty in models. The probable range of values of the model output can also be examined by analysing how the output value would behave if some other, fixed variable values were changed within their reasonable range or assigned a probability distribution. The most comprehensive option is to conduct an uncertainty analysis (UA) on the model output. UA is a method that is used to quantify the uncertainty in model outputs induced by uncertainty in inputs (O'Hagan et al. Citation2006). The simplest way to conduct a UA is to apply Monte Carlo (MC) methods in which configurations of model inputs are drawn randomly from their distribution and the resulting set of model outputs can be seen as a random sample of the distribution of the output of interest (Kennedy and O'Hagan Citation2001). This, however, requires usually a large number of model runs.
In this work, the instrument error does not exceed ±3%, hence, the uncertainty propagation described by Holman (Jehad Yamin et al. Citation2013).
Let the variable x1,x2,x3, … Provide the result ‘R’ through a functional relationship, R = f(x1,x2,x3 …)
Then, by differential calculus, small changes or errors in the measured variable are related to changes or errors in R as:
(4)
(4) The errors dX1, dX2, dX3 … are random, having even changes of positive and negative value. Then by squaring each side, we can cancel off the sum of product terms. Thus;
OR
(5)
(5) Where
,
,
… are the uncertain or errors in the independent variable, and
is the uncertainty propagation in the result. Thus, from a knowledge of errors in the measured variables, the probable error in the result ‘
’ can be worked out.
This was done using Engineering Equation Solver (EES) software. Since the number of experimental data is big, the authors chose to conduct the uncertainty analysis on the model validation data i.e. at Time = 8 hours, Catalyst Loading = 7.5%, and Oil/Methanol Ratio = 0.0222.
The results obtained are shown in below. The experimental values are written below each one in brackets.
Table 8. Sample model uncertainty.
Another method of testing the model’s robustness is to vary the input variables by this range and compare the output with the experimental values. This was done at the same values as the previous method by changing each variable 10,000 times within the error range of ±3% the average output was found, and the standard deviation was also calculated.
The results are shown below in . The values are written in the form of
(6)
(6) The experimental values are written below each one in brackets.
Table 9. Sample model uncertainty.
Interaction effect of molar ratio and catalyst concentration on biodiesel yield
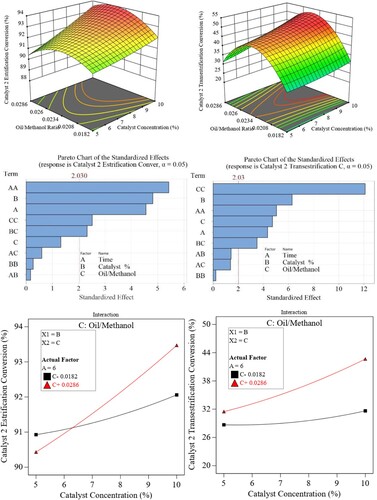
show the effect of catalyst concentration and oil-to-methanol molar ratio on the transesterification and esterification conversion percentages. The surface plot revealed that, for the first catalyst, transesterification conversion increases as catalyst concentration rises from 5 wt.% to 10 wt.% and molar ratio 1:55–1:35 respectively.
Figure 4. Results for catalyst-1.
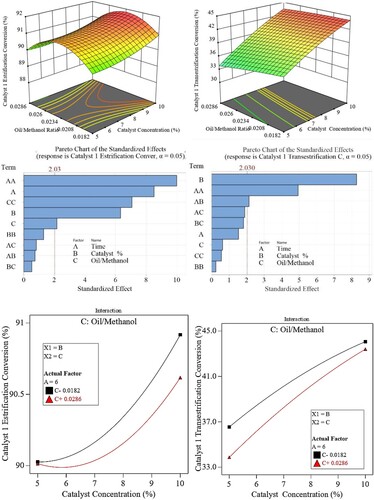
At a catalyst loading of 10 wt.% and a molar ratio of 1:35, the highest yield of 45% was attained. As for the esterification part, the conversion percentage varies with the oil-to-methanol ratio such that it reaches its peak at a ratio of 1:45 with a maximum conversion of around 92% at 10 wt.% catalyst. Any attempt to move from this 1:45 ratio causes the conversion % to drop.
It also reveals that the effect of the catalyst is more pronounced in the transesterification than in the esterification conversion. For an increase in catalyst concentration from 5 to 10%, there is around a 34% increase in the transesterification process compared with a 2.3% increase in the esterification one. This is also clear from the Pareto chart which shows that the effect of catalyst concentration (factor B) is higher for the transesterification than the esterification stage.
As for the effect of the oil-to-methanol ratio, there exists a certain ratio that produces the highest ester percentage which is around 1:45 beyond which there is a reduction in the ester produced. This is clear for all values of catalyst concentration. Hence, it is concluded that for catalyst-1, within the range of parameters studied, there is slight interaction (i.e. they are independent of one another) between those two factors in the esterification process at low catalyst concentrations. In contrast, at higher concentrations, the oil-to-methanol ratio must be reduced to improve conversion. As for the transesterification part, the interaction is marginal.
The results for the second catalyst are shown in . The highest conversion for both cases was achieved at moderate methanol-to-oil ratios of 1:45 and catalyst concentration of 9-10%. At these points, esterification and transesterification conversion reached 94% and slightly above 50% respectively.
Figure 5. Results for catalyst-2.
The figure shows that there is a marginal change in the output for both esterification and transesterification processes at lower oil-to-methanol ratios. This trend changes and the change in output becomes significant as the ratio increases. However, there is a point of maximum yield at around 1:45 ratio where the % yield is maximum.
Hence, it is concluded that there is reasonable interaction (compared with catalyst-1) between the two factors, leading to better conversion output than catalyst-1. This also can be seen from the Pareto chart where the BC interaction term is better than that for catalyst-1.
For the esterification part, at lower catalyst concentrations, lower oil-to-methanol ratios (i.e. large methanol amount) are favourable for higher conversion %. At higher catalyst concentrations, higher ratios are needed (i.e. less methanol amount) to achieve higher conversion %. Referring to the transesterification conversion, there is no clear interaction between the two factors within the range studied, however, for both ends of catalyst concentration limits, higher ratios are needed to achieve better conversion %. Gülüm, Yesilyurt, and Bilgin (Citation2020) reported that the most significant factors affecting the yield and viscosity of the biodiesel were the catalyst amount and methanol to oil molar.
Referring to the third catalyst (shown in ), the best esterification conversion % was achieved at a ratio of 1:45 and catalyst concentration of 9-10%. While for the transesterification part, it was achieved at a 1:35 ratio and 9-10% catalyst concentration.
Figure 6. Results for catalyst-3.
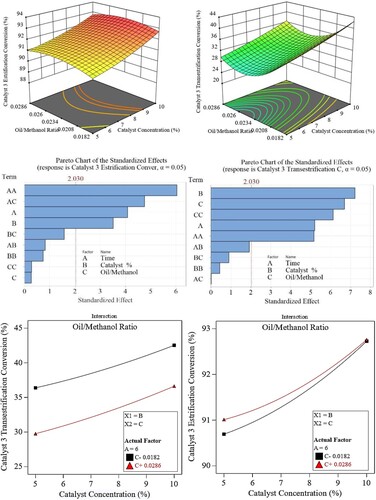
The plots also reveal that there is no dependency (interaction) of the two factors on one another and that both factors are almost equally important in the transesterification conversion while the oil-to-methanol ratio is the key factor for the esterification conversion with negligible effect for the ratio. This is also clear from the Pareto charts.
For the esterification conversion reaction, the dependency on the oil-to-methanol ratio becomes less effective at higher catalyst concentrations. Because water concentration may reduce biodiesel production, a greater methanol-to-oil ratio is typically required to get the highest biodiesel yield.
The generation of biodiesel is reduced if the catalyst loading exceeds 10 weight percent and the molar ratio rises above 1:35. This is because the higher catalyst concentration causes significant mass transfer, which thickens the mixture and reduces yield.
Moreover, soap production is a result of increased catalyst loading. Furthermore, as noted by Srilatha et al. (Citation2012), excess use of methanol deactivates the catalyst, reversing the transesterification step.
Another reason for the differences in the performance of the three catalysts is shown in the Pareto charts as shown in . A Pareto chart is a bar chart that shows the effect or significance of the input parameters on the output.
The higher the length of the bar the higher or more significant the parameter is. It also shows the minimum value below which the parameter is considered insignificant.
Based on the experimental data, for catalyst-1, the catalyst concentration is the most significant in the transesterification and esterification process with a slight interaction between the catalyst concentration and time. It can be seen from , that the catalyst concentration has a linear type effect (B) with increasing nature (yield increases with an increase in catalyst concentration) while the oil-to-methanol ratio has the least (compared with that for catalyst).
However, from an esterification point of view, the oil-to-methanol ratio has a quadratic effect (CC) which means that it has an optimum value (maximum effect on yield) beyond which the effect decreases.
As for catalyst-2, catalyst concentration has a linear effect (B) over the transesterification yield with the molar ratio showing the highest effect of quadratic nature (CC) on the biodiesel yield.
Regarding esterification yield, the chart shows a strong linear effect of catalyst concentration (B) compared with the quadratic effect (CC) of the oil-to-methanol ratio.
The third catalyst showed greater dependence on both factors with a slight extra effect of that of the quadratic effect of the oil-to-methanol ratio. However, it is noticed that this effect is decreasing in nature. As for the esterification yield, the main factor affecting the process is the catalyst concentration with the oil-to-methanol ratio being insignificant. This is why shows a stronger effect at higher catalyst concentrations.
The influence of reaction time and catalyst concentration on biodiesel yield
show the surface plot of time and catalyst concentration on biodiesel yield.
Figure 7. Interaction between catalyst concentration and time.

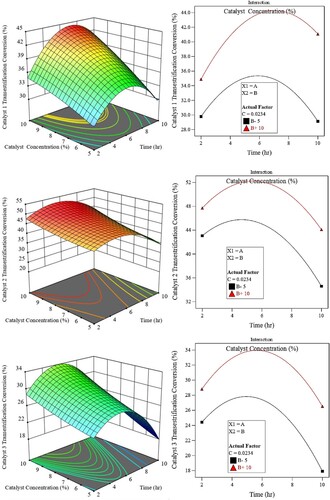
Based on the surface plots, for all catalysts, the percentage conversion for both esterification and transesterification conversion increases with the reaction time from 120 min to around 300-360 min where it reaches its maximum values. Any further increase in the reaction time beyond this value will cause the conversion % to decrease.
The increment in the esterification reaction is more clear for catalyst-3 while the transesterification reaction is for catalyst-1.
This could be because the mixture's high viscus makes it challenging to separate the biodiesel. Up to a 10% increase in catalyst loading enhanced the amount of biodiesel harvested; however, an increase in catalyst concentration did not result in a higher biodiesel yield. A higher concentration of catalyst in the transesterification reaction leads to the production of soap, which reduces yield. Based on the results of the experiment, the highest amount of biodiesel that could be produced with catalyst 1 was approximately 42.5% at a reaction time of 6–7 hours and a catalyst loading of 9–10 weight percent.
As for catalyst 2, the highest percentage of yield was ∼50% at around 5 hours, and the catalyst concentration of 9-10%. Finally, for catalyst 3, the highest yield achieved was nearly 32% at around 5 hours of reaction time. The low amount of biodiesel produced with a decreased reaction duration and catalyst loading could be attributed to an inadequate mixture and reaction rate. Furthermore, because of the saponification reaction, the biodiesel yield falls with longer reaction times and higher catalyst loading.
Once more, regarding the Pareto charts of , the effect of the time for catalyst-1 on the transesterification yield is significant and is quadratic (AA) while that for the catalyst is already explained earlier. Further, the figure shows a weak interaction between both factors. Concerning the esterification yield, reaction time is the dominant factor with comparable linear (A) and quadratic nature (AA), hence, it has an optimum effect at higher time intervals. There is no A-B interaction on yield.
As for catalyst-2, the effect of time on transesterification yield is of moderate linear (A) and quadratic (BB) significance. This shows that the effect will reach optimum (in this case peak value) at lower time intervals. On the other hand, time has a stronger quadratic (AA) and lesser degree linear (A) effect, hence having a peak value at the upper end of the time intervals. Here also, there is no interaction (AB) between both factors.
Looking at the effect of time for the third catalyst, it can be noticed that the reaction time has a stronger quadratic (AA) and linear (A) effect on the esterification yield compared with that for the transesterification yield. This explains the peak value of yield at higher values of time compared with that for the transesterification yield.
The influence of reaction time and molar ratio on biodiesel yield
shows the surface plot of time and molar ratio on biodiesel yield. Based on the plots, for catalyst 1, the biodiesel yield reaches its peak value of around 40% at a reaction time of 6 hours and the least methanol-to-oil ratio of 1:55.
Figure 8. Interaction between molar ratio and time.

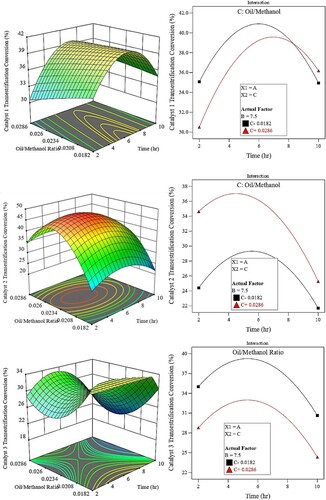
The second catalyst shows a peak value of about 45% at around 5 hours of reaction time and a 1:45 molar ratio. The third catalyst reaches its climax value of biodiesel of around 35% at a reaction time of 5 hours and lowest molar ratio of 1:55.
Only when the rate of backward response is decreased can a higher equilibrium conversion be attained. Excessive use of methanol drives the process of producing methyl esters. The esterification rate (∼92%) stays constant when catalyst-1 is used, even though the oil/methanol ratio increased from 1:35–1:55 and the transesterification conversion dropped from 57% to 42%.
This is because the SO3H group bound to the carbon sheet of biochar enhanced the hydrophilic property of the generated lignin acid catalyst. However, the esterification process is sped up and more water is produced by increasing the surplus methanol. The acidic hydroxyl OH group is reduced when an excessive amount of water poisons acidic catalysts because the group becomes hydrated.
Another explanation could be that the large levels of extra methanol could swamp the active sites, preventing WVO from adhering to them. Consequently, the transesterification conversion was impeded by the higher methanol molar ratio.
From the interaction point of view, for the esterification conversion, the interaction plots reveal that, for the first catalyst, there is a marginal interaction between the factors on the conversion % at a lower reaction time. However, at higher reaction times, lower ratios are needed for better conversion %.
As for catalyst-2, the exact opposite behaviour compared with catalyst-2 is shown. At lower reaction times, lower oil-to-methanol ratios are needed for better conversion % while at higher times the effect of the ratio is marginal.
As for the third catalyst, there exists a clear and strong interaction between both factors. At lower to medium reaction times the higher the oil-to-methanol ratio the better the conversion %. At higher reaction times, lower ratios are required. As for the transesterification reaction, there seems to be marginal-to-no interaction for catalyst-2 and catalyst-3. Catalyst-1 shows a clear interaction between the factors studied. At lower-to-medium reaction times, lower ratios are needed for better conversion % while beyond 8 hours, higher ratios are needed.
The influence of parameters on the acid value of biodiesel yield
show the effect of the studied parameters on the acid value of the yield for both transesterification and esterification processes. These figures show that for catalyst 1, the highest acid value lies on the lower and higher ends of the time (0.4 and 0.34 respectively) with the least value at 6–8 hours and the highest catalyst concentration. The same trend for the effect of time with the oil-to-methanol ratio being highest at both limits of the ratio. The lowest value lies within 6–8 hours of reaction time and slightly lower than 0.024 oil-to-methanol ratio (acid value less than 0.32). Catalyst 2 shows a nearly similar trend but with lesser acid values and being minimum at a reaction time of 4–6 hours and oil-to-methanol ratio at the upper limit of 0.024 (acid value less than 0.3). This value further reduces at higher catalyst concentrations to reach values around 0.25.
Figure 9. Variation of acid value with other parameters.
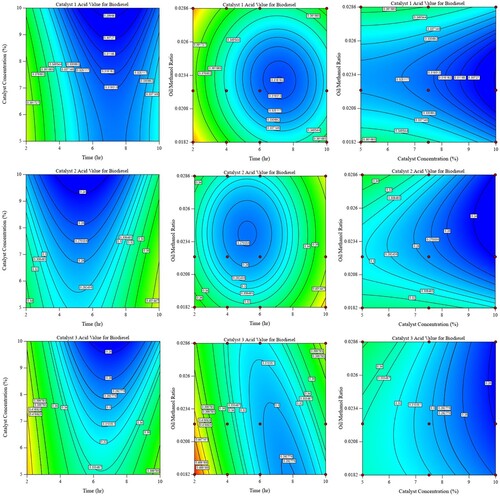
Catalyst-3 shows minimum values of about 0.3 at a time range of 6–8 hours and the lowest oil-to-methanol ratio of 0.0182 and at catalyst concentrations higher than 8%.
Optimisation response
The optimum input parameters were determined using the RSM optimiser, and the resulting most desirable output is displayed in . The multi-objective optimisation process was executed with varying output factor weights.
Table 10. Optimisation results for the three types of catalysts.
The goal of this effort is to increase the yield of biodiesel production and reduce its acid value by utilising three distinct kinds of catalysts. The optimum parameters for catalyst-1 are found to be ∼7.1 hours reaction time, 10% catalyst, and ∼0.026 oil-to-methanol ratio. At these conditions, the maximum conversion is expected to be 91.66% and ∼45% for esterification and transesterification conversion respectively, while the lowest acid value is expected to be 0.306.
As for catalyst-2, the values are ∼5.0 hours, with a 10% catalyst and 0.026 oil-to-methanol ratio. At these conditions, the maximum conversion is expected to be ∼94% and 50.4% for esterification and transesterification conversion respectively, while the lowest acid value is expected to be 0.026.
The last tested catalyst-3, showed optimum esterification and transesterification values of ∼93% and ∼40.0% with an acid value of 0.265 at 7.34 h’ reaction time, with a 10% catalyst and 0.0182 oil-to-methanol ratio.
Conclusion
The effect of three different parameters (namely reaction time, catalyst concentration, and oil-to-methanol ratio) on the transesterification, and esterification yields an acid value of waste cooking oil biodiesel was studied experimentally and using RSM.
Analysis showed that the effect of time on transesterification was significant for catalysts 2 and 3 and least significant for catalyst-1. While, for esterification yield, it was significant to a second degree for all catalysts.
The effect of catalyst concentration was significant to the first power for all the cases studied.
The oil-to-methanol ratio was found significant for the transesterification yield of catalysts 2 and 3 and least for the rest of the cases.
Lower oil-to-methanol ratios (nearly 0.02) and higher catalyst concentrations (at 10%) were found to be the optimum values for the best yield. The optimum value was a reaction time of nearly 7 hours for catalyst 1 and nearly 5 for the rest of the catalysts.
Results showed a strong interaction between reaction time and oil-to-methanol ratio for all catalysts.
No evidence of interaction between the effects of time and catalyst concentrations for all catalysts
Scope for future work
Based on the results, the effect of reaction temperature and stirring speed are suggested to be studied in the future. Further, the study of the biodiesel properties and its use in combustion applications is also recommended.
Acknowledgment
Part of this work was accomplished during the sabbatical leave of Prof. Zayed Al-hamamre, which was granted to him by the University of Jordan during the academic year 2023/2024 and it was undertaken at the German Jordan University.
Disclosure statement
No potential conflict of interest was reported by the author(s).
References
- Abu-Ghazala, A. H., H. H. Abdelhady, A. A. Mazhar, and M. S. El-Deab. 2022. “Valorization of Hazard Waste: Efficient Utilization of White Brick Waste Powder in the Catalytic Production of Biodiesel from Waste Cooking oil via RSM Optimization Process.” Renewable Energy 200:1120–1133. https://doi.org/10.1016/j.renene.2022.10.045.
- Al-Sheikh, I., and J. A. Yamin. 2019. “Modeling and Optimization of Jojoba oil Extraction Yield Using Response Surface Methodology.” Journal of Pharmacy & Pharmacognosy Research 7 (5): 367–380. https://doi.org/10.56499/jppres19.538_7.5.367.
- Aurtherson, P. B., B. T. Nalla, K. Srinivasan, K. Mehar, and Y. Devarajan. 2023. “Biofuel Production from Novel Prunus Domestica Kernel oil: Process Optimization Technique.” Biomass Conversion and Biorefinery 13 (7): 6249–6255. https://doi.org/10.1007/s13399-021-01551-5.
- Betiku, E., A. S. Osunleke, V. O. Odude, A. Bamimore, B. Oladipo, A. A. Okeleye, and N. B. Ishola. 2021. “Performance Evaluation of Adaptive Neuro-Fuzzy Inference System, Artificial Neural Network and Response Surface Methodology in Modeling Biodiesel Synthesis from Palm Kernel oil by Transesterification.” Biofuels 12 (3): 339–354. https://doi.org/10.1080/17597269.2018.1472980.
- Bora, A. P., L. D. Konda, S. Pasupuleti, and K. S. Durbha. 2022. “Synthesis of MgO/MgSO4 Nanocatalyst by Thiourea–Nitrate Solution Combustion for Biodiesel Production from Waste Cooking oil.” Renewable Energy 190:474–486. https://doi.org/10.1016/j.renene.2022.03.127.
- Demirbas, A. 2005. “Biodiesel Production from Vegetable Oils via Catalytic and Non-Catalytic Supercritical Methanol Transesterification Methods.” Progress in Energy and Combustion Science 31 (5-6): 466–487. https://doi.org/10.1016/j.pecs.2005.09.001.
- Dharmalingam, B., S. Balamurugan, U. Wetwatana, V. Tongnan, C. Sekhar, B. Paramasivam, K. Cheenkachorn, A. Tawai, and M. Sriariyanun. 2023. “Comparison of Neural Network and Response Surface Methodology Techniques on Optimization of Biodiesel Production from Mixed Waste Cooking oil Using Heterogeneous Biocatalyst.” Fuel 340:127503. https://doi.org/10.1016/j.fuel.2023.127503.
- Duz, M. Z., A. Saydut, and G. Ozturk. 2011. “Alkali Catalyzed Transesterification of Safflower Seed oil Assisted by Microwave Irradiation.” Fuel Processing Technology 92 (3): 308–313. https://doi.org/10.1016/j.fuproc.2010.09.020.
- Fernández, C. M., J. R. María, P. Ángel. 2010. “Production of biodiesel from winery waste: extraction, refining and transesterification of grape seed oil.” Bioresource Technology 101 (18): 7019–7024. https://doi.org/10.1016/j.biortech.2010.04.014.
- Gui, M. M., K. T. Lee, and S. Bhatia. 2008. “Feasibility of Edible oil vs. non-Edible oil vs. Waste Edible oil as Biodiesel Feedstock.” Energy 33 (11): 1646–1653. https://doi.org/10.1016/j.energy.2008.06.002.
- Gülüm, M., M. K. Yesilyurt, and A. Bilgin. 2020. “The Modeling and Analysis of Transesterification Reaction Conditions in the Selection of Optimal Biodiesel Yield and Viscosity.” Environmental Science and Pollution Research 27:10351–10366. https://doi.org/10.1007/s11356-019-07473-0.
- Gunawan, S., H. W. Wasista, K. Kuswandi, A. Widjaja, and Y. H. Ju. 2014. “The Utilization of Xylocarpus Moluccensis Seed oil as Biodiesel Feedstock in Indonesia.” Industrial Crops and Products 52:286–291. https://doi.org/10.1016/j.indcrop.2013.10.039.
- Helmi, F., M. Helmi, and A. Hemmati. 2022. “Phosphomolybdic Acid/Chitosan as Acid Solid Catalyst Using for Biodiesel Production from Pomegranate Seed oil via Microwave Heating System: Rsm Optimization and Kinetic Study.” Renewable Energy 189:881–898. https://doi.org/10.1016/j.renene.2022.02.123.
- Kennedy, M. C., and A. O'Hagan. 2001. “Bayesian Calibration of Computer Models.” Journal of the Royal Statistical Society Series B: Statistical Methodology 63 (3): 425–464. https://doi.org/10.1111/1467-9868.00294.
- Kolakoti, A., M. Setiyo, and M. L. Rochman. 2022. “A Green Heterogeneous Catalyst Production and Characterization for Biodiesel Production Using RSM and ANN Approach.” International Journal of Renewable Energy Development 11 (3): 703–712. https://doi.org/10.14710/ijred.2022.43627.
- Kumar, S., V. Fore, J. Singh, A. Nainwal, and G. K. Malik. 2023, February. “Comparative Study Using RSM ANN and SVM Modelling for Biodiesel Production from Karanja oil by Developed Microwave set up.” In 2023 1st International Conference on Intelligent Computing and Research Trends (ICRT) (pp. 1–16). IEEE. https://doi.org/10.1109/ICRT57042.2023.10146623.
- Muhammad, G., A. D. P. Ngatcha, Y. Lv, W. Xiong, Y. A. El-Badry, E. Asmatulu, J. Xu, and M. A. Alam. 2022. “Enhanced Biodiesel Production from wet Microalgae Biomass Optimized via Response Surface Methodology and Artificial Neural Network.” Renewable Energy 184:753–764. https://doi.org/10.1016/j.renene.2021.11.091.
- Ngige, G. A., P. E. Ovuoraye, C. A. Igwegbe, E. Fetahi, J. A. Okeke, A. D. Yakubu, and P. C. Onyechi. 2023. “RSM Optimization and Yield Prediction for Biodiesel Produced from Alkali-Catalytic Transesterification of Pawpaw Seed Extract: Thermodynamics, Kinetics, and Multiple Linear Regression Analysis.” Digital Chemical Engineering 6:100066. https://doi.org/10.1016/j.dche.2022.100066.
- O'Hagan, A., C. E. Buck, A. Daneshkhah, J. R. Eiser, P. H. Garthwaite, D. J. Jenkinson, J. E. Oakley, and T. Rakow. 2006. Uncertain Judgements: Eliciting Experts’ Probabilities.
- Özgür, C. 2022. “Prediction and Optimization of Biodiesel Production by Using ANN and RSM.” International Journal of Automotive Engineering and Technologies 11 (2): 53–62. https://doi.org/10.18245/ijaet.1057170.
- Rashid, U., F. Anwar, M. Ashraf, M. Saleem, and S. Yusup. 2011. “Application of Response Surface Methodology for Optimizing Transesterification of Moringa Oleifera oil: Biodiesel Production.” Energy Conversion and Management 52 (8-9): 3034–3042. https://doi.org/10.1016/j.enconman.2011.04.018.
- Razzaq, L., M. M. Abbas, S. Miran, S. Asghar, S. Nawaz, M. E. M. Soudagar, N. Shaukat, et al. 2022. “Response Surface Methodology and Artificial Neural Networks-Based Yield Optimization of Biodiesel Sourced from Mixture of Palm and Cotton Seed oil.” Sustainability 14 (10): 6130. https://doi.org/10.3390/su14106130.
- Sandouqa, A., Z. Al-Hamamre, and J. Asfar. 2019. “Preparation and Performance Investigation of a Lignin-Based Solid Acid Catalyst Manufactured from Olive Cake for Biodiesel Production.” Renewable Energy 132:667–682. https://doi.org/10.1016/j.renene.2018.08.029.
- Srilatha, K., R. Sree, B. P. Devi, P. S. Prasad, R. B. N. Prasad, and N. Lingaiah. 2012. “Preparation of Biodiesel from Rice Bran Fatty Acids Catalyzed by Heterogeneous Cesium-Exchanged 12-Tungstophosphoric Acids.” Bioresource Technology 116:53–57. https://doi.org/10.1016/j.biortech.2012.04.047.
- Tamoradi, T., A. R. Kiasat, H. Veisi, V. Nobakht, and B. Karmakar. 2022. “RSM Process Optimization of Biodiesel Production from Rapeseed oil and Waste Corn oil in the Presence of Green and Novel Catalyst.” Scientific Reports 12 (1): 19652. https://doi.org/10.1038/s41598-022-20538-4.
- Uusitalo, L., A. Lehikoinen, I. Helle, and K. Myrberg. 2015. “An Overview of Methods to Evaluate Uncertainty of Deterministic Models in Decision Support.” Environmental Modelling & Software 63:24–31. https://doi.org/10.1016/j.envsoft.2014.09.017.
- Venkatesan, H., and S. Sivamani. 2022. “Evaluating the Predicting Capability of Response Surface Methodology on Biodiesel Production from Grape Seed bio-oil.” Energy Sources, Part A: Recovery, Utilization, and Environmental Effects 44 (1): 2473–2488. https://doi.org/10.1080/15567036.2019.1649759.
- Xia, S., Y. Hu, C. Chen, J. Tao, B. Yan, W. Li, G. Zhu, Z. Cheng, and G. Chen. 2022. “Electrolytic Transesterification of Waste Cooking oil Using Magnetic Co/Fe–Ca Based Catalyst Derived from Waste Shells: A Promising Approach Towards Sustainable Biodiesel Production.” Renewable Energy 200:1286–1299. https://doi.org/10.1016/j.renene.2022.10.071.
- Yamin, J. A., N. Sakhnini, A. Sakhrieh, and M. A. Hamdan. 2013. “Environmental and Performance Study of a 4-Stroke CI Engine Powered with Waste oil Biodiesel.” Sustainable Cities and Society 9:32–38. https://doi.org/10.1016/j.scs.2013.02.002.