
ABSTRACT
A long-term regional solar energy assessment improves decision-making processes for the selection of the best solar energy technology and helps understand how to define focused policies and investments. This study presents long-term solar resource monthly maps for Qatar. The availability of solar radiation throughout the country has been mapped here using ground-based measurements and satellite data. The regression-kriging algorithm and its variants are used to calibrate satellite data, through interpolation of ground solar radiation data. Digital surface model data is used as an auxiliary variable to further scale down to 30 m resolution. Long-term monthly maps of daily total solar radiation have been produced which consist of 12 monthly maps for global horizontal irradiance (GHI) and 12 monthly maps for direct normal irradiance (DNI) for each month of the year. A significant improvement of 9.15% and 9.32% in GHI and DNI estimation has been observed after calibration, which brings down the Normalized Root Mean Square Error (NRMSE) to 4% and 11.70% for GHI and DNI respectively as compared to the non-calibrated satellite data estimation.
Introduction
The future of solar energy in Qatar is growing gradually. Hence, high-quality spatial solar radiation long-term data is required for the planning, deployment, and operation of solar power plants. The Qatar solar radiation measurement network consists of 13 solar radiation monitoring stations (SRMS) providing a comprehensive coverage of Qatar’s landmass. These stations have been in operation since October 2019 and measure the global horizontal irradiance (GHI), direct normal irradiance (DNI) and diffuse horizontal irradiance (DHI) components of solar radiation with high temporal resolution (1-min).
Generally, three types of long-term solar radiation data are available: climate model simulations, satellite-based data, and ground observations. Global and regional climate models are used to generate solar radiation forecasted data at global and regional levels (Jain, Singh, and Tripathi Citation2021) and further data reanalysis is carried out to provide historical long-term solar radiation data (Hersbach et al. Citation2020; Kobayashi et al. Citation2015). Satellite solar radiation data are developed by physical and statistical models (Sengupta et al. Citation2018), while ground data are collected by solar radiation measuring equipment. The most widely used set of data to characterise the local solar climate is known as Typical Meteorological Year data (TMY). Different meteorological measurements are taken at hourly intervals over several years to create a representation of the local climate in order to determine TMY data (ISO 15927-Citation4 Citation2005). Ground data, which are collected by solar radiation measuring equipment installed at SRMS, are usually of high quality if operated and maintained properly. However, the uncertainty of signals from solar ground stations grows as we move away from the SRMS and installing and maintaining more ground stations is costly. On the other hand, satellite solar radiation data and climate model simulations are long-term and continuously available throughout any geographical location, however with relatively less accuracy and lower temporal resolution in comparison with ground data.
The research significance of solar radiation data and mapping has been discussed briefly in (Gürel et al. Citation2023). Solar resource maps and data have practical implications in providing the best suitable site for deployment of solar power technology based on the analysis carried out in any Geographical information system (GIS) tool including other factors such as land rate and availability of nearest grid line, etc. An approximation of future solar radiation can be assumed based on these long-term data which help in estimating the future power generation too. GIS-based solar radiation mapping has made significant progress over the last two decades (Choi, Suh, and Kim Citation2019). Several authors demonstrate the use of GIS-based models such as solar analyst (Fu and Rich Citation2000) and r.sun (Hofierka and Suri Citation2002) for solar radiation mapping. In (Ruiz-Arias et al. Citation2009), the author has done a comparative analysis of digital elevation model (DEM)-based GIS models to estimate solar radiation. Spatial interpolation methods have been used to perform regional solar radiation mapping such as in (Alsamamra et al. Citation2009) and (Yu et al. Citation2023). However, these methods lack proper utilisation of already existing satellite solar radiation databases and require additional metrological parameters which are often either not available or difficult to obtain.
Several studies demonstrate the importance of ground data interpolation methods compared to satellite data within the vicinity of 25-30 km of ground measuring stations (Bachour and Perez-Astudillo Citation2014; Perez, Seals, and Zelenka Citation1997; Zelenka et al. Citation1999). Satellite-based modelling has become an increasingly important method for generating solar radiation data in the past several decades (Albarelo et al. Citation2015; Chen et al. Citation2022; Janjai et al. Citation2005; Rigollier, Lefèvre, and Wald Citation2004; “Solar Irradiance Time Series Data | SolcastTM” Citation2023) . In recent years, there have also been several research publications that use advanced machine learning methods to predict solar radiation (Alwadei et al. Citation2022; Jiang Citation2008; Rocha and Santos Citation2022; Yuan, Leirvik, and Wild Citation2021). However, at the regional level and on relatively flat terrain, interpolation by merging satellite and ground data may produce more reliable and accurate results (Journée and Bertrand Citation2010; Leirvik and Yuan Citation2021; Zhao et al. Citation2022). This approach seems to be quite suitable for Qatar due to the availability of a few years of ground measurement and the spatial distribution of the network of ground stations, along with the topography of the terrain.
In general, the most important attribute of solar resource data is that it should cover a long period of time. Satellite-based data offers better spatial and historical coverage, however with less accuracy and limited temporal resolution. Ground measurements on the other side provide higher temporal resolution and more accurate data but are limited in space and time. Merging the two sources addresses these limitations and provides a more comprehensive and accurate assessment of solar radiation with broad spatial coverage and an improved understanding of solar radiation variability across different timescales and locations. The goal of this study is to reduce the uncertainty of satellite-based long-term monthly data of solar radiation by combining them with short-term highly accurate ground measurements in Qatar and further evaluate the interpolation and merging of ground and satellite data by using regression-kriging models. The Regression-kriging models (RK) are a hybrid of linear regression and simple kriging. The regression equation works on modelling the mean value as a weighted sum of the explanatory variables. Kriging works by modelling the regression residual term using a semi-variogram model. Regression-kriging models operate on both regression and kriging simultaneously. Hence, regression-kriging models can make more accurate predictions than either regression or kriging can achieve on their own (Pebesma Citation2006). The RK algorithm and its variants such as Empirical Bayesian kriging (EBK) regression are used here to take advantage of both satellite and ground data in generating long-term solar radiation maps for Qatar. To the author's knowledge, these long-term calibrated maps are the first of their kind which has been developed for Qatar by using the aforementioned GIS technique. However, this technique can be generalised at the regional level with relatively flat terrain and comprehensive ground measurement station distribution.
Study area
Qatar is situated in the subtropics and receives a significant amount of solar radiation throughout the year. The ground network of solar irradiance measurement, which consists of 13 SRMS, is shown in and the station coordinates are listed in . Each station consists of a pyranometer, a pyrheliometer and a shadowed pyranometer measuring GHI, DNI, and DHI, respectively with 1-min temporal resolution.
Figure 1. Solar radiation assessment Network, Qatar.
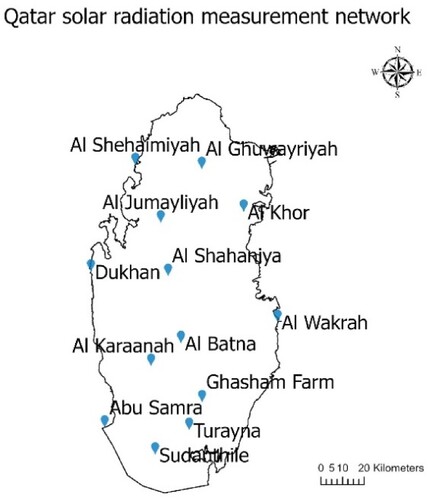
Table 1. Name and coordinates of the ground stations.
Datasets
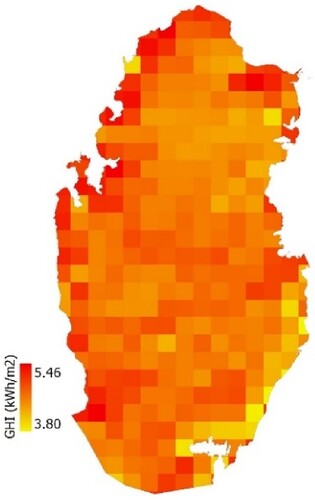
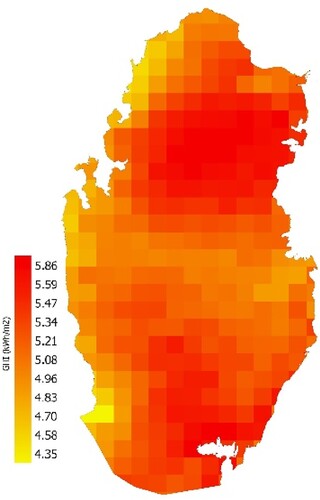
Monthly GHI and DNI data from 2020 to 2022 have been utilised here. The data are retrieved from the ground stations. They are shown in and further passed through several quality checks based upon BSRN guidelines to ensure the quality of data (Long and Dutton Citation2010; Perez-Astudillo et al. Citation2022). The satellite data used here are for the period 2009–2022 and retrieved from the online SoDa services using the Helioclim-3 (HC3) database (“HC3 Archives – SoDa” Citation2023). HelioClim-3 is a satellite-derived solar radiation database that exploits the Heliosat-2 method to estimate a ‘cloud index’, based on the analysis of the satellite images in the visible band. The spatial resolution is 3 km at Nadir and ∼6 km at the location under study as shown in , with 15 min temporal resolution and a time step ranging from 1 min to 1 month. The monthly time step is used here for comparison purposes with ground data.
Figure 2. Satellite-derived GHI (predictor variable), 6 km spatial resolution.
Methodology
Regression-kriging model
The method is based on interpolation using regression and kriging model (RK model, hereafter) of the Pykrige python package (“PyKrige – PyKrige Citation1.Citation7.Citation1 documentation” Citation2023). The original code is available in PyKrige Documentation Release 1.7.1 (“PyKrige Documentation Release PyKrige developers” Citation2023). However, the code here has been modified as will be explained below to automate the variogram model and to implement over ground and satellite data.
The process of regression and kriging prediction is shown here as an example:
Ground data is considered as the target variable, and satellite-derived data is considered as the predictor variable hereafter. represents the SRMS location over the GHI layer obtained from satellite data. Determine a linear model of the ground data as predicted by predictor variables at 13 SRMS locations as shown in .
The Target variables are used to model the covariance structure of residuals obtained from linear regression model in step 1, by fitting a variogram model (Hengl, Heuvelink, and Stein Citation2004). A stable model available in the gstools package is fitted with no nugget (“GSTools/examples/03_variogram/05_auto_fit_variogram.py at main · GeoStat-Framework/GSTools” Citation2024) as shown in . The aforesaid modification in the code to generate this automated variogram is also shown in .
Kriging residuals have been calculated for unobserved locations (locations where ground data is not available) by using the variogram model as shown in . The trend obtained from linear regression model derived in , is applied to the predictor variable as shown in . The final predictions were obtained by adding the values represented in and at each location and shown in , hereafter considered as targetp.
Figure 3. SRMS locations and GHI layer from satellite data.
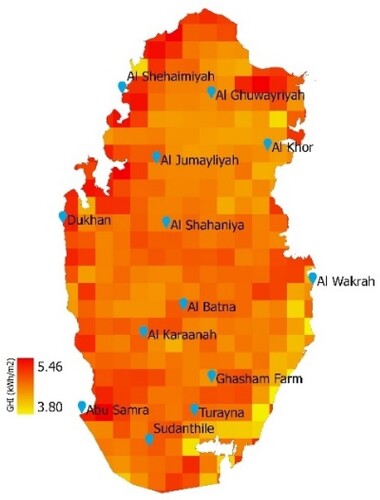
Figure 4. linear model fit between target and predictor variable at ground location, GHI values are daily totals for February 2020.
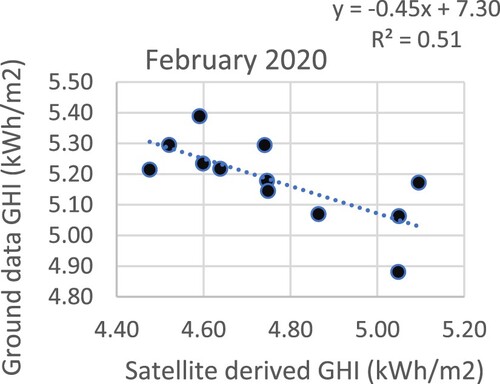
Figure 5. Fitted variogram model.
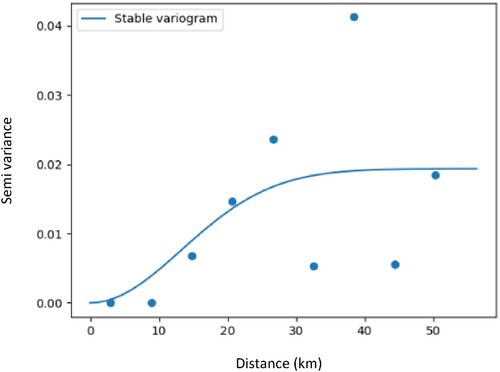
Figure 6. Python code for variogram plotted in .
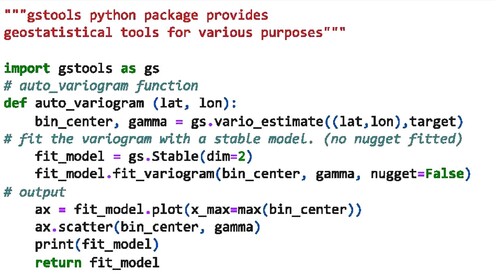
Figure 7. Kriged residual in GHI for unobserved location.
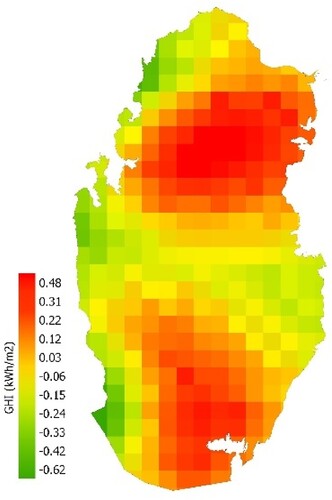
Figure 8. Trend applied on predictor variable.
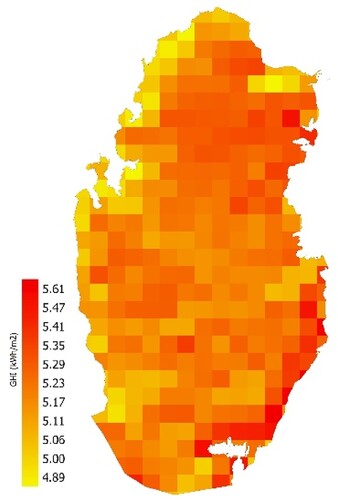
Figure 9. Final prediction after regression and kriging.
Mapping
Mapping is performed in three main steps. The root mean square error (RMSE) and normalised root mean square error (NRMSE [%]: RMSE / average of target variables at the specific location) have been used to quantify the error. The interannual variability is considered minimal unless and until some extreme weather events happen throughout the months and year, ranging from 0% to 3.8% based on several calculations carried out by SOLARGIS for different climatic zones (“Combining Model Uncertainty and Interannual Variability | Solargis” Citation2024).
First, the brute force approach is applied to derive the best-calibrated model for each month of the long-term yearly data. For GHI and DNI, 3 years (2020–2022) monthly data of daily totals are available from ground stations. For GHI values, the RK model is applied to explanatory variables (latitude, longitude, satellite data point extracted at SRMS locations) and the dependent variable (ground measurement from SRMS locations) for the year 2020 for each month. The model is calibrated with the 2020-year data hence it is used to predict the targetp variable for the years 2021 and 2022 for each month. The ground values and the predicted targetp have been compared and RMSE and NRMSE values have been calculated as shown in . A similar process has been carried out for the 2021 and 2022 years and NRMSE values are shown in and .
Table 2. GHI, 2020 data is used to calibrate the RK model and NRMSE for 2021 & 2020 are shown in table.
Table 3. GHI, 2021 data is used to calibrate the RK model and NRMSE for 2020 & 2022 are shown in table.
From , for each month in the year, the model has been selected from the year that was considered with the least average NRMSE for that month.
In the second step, satellite data with 6 km resolution from the year 2009 to 2022, available in the form of a grid, has been long-term averaged for each month and finally concatenated to form a representative single year. The calibrated model for each month obtained in the first step is applied over the satellite data (predictor variable) and latitude and longitude to obtain the calibrated data at each grid point.
In the third step, the downscaling of data was performed by using a 30 m ALOS World 3D digital surface model (DSM) (Takaku et al. Citation2021) as an explanatory raster variable and applied to data obtained from the second step by using the EBK regression prediction tool available in ArcGIS pro (Krivoruchko and Gribov Citation2019). This tool is a more sophisticated version of the regression and kriging model. To the best of the author’s knowledge, its basic functionality remains the same as the RK model. However, there are changes which are worth mentioning here, such as the Empirical Bayesian kriging which is an interpolation technique that creates many subsets of data and does several simulations to account for inaccuracy in estimating the underlying semivariogram. The fact that EBK Regression Prediction models are computed locally gives it a significant edge over other regression kriging models and helps in modelling the regional changes accurately. We used DSM as explanatory variables to scale down the calibrated data and to visualise the topographical variation of solar radiation with varying elevations at higher resolution. However, any type of shadow analysis is not incorporated in this experiment. The input variable is the calibrated data obtained from the second step. The tool is a proprietary product of ESRI and more information regarding the operation and functionality can be assessed from the documentation (“EBK Regression Prediction (Geostatistical Analyst) – ArcGIS Pro and Documentation” Citation2023). The above three steps have been performed similarly for DNI data and the final maps are available at 30 m resolution and discussed in the result section.
Results and validation
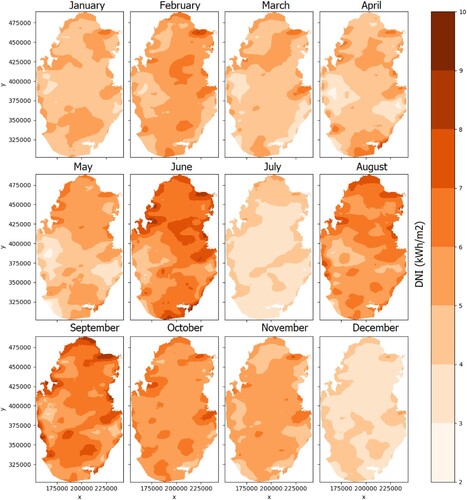
The results in the form of calibrated GHI and DNI maps are presented in and respectively. Each monthly map represents the daily totals of GHI and DNI in that month for the long-term years from 2009 to 2022. These maps are spatially continuous and have a resolution of 30 m. These maps provide an overview of solar radiation in Qatar throughout the year. It can be observed that GHI and DNI over the months of November, December and January are lower compared to other months, and among these months radiation in December is the lowest.
Figure 10. Long-term monthly maps for GHI (2009–2022) latitude(y), longitude(x).
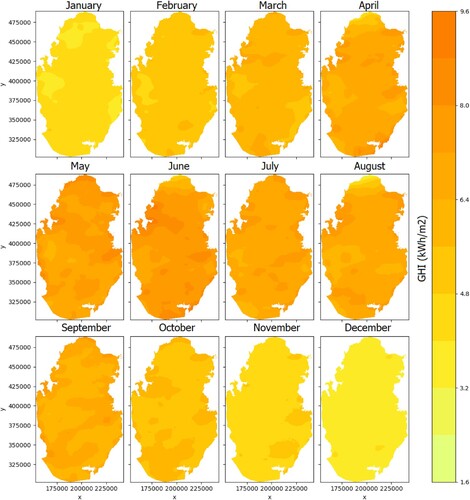
Figure 11. Long-term monthly maps for DNI (2009–2022) latitude(y), longitude(x).
These maps are validated with the 2023 ground data. Values are extracted from these maps at ground point locations and compared with the ground GHI and DNI values of the 2023 year. NRMSE has been calculated for GHI and DNI values as shown in and . No. of station rows in and represent the number of stations involved in calculating NRMSE. Due to lack of ground data availability some of the stations are not involved in all months for validation.
Table 4. GHI, 2020 data is used to calibrate the RK model and NRMSE for 2020 & 2021 are shown in table.
Table 5. GHI validation with year 2023 ground stations, NRMSE values for each month.
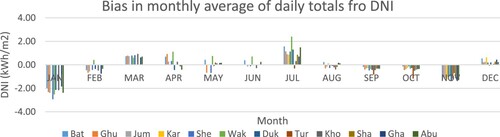
The average NRMSE throughout the year for GHI and DNI is 6.94 and 20.63 respectively. However, if NRMSE for January, July and November is excluded, then the remaining average NRMSE for GHI and DNI is 4.00 and 11.70%, respectively. It is seen that the NRMSE for these months is higher compared to other months, and this is noticeable in the analysis of the interannual variability for these months. and , represent the monthly ground data comparison of years 2020, 2021, 2022 and 2023. Here, the years 2020, 2021 and 2022 monthly data have been averaged and compared with the 2023 monthly data to show the interannual variability. The difference is represented in the form of bias. It can be observed that for January, July and November the bias is greater as compared to other months, which is reflected as high values of NMRSE in the GHI and DNI validation and respectively.
Figure 12. Bias in monthly average of daily totals of 2023 year as compared to the average of 2020,2021 and 2022 for GHI.
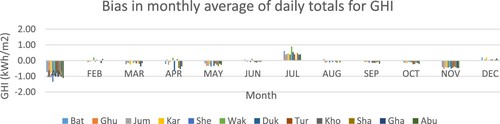
Figure 13. Bias in monthly average of daily totals of 2023 year as compared to the average of 2020,2021 and 2022 for DNI.
The first two rows of represent the monthly comparison of long-term data derived from the calibrated map with 2023-year ground data. Each month’s NRMSE has been represented and the average NRMSE for the whole year has been computed. The last three rows represent the monthly comparison of SoDa satellite-derived GHI and GHI from ground measurement for the years 2022, 2021 and 2020. The average NRMSE for each year has been computed in the last column. The 2023 satellite-derived solar radiation data are not available to the author and therefore no direct comparison has been carried out here it is assumed that 2023-year satellite data will also follow more or less the same average error as shown in 2020, 2021 and 2022. An improvement of approx. 5.53% in GHI has been observed after calibration. However, if we exclude the month of more variation in the year 2023 ground data as compared to long-term average of 2020, 2021 and 2022 that is January, July and November as shown in , an improvement of 9.15% has been observed in GHI. For DNI there is no significant improvement if we compare the average throughout the year. However, if we exclude the month of more variation, a 9.32% improvement has been observed as shown in and .
Table 6. DNI validation with year 2023 ground stations, NRMSE values for each month.
Table 7. Improvement in solar radiation assessment (GHI) through calibration in term of NRMSE.
Table 8. Improvement in solar radiation assessment (DNI) through calibration in term of NRMSE.
Conclusion
In this contribution, satellite – and ground-based solar radiation data have been merged to produce long-term solar irradiance data for Qatar, crucial for the siting and design of solar energy projects in Qatar. Moreover, the long-term maps of GHI and DNI provide a seasonal assessment of solar resources across the whole area of Qatar, which is also crucial for modelling the performance of solar energy systems under various conditions. For a limited amount of ground data availability and relatively flat terrain region with a comprehensive distribution of ground stations such as in Qatar, the regression and kriging model shows promising results and performed as a valuable GIS tool to produce long-term solar radiation calibrated maps. A significant improvement has been observed in GHI and DNI parameters of solar radiation. The NRMSE values for DNI in each month of the long-term calibrated map are higher than the GHI values due to the fact that DNI is highly sensitive to atmospheric parameters such as clouds, water vapour, and aerosols, and satellite-based DNI modelling is affected by the uncertainties of these parameters. Several GHI and DNI validation reports of soda satellite-derived data are also available to support this fact (“Validation – SoDa” Citation2024). There is further scope for improvement in the long-term calibration mapping which depends on the choice of satellite data used for calibration for e.g. a recent report of worldwide benchmark of modelled solar irradiance data from the International Energy Agency(“Worldwide Benchmark of Modelled Solar Irradiance Data – IEA-PVPS” Citation2024) shows SOLARGIS satellite-derived solar radiation data can be another suitable choice for the middle east region. Spatial–temporal models with a longer period of ground data availability may also improve the solar potential mapping because the RK model has its limitation in the temporal dimension.
Acknowledgements
The authors acknowledge the financial support from Qatar Environment and Energy Research Institute (QEERI), Hamad Bin Khalifa University (HBKU, Qatar Foundation). Open Access funding provided by the Qatar National Library.
Disclosure statement
No potential conflict of interest was reported by the author(s).
Data availability statement
As data is of high quality and goes through several quality checks. Hence, it may be available on request.
Additional information
Funding
References
- Albarelo, T., I. Marie-Joseph, A. Primerose, F. Seyler, L. Wald, and L. Linguet. 2015. “Optimizing the Heliosat-II Method for Surface Solar Irradiation Estimation with GOES Images.” Canadian Journal of Remote Sensing 41 (2): 86–100. https://doi.org/10.1080/07038992.2015.1040876.
- Alsamamra, H., J. A. Ruiz-Arias, D. Pozo-Vázquez, and J. Tovar-Pescador. 2009. “A Comparative Study of Ordinary and Residual Kriging Techniques for Mapping Global Solar Radiation Over Southern Spain.” Agricultural and Forest Meteorology 149 (8): 1343–1357. https://doi.org/10.1016/j.agrformet.2009.03.005.
- Alwadei, S., A. Farahat, M. Ahmed, and H. D. Kambezidis. 2022. “Prediction of Solar Irradiance Over the Arabian Peninsula: Satellite Data, Radiative Transfer Model, and Machine Learning Integration Approach.” Applied Sciences 12:717. https://doi.org/10.3390/app12020717.
- Bachour, D., and D. Perez-Astudillo. 2014. “Ground-Measurement GHI Map for Qatar.” Energy Procedia 49:2297–2302. https://doi.org/10.1016/j.egypro.2014.03.243.
- Chen, S., Z. Liang, S. Guo, and M. Li. 2022. “Estimation of High-Resolution Solar Irradiance Data Using Optimized Semi-Empirical Satellite Method and GOES-16 Imagery.” Solar Energy 241:404–415. https://doi.org/10.1016/j.solener.2022.06.013.
- Choi, Y., J. Suh, and S. M. Kim. 2019. “GIS-Based Solar Radiation Mapping, Site Evaluation, and Potential Assessment: A Review.” Applied Sciences 9 (9): 1960. https://doi.org/10.3390/app9091960.
- “Combining Model Uncertainty and Interannual Variability | Solargis.” 2024. Accessed February 20, 2024. https://solargis.com/docs/accuracy-and-comparisons/combining-model-uncertainty-and-interannual-variability.
- “EBK Regression Prediction (Geostatistical Analyst) – ArcGIS Pro | Documentation.” 2023. Accessed December 19, 2023. https://pro.arcgis.com/en/pro-app/latest/tool-reference/geostatistical-analyst/ebk-regression-prediction.htm.
- Fu, P., and P. M. Rich. 2000. “A Geometric Solar Radiation Model and Its Applications in Agriculture and Forestry.” Computers and Electronics in Agriculture 37:25–35.
- “GeoStat-Framework/PyKrige: v1.7.1”. 2023. [Online]. Accessed December 14, 2023. https://zenodo.org/records/10016909.
- “GSTools/examples/03_variogram/05_auto_fit_variogram.py at main · GeoStat-Framework/GSTools.” 2024. Accessed January 3, 2024. https://github.com/GeoStat-Framework/GSTools/blob/main/examples/03_variogram/05_auto_fit_variogram.py.
- Gürel, A. E., Ü Ağbulut, H. Bakır, A. Ergün, and G. Yıldız. 2023. “A State of art Review on Estimation of Solar Radiation with Various Models.” Heliyon 9 (2): e13167. https://doi.org/10.1016/j.heliyon.2023.e13167.
- “HC3 Archives – SoDa.” 2023. Accessed December 13, 2023. https://www.soda-pro.com/soda-products/hc3-archives.
- Hengl, T., G. B. M. Heuvelink, and A. Stein. 2004. “A Generic Framework for Spatial Prediction of Soil Variables Based on Regression-Kriging.” Geoderma 120 (1–2): 75–93. https://doi.org/10.1016/j.geoderma.2003.08.018.
- Hersbach, H., Bill Bell, Paul Berrisford, Shoji Hirahara, András Horányi, Joaquín Muñoz-Sabater, Julien Nicolas, et al. 2020. “The ERA5 Global Reanalysis.” Quarterly Journal of the Royal Meteorological Society 146 (730): 1999–2049. https://doi.org/10.1002/qj.3803.
- Hofierka, J., and M. Suri. 2002. “The Solar Radiation Model for Open Source GIS Implementation and Applications. Proceedings of the Open Source GIS-GRASS Users Conference.” Conference of the Proceedings Open Source GIS - GRASS Users Conference, no. April, pp. 11–13.
- ISO 15927-4. 2005. “Hygrothermal Performance of Buildings – Calculation and Presentation of Climatic Data – Part 4: Hourly Data for Assessing the Annual Energy Use for Heating and Cooling.”
- Jain, S., C. Singh, and A. K. Tripathi. 2021. “A Flexible and Effective Method to Integrate the Satellite-Based AOD Data Into WRF-Solar Model for GHI Simulation.” Journal of the Indian Society of Remote Sensing 49 (11): 2797–2813. https://doi.org/10.1007/s12524-021-01425-3.
- Janjai, S., J. Laksanaboonsong, M. Nunez, and A. Thongsathitya. 2005. “Development of a Method for Generating Operational Solar Radiation Maps from Satellite Data for a Tropical Environment.” Solar Energy 78 (6): 739–751. https://doi.org/10.1016/j.solener.2004.09.009.
- Jiang, Y. 2008. “Prediction of Monthly Mean Daily Diffuse Solar Radiation Using Artificial Neural Networks and Comparison with Other Empirical Models.” Energy Policy 36 (10): 3833–3837. https://doi.org/10.1016/j.enpol.2008.06.030.
- Journée, M., and C. Bertrand. 2010. “Improving the Spatio-Temporal Distribution of Surface Solar Radiation Data by Merging Ground and Satellite Measurements.” Remote Sensing of Environment 114 (11): 2692–2704. https://doi.org/10.1016/j.rse.2010.06.010.
- Kobayashi, S., Yukinari Ota, Yayoi Harada, Ayataka Ebita, Masami Moriya, Hirokatsu Onoda, Kazutoshi Onogi, et al. 2015. “The JRA-55 Reanalysis: General Specifications and Basic Characteristics.” Journal of the Meteorological Society of Japan. Ser. II 93 (1): 5–48. https://doi.org/10.2151/jmsj.2015-001.
- Krivoruchko, K., and A. Gribov. 2019. “Evaluation of Empirical Bayesian Kriging.” Spatial Statistics 32:100368. https://doi.org/10.1016/j.spasta.2019.100368.
- Leirvik, T., and M. Yuan. 2021. “A Machine Learning Technique for Spatial Interpolation of Solar Radiation Observations.” Earth and Space Science 8 (4): e2020E–A001527. https://doi.org/10.1029/2020EA001527.
- Long, C., and E. Dutton. 2010. “BSRN Global Network recommended QC tests, V2. x”.
- Pebesma, E. J. 2006. “The Role of External Variables and GIS Databases in Geostatistical Analysis.” Transactions in GIS 10 (4): 615–632. https://doi.org/10.1111/j.1467-9671.2006.01015.x.
- Perez-Astudillo, D., D. Bachour, A. Sanfilippo, and H. Al-Hajri. 2022. “Management and Operation of Qatar’s Solar Radiation Monitoring Network.” https://doi.org/10.18086/eurosun.2022.15.06.
- Perez, R., R. Seals, and A. Zelenka. 1997. “Comparing Satellite Remote Sensing and Ground Network Measurements for the Production of Site/Time Specific Irradiance Data.” Solar Energy 60 (2): 89–96. https://doi.org/10.1016/S0038-092X(96)00162-4.
- “PyKrige – PyKrige 1.7.1 Documentation.” 2023. Accessed November 22, 2023. https://geostat-framework.readthedocs.io/projects/pykrige/en/stable/.
- Rigollier, C., M. Lefèvre, and L. Wald. 2004. “The Method Heliosat-2 for Deriving Shortwave Solar Radiation from Satellite Images.” Solar Energy 77 (2): 159–169. https://doi.org/10.1016/j.solener.2004.04.017.
- Rocha, P. A. C., and V. O. Santos. 2022. “Global Horizontal and Direct Normal Solar Irradiance Modeling by the Machine Learning Methods XGBoost and Deep Neural Networks with CNN-LSTM Layers: A Case Study Using the GOES-16 Satellite Imagery.” International Journal of Energy and Environmental Engineering 13 (4): 1271–1286. https://doi.org/10.1007/s40095-022-00493-6.
- Ruiz-Arias, J. A., J. Tovar-Pescador, D. Pozo-Vázquez, and H. Alsamamra. 2009. “A Comparative Analysis of DEM-Based Models to Estimate the Solar Radiation in Mountainous Terrain.” International Journal of Geographical Information Science 23 (8): 1049–1076. https://doi.org/10.1080/13658810802022806.
- Sengupta, M., Y. Xie, A. Lopez, A. Habte, G. Maclaurin, and J. Shelby. 2018. “The National Solar Radiation Data Base (NSRDB).” Renewable and Sustainable Energy Reviews 89:51–60. https://doi.org/10.1016/j.rser.2018.03.003.
- “Solar Irradiance Time Series Data | SolcastTM.” 2023. Accessed November 30, 2023. https://solcast.com/time-series.
- Takaku, J., T. Tadono, M. Doutsu, F. Ohgushi, and H. Kai. 2021. “Updates Of ‘Aw3d30’ Alos Global Digital Surface Model in Antarctica with Other Open Access Datasets.” The International Archives of the Photogrammetry, Remote Sensing and Spatial Information Sciences XLIII-B4-2021:401–408. https://doi.org/10.5194/isprs-archives-XLIII-B4-2021-401-2021.
- “Validation – SoDa.” 2024. Accessed January 17, 2024. https://www.soda-pro.com/help/validation/helioclim3.
- “Worldwide Benchmark of Modelled Solar Irradiance Data – IEA-PVPS.” 2024. Accessed January 17, 2024. https://iea-pvps.org/key-topics/worldwide-benchmark-of-modelled-solar-irradiance-data/.
- Yu, X., Xia Yi, Mao-Fen Li, Shengpei Dai, Hailiang Li, Hongxia Luo, Qian Zheng, and Yingying Hu. 2023. “Calibration of the Ångström–Prescott Model for Accurately Estimating Solar Radiation Spatial Distribution in Areas with Few Global Solar Radiation Stations: A Case Study of the China Tropical Zone.” Atmosphere 14 (12): 1825. https://doi.org/10.3390/atmos14121825.
- Yuan, M., T. Leirvik, and M. Wild. 2021. “Global Trends in Downward Surface Solar Radiation from Spatial Interpolated Ground Observations During 1961–2019.” Journal of Climate 34 (23): 1–56. https://doi.org/10.1175/JCLI-D-21-0165.1.
- Zelenka, A., R. Perez, R. Seals, and D. Renné. 1999. “Effective Accuracy of Satellite-Derived Hourly Irradiances.” Theoretical and Applied Climatology 62 (3–4): 199–207. https://doi.org/10.1007/s007040050084.
- Zhao, S., Lifeng Wu, Youzhen Xiang, Jianhua Dong, Zhen Li, Xiaoqiang Liu, Zijun Tang, et al. 2022. “Coupling Meteorological Stations Data and Satellite Data for Prediction of Global Solar Radiation with Machine Learning Models.” Renewable Energy 198:1049–1064. https://doi.org/10.1016/j.renene.2022.08.111.