
 ?Mathematical formulae have been encoded as MathML and are displayed in this HTML version using MathJax in order to improve their display. Uncheck the box to turn MathJax off. This feature requires Javascript. Click on a formula to zoom.
ABSTRACT
This research aims to reduce electricity use and promote activities to reduce electricity use within the organisation through a case study from the PCB assembly department. It was found that the total annual electricity consumption is approximately 2,099,093 kWh/y. The amount of PCB production per time is 7 sheets, and the delay time to release PCB sheets is 15 s per sheet. Therefore, the researcher used the AHP techniques to identify the problems. The solution is to introduce innovative insulation wrapping that can help reduce heat radiation from the machine. From the experiment, it was found that after the improvement, the production number increased to 11 sheets, with a delay time of 10 s per sheet. Production increased by 33.3%, heat loss decreased by 53.5%. As a percentage per power dropped 51% and the percentage of the electricity cost was 70.1% the payback period was 1.69 years.
1. Introduction
The energy demand is expected to increase. Electric power is being increasingly introduced into the manufacturing industry. This will result in a decrease in natural resources and will continue in the future. Including the price of natural resources that tend to increase to the manufacturing industry in terms of energy consumption will have a big impact on the competitiveness of the business and will need to control carbon dioxide, which will directly affect greenhouse gas (GHG) emissions in the production process. This will become a major problem for both the manufacturers and customers. In general, the energy used in the manufacturing process accounts for more than one-third of the total energy consumed in the supply chain and is one of the most important factors. That will affect the overall production cost of the industry to reduce production costs and promote business to be more competitive Therefore, it is necessary to develop efficiency and techniques to control energy consumption with confidence (Park and Lee Citation2013). Although almost all manufacturers consider energy consumption to be the most important issue, few studies have been conducted on the energy efficiency, energy reduction, and CO2 emissions of PCB manufacturing (Jeswiet and Kara Citation2008).
To sign a sample document on carbon dioxide emissions to document the amount of greenhouse gas (GHG) emissions released from the manufacturing process of a product (Liow Citation2009), for example, by analysing differences in the energy use of factories using CNC machines and micro-milling facilities (Luo et al. Citation2005). Theoretical and experimental studies have been conducted to determine the true relationship between the operating conditions of the metal-cutting process using simulations combined with empirical models (Rajemi, Mativenga, and Aramcharoen Citation2010), as well as the development of new models and methods. To optimise the energy footprint of mechanical products (Pusavec, Krajnik, and Kopac Citation2010), methodology and case studies have been presented to achieve sustainability at scale. To increase energy efficiency, higher machining technology, energy conservation, and PCB manufacturing best practices must be considered to save materials. Reduction in waste and expenses from the increase in energy expenditure. The drive for energy efficiency improvements will be the cornerstone of all manufacturing processes, including the PCB manufacturing industry. Consequently, equipment energy efficiency is enhanced in the design process and management to reduce energy consumption (Goosey and Kellner Citation2010).
Electronic Equipment Manufacturing Industry. It focuses on printed circuit board (PCB) production, which integrates electronic components into printed circuit boards. The PCB soldering process is particularly important. Currently, PCB is equipped with a variety of soldering equipment and technologies that use reflow ovens and SMT (Xu, Liu, and Zhang Citation2021) to meet the ever-increasing demand for printed circuit boards. Improvements in printed circuit board manufacturing technologies must be made promptly. SMT (Ma, Huang, and Liu Citation2021; Zhang, Xue, and Wang Citation2016) is an electronic mechanical assembly technology that will also carry out the assembly of electronic products with high reliability, miniaturisation, low-cost production, and production that is automated which is in the current electronic circuit production technology. There has been a shift from the traditional through-hole method to the surface-mounting method. Soldering is an important SMT procedure that directly affects the productivity and reliability of integrated circuits. Therefore, the proper design of the soldering oven, depending on the temperature profile, must be characterised by a curve. This directly affects the solder (Cheng, Xu, and Meng Citation2016). In addition, the temperature setting of each zone and the speed of the conveyor belt play important roles in the quality of the product. Therefore, adjustment and control methods, especially temperature adjustment, must be optimised (Gao, Wu, and Ding Citation2007; Gong, Li, and Yang Citation2006; Pan et al. Citation2010; Tsai Citation2012; Veselỳ et al. Citation2018).
Reflow soldering is a process widely used to mount surface-mounted electronic components on a PCB. This process aimed to create strong solder joints at the base. With the mechanical and electrical connections between the component and the PCB (Lai et al. Citation2022; Pan et al. Citation2019), optimised reflow development can enable defect-free solder joints. eliminating distortion, welding, lumpy solder, and excess intermetallic compounds (Wang, Cui, and Wang Citation2010; Xu et al. Citation2020), This makes it difficult to directly measure the measured value of the surface temperature, which may reflect the solder joint temperature (Ha et al. Citation2020), but there will be a large temperature deviation within the component. For larger components, such as a ball grid array (BGA), the temperature difference determines the thermal mass of the component (Cai et al. Citation2020).
Reflow soldering is an important SMT procedure that has a direct impact on the reliability of electronic systems, which enables the SMD to harness the wire on the PCB. In this process, solder paste is applied to the contact surface of the PCB, and the components are placed in the upper part for brazing of the reflow stage, all of which are heated to a temperature greater than the melting point. The reflux temperature of the solder alloy allowed the melting of the individual solder particles. The same piece can wet the solder surface and form solder along the joint area (Wunderle and Michel Citation2006). The heating of the assembly is normally achieved by convection from several independently controlled oven zones (Whalley Citation2004). Soldering quality is affected by the material properties, including geometric elements and soldering temperature (Illés and Harsányi Citation2009a) after selecting the soldering material in the design process, which becomes the only factor in the manufacturing process affecting soldering quality. Therefore, the operating temperature of the reflow oven is critical for the soldering quality and system reliability. In general, there are two methods for controlling the soldering temperature in a reflow oven. Accurately measuring the temperature field so that the reflow system can be properly aligned and moved, the soldering conventional reflow oven heating characteristics exhibit an uneven temperature distribution in the reflow oven, which can lead to soldering failure. This affects the heating characteristics of conventional reflow ovens. The heating capacity depends on the heat-transfer coefficient. This is determined by the gas flow parameters (Illés and Harsányl Citation2009b). Distribution of heat transfer coefficients in the conventional reflow oven. The reflow oven was then subjected to forced convection. In this type of oven, a large gas stream can be generated in the heater. The heat transfer coefficient of gas flow mainly determines the heating efficiency (Illés Citation2010). The high-pressure convection is low in electronic manufacturing systems. This is an important factor in the production of efficient and defect-free electronics in the soldering of electronic components to printed circuit boards. The reliability decision is based on the quality of the solder connections; if the reflow voltage is too high, it results in higher power consumption. Conveyor speed also results in maximum energy consumption (Esfandyari et al. Citation2014).
To reduce electricity consumption and promote activities to reduce electricity within the organisation, this study will be conducted in the PCB assembly process, focusing on reflow oven machines owing to the problem of maximum power consumption. The goals of this study were divided into two factors:
Analysis of problems from energy consumption by using the theory of newton's law of cooling to analyse the heat loss of reflow oven machines.
Finding ways to improve reflow oven machines to reduce energy consumption.
2. Methodology
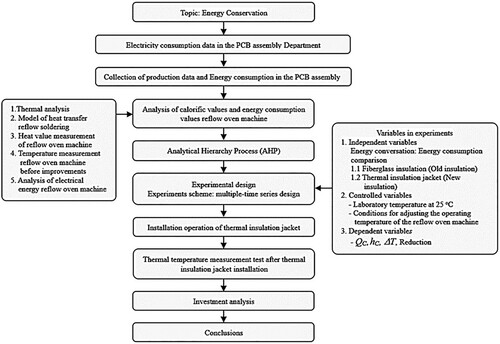
The research began with collecting electricity consumption data from the PCB assembly department. Subsequently, we collected the PCB assembly capacity and electricity consumption data for the PCB assembly. Next, the researcher used the analytical hierarchy process for the cause analysis of calorific values and energy consumption values in a reflow oven machine by considering temperature measurement and heat loss calculations under the control of a multiple-time series experimental design. The updated data and summarised research results are shown in .
Figure 1. Culture framework elements.
2.1. Collecting electricity consumption data in the PCB assembly department
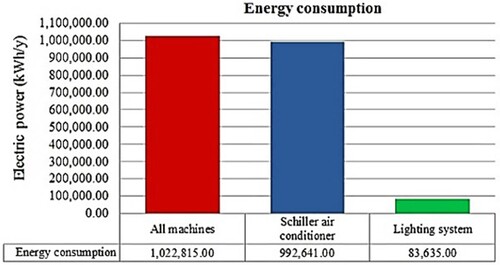
The researcher collected the electrical energy consumption data in the PCB assembly department from , which shows the total energy consumption data of 2,099,093 kWh/y. The energy consumption can be divided as follows:
The machine has an energy consumption equal to 1,022,816 kWh/y.
Air conditioning energy consumption equal to 992,642 kWh/y.
Lighting system energy consumption equal to 83,635 kWh/y.
Table 1. Electric power consumption in PCB assembly.
Energy consumption data showed that the operation of the machines in the PCB assembly department had the highest energy consumption. shows a graph of electricity consumption. Therefore, machinery was selected to study and find ways to improve energy savings.
Figure 2. Energy consumption of electrical equipment.
From the comparison of the electricity consumption of machines in the PCB assembly department, as shown in , it was found that reflow oven machines have a total of seven machines, with a total electricity consumption of 726,200 kWh/y when splitting the energy consumption per machine. There will be an electric energy consumption of 103,742 kWh/y, equivalent to 97.97% for other machinery related to work when included. A total of 138 units were available. The total electrical energy consumption is 296,617 kWh/y when the energy consumption per unit is split. There will be an electrical energy consumption of 2,150 kWh/y, equivalent to 2.03% when the total electrical energy consumption of the machine is equal to 1,022,817 kWh/y, and energy consumption per machine is 105,892 kWh/y.
Table 2. Comparison of electric power consumption of machine in PCB assembly department.
2.2. PCB manufacturing process
The steps that occur during the assembly process of a PCB can be understood in detail. To guide the analysis of the causes in the next step. The process to be studied is known as the cream-side process. Work processes can be divided into seven categories: descriptions of the processes and functions in each process. are listed in .
Table 3. Cream side process and the function of each process.
Considering the machines used in the cream-side process, there were seven machines in total. When calculating the electrical energy consumption, it was found that the reflow oven machines had an electrical energy value of 103,742 kWh/y for other machines in the process. A total of six machines, the total electrical energy consumption is 12,900 kWh/y, the average electrical energy consumption per machine is 2,150 kWh/y, and the total electrical energy consumption of all machines is 116,642 kWh/y from .
Figure 3. Analysis of electrical energy consumption in the creaming process.
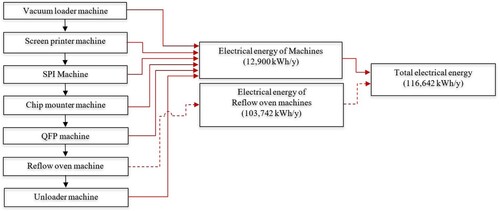
From a comparison of the electric power consumption data in the cream-side process, it was found that the reflow oven process consumed the most energy. The energy consumption per machine was 103,742 kWh/y. The reflow oven process was chosen to analyze the process that used the most energy.
The reflow-oven process data could be divided into five categories. shows the reflow oven process, and lists the functions of each process of the reflow oven.
Figure 4. Flow process chart of reflow oven process.
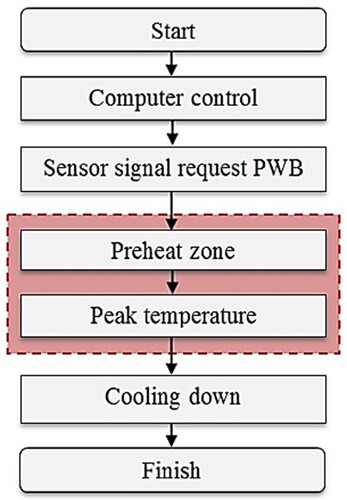
Table 4. Reflow oven process and the function of each process.
From the study of the reflow oven process, it was found that in the 3rd process, it was the preheat zone process that had to control the heat to keep the temperature in the range of 150–180°C, and in the 4th process, it was the peak temperature process that had to control the heat to keep the temperature in the range of 220°C by the heater device for heating in temperature control, both processes are the ones with the highest electrical energy consumption. Therefore, the researcher decided to consider the causes and find ways to improve them further.
2.3. Collection of production data and energy consumption in the PCB assembly
From , the researchers and those involved selected the machines with the highest energy consumption and analysed them to determine the cause. Products used as PCB of the air conditioner. The reflow oven is the TAP30-438EME model that was imported from 2012–2022, including its useful life. 10 years of work, Therefore data on the production and consumption of electrical energy were collected. During working hours from 08:00 am to 9:00 pm and from 9:00 pm to 08:00 am, there was a total of 24 h per day. Working days were calculated as 21 days per month. It was found that before the renovation of the overflow oven machine between January and December 2022, the production capacity was 398,871 pieces/y, and the total electricity consumption cost was 103,742 kWh/y.
Table 5. Data on the production and use of electrical energy of reflow oven machine during the month of January-December 2022.
2.4. Analysis of calorific values and energy consumption values reflow oven machine
2.4.1. Thermal analysis
The PBC sheets are conveyed using a conveyor system. The process of reflow oven machine is divided into eight zones with two important processes: the preheating zone, which controls the temperature in zone 1-zone 5 in the range of 150–180°C, and the peak temperature process, which controls the temperature in zone 6-zone 8 in the range of 220°C. During operation, the temperature was adjusted according to the specified values of the heaters used in each zone. There are two heaters in each zone, the upper and lower heaters, as shown in .
Figure 5. Internal structure of PCB conveying with conveyor in each zone.
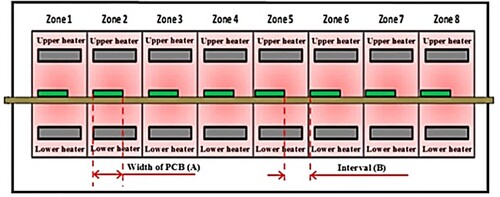
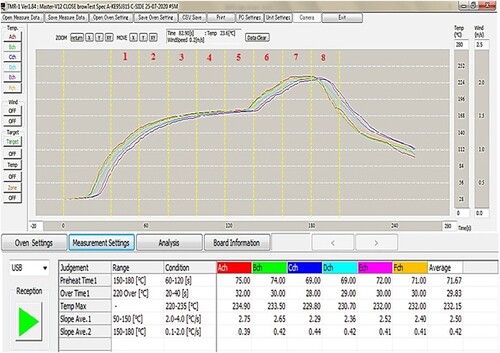
The temperature setting of the heater was operated under different temperature setting conditions for each zone before the reflow oven. There was a difference in each zone, starting from setting the heater temperature to the lowest value starting from zone 1, and the temperature values of the upper and lower heaters were equal to 165°C. In zones 2–5, the temperatures of the upper and lower heaters were 180°C. The upper and lower heater temperatures in Zone 6 were 245°C. The upper and lower heater temperatures in Zone 7 were 255°C, and the upper and lower heater temperatures in Zone 8 were 235°C. The fan speed was located at the lower position of the upper heater, and the fan speed was at the medium position for the lower heater. The conveyor belt speed is 1.05 m/min. Then, the switch was turned on to operate the reflow oven machine. The resulting temperature is shown in , which shows the temperature of the reflow oven machine at different time intervals.
Figure 6. The result of temperature setting while the reflow oven is operating.
2.4.2. Model of heat transfer reflow soldering
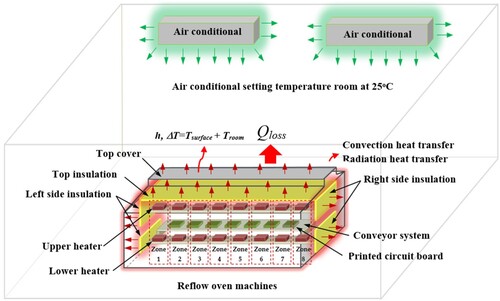
shows the physical characteristics of the heat transfer during reflow soldering in the laboratory. The room temperature was set at 25°C during the soldering process. The soldering oven transfers heat to and heats the integrated circuits. There are three ways to transfer heat in an oven: convection heat radiation and heat transfer (Ding et al. Citation2010). The reflow soldering oven generated heat on the board and passed heat transfer with air. There are different temperatures between the integrated boards. The heat in the hot zone of the board is transmitted by heat radiation. Because the integrated board does not meet the heat zone by passing through the conveyor belt, a heat transfer process occurs (Illés et al. 2014). The surface heated by the heating zone convection and radiation both occur at the upper and lower surfaces (Tsai Citation2012) hot and can be classified by the rate of heat flow from the convection heater to the material in the oven, which is based on Newton's law of cooling (Castell et al. Citation2008; Cengel and Ghajar Citation2020; Gao, Tse, and Mak Citation2003; Wang, Zhou, and Li Citation2021) the heat loss was calculated as:
(1)
(1) where QC is the heat loss from convection (Watt) and hC is the convection heat transfer coefficient (W/m2.K), A is the surface area (m2), ΔT is the difference between the surface temperature and room temperature (K). Radiation is a method of transferring energy to objects by receiving and sending electromagnetic waves when the temperature of an object exceeds the absolute zero temperature. Then, it sends electromagnetic waves to the outside environment. The radiation and absorption capacity of the black body follow the Stefan–Boltzmann law (Illés and Bakó Citation2014) calculated as
(2)
(2) where σ is the radiation coefficient of a normal body with a radiation coefficient smaller than that of a black body. The radiation coefficient is calculated as follows:
(3)
(3) If the electromagnetic waves emitted in the oven are ignored, only the radiation between the heating zone and the integrated printed circuit board is considered. Changing radiation between the heating zone and the integrated circuit. This was calculated as follows:
(4)
(4) where Toven is the heating zone temperature, and T is the integrated printed circuit board temperature. If we consider the emission coefficient in the heating zone and integrated printed circuit board, it will be ϵ1 and ϵ2 where A is the area of the integrated circuit solder zone. Radiant heat transfer was calculated as follows:
(5)
(5) If the equivalent emission coefficients ϵ from Equation 5 can be substituted for each other, the radiant heat transfer can be calculated as:
(6)
(6) Radiant heat transfer can be converted according to Newton's law from Equation 7
(7)
(7) where hr is the convection heat exchange coefficient (W/m2.K) after the radiation transfer, Equation 8 was obtained.
(8)
(8) From the calculation equation, the upper and lower skin heat in the debugging zone. This can be determined using Equation 9.
(9)
(9) If radiant heat and convection are the combined sum of the heat transfer coefficients, h = hc + hr is the heat loss, as shown in Equation 10.
(10)
(10)
Figure 7. Heat transfer of reflow oven in operation room.
2.4.3. Heat value measurement of reflow oven machine
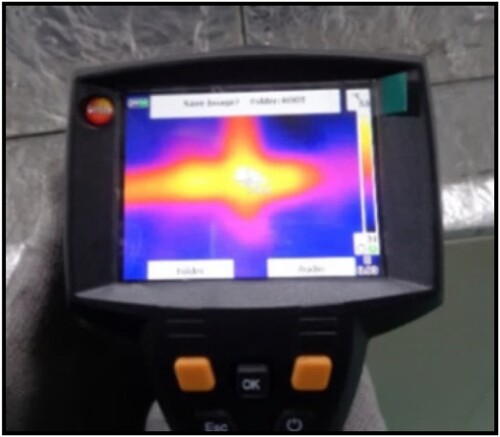
The purpose of measuring the heat value of the reflow oven machine was to use the measured temperature to calculate the heat loss. The calorific value was measured in the vicinity of the reflow oven. Therefore, the measurement location was divided into five positions, namely, position 1 right-side covers. The measuring point was divided into eight points, namely the R1-R8 positions. At the two left-side covers, measuring points are divided into eight points, L1-L8, position 3 right-side middle covers, measuring points are divided into two points, TR1-TR2, position 4 left-side middle covers, measuring points divided into two points, namely TL1-TL2 and position 5 top covers. The measurement point was divided into two points, namely T1-T2, as shown in , and a thermal imager model Testo 875 was used to measure the thermal values. occurs, as shown in .
Figure 8. Temperature measurement position of reflow oven machine.
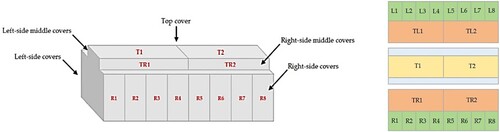
Figure 9. Thermal imager model Testo 875.
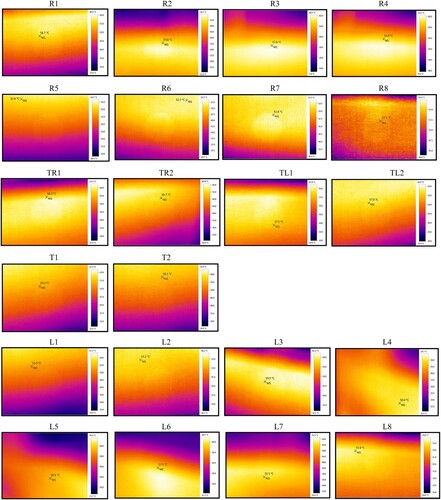
2.4.4. Temperature measurement results reflow oven machine before improvements
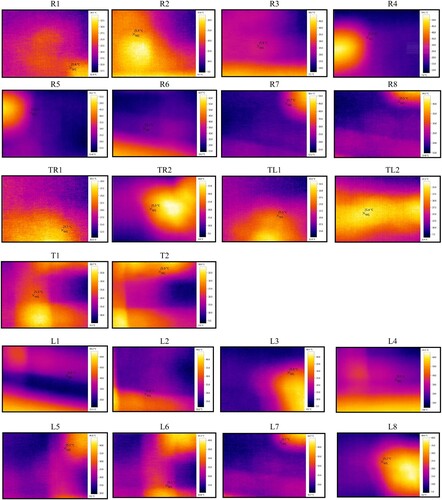
To measure the heat generated at various points, the researcher determined the locations and points to be measured for a total of 5 locations and 22 points. The results obtained using the measurement tool are shown in .
Figure 10. Results of temperature measurement at different points of the reflow oven machine before improvement.
The heat temperature measurement data at the reflow oven were collected, and the value obtained from the heat temperature measurement was used to calculate the heat loss in the reflow oven machine by considering the equation.
(11)
(11) where Q is the heat loss (Watt), ht is the efficiency of the total heat transfer between heat conduction and heat radiation (W/m2.k), A is the area of cover, and ΔT is the difference of temperature between surface temperature and room temperature (Kelvin) shows the results of the measurement of heat values and heat loss calculations. The results show that at the position of the right-side covers, the mean temperature is 54.38oC. The mean heat loss was 469.41 (W), at the left-side covers position, the mean temperature was 55.21 oC, the mean heat loss was 476.525 (W), at the right-side middle covers, the mean temperature was 56.95 oC, the mean heat loss was 675.855 (W), at left-side middle covers, the average temperature was 56.95 oC, the average heat loss was 677.04 (W), and at the top covers position, the average temperature was 55.15 oC, the average heat loss was 1,004.885 (W), lost occurs at the topmost because the temperature will spread to the top.
Table 6. Thermal measurement results and calculations for heat loss before improvements.
2.4.5. Analysis of electrical energy reflow oven machine
For the power measurement, the measuring point was divided into three points, which measured the values of voltage (v), current (amp), and power (kW). The measurement of the electrical energy revealed that the average voltage value was 390.88 (v). The current value was the average of 36.19 (amp) and the sum of the power was 24.369 (kW), which can be considered in .
Table 7. Electrical energy measurement of reflow oven machine while operating.
2.5. Analytical hierarchy process (AHP)
The analytical hierarchy process was developed by Saaty (Citation1990). The principle of analytic hierarchy is to structure a problem into layers. The first layer involves targeting, criteria, sub-criteria, and alternatives, and then analyses the best alternatives. With a trade-off, the pairwise alternative criterion makes decision-making easier. Comparative significance of each criterion by prioritising after grading. To prioritise the requirements, alternatives were analysed individually based on the criteria set for each criterion until the requirements were met. If the importance or preference score is reasonable, conformity helps alternative priorities find the best option (Saaty Citation1980). AHP is widely used in project evaluation decisions and is theoretically considered more congruent. The most accurate weight score against alternative comparison decision criteria is preferred by AHP because of its simplicity and reliability. The bias for numerical ratios can be eliminated and consensus inconsistencies can be measured directly (Saaty Citation1990).
This study examines the main practices used in terms of energy efficiency. The PCB assembly manufacturing process proposes the use of a multi-criteria method called the analytical hierarchy process to select the best option. The methodology of this study consists of resources for efficient practice in PCB assembly, which collects analytical data and consists of components of the analytical process. Preparation of the study and recommendations.
Based on the literature review, especially from the theory and research on factors affecting energy conservation in the PCB assembly process, it was found that the summary of factors and alternatives used in this research is shown in , and presents the criteria used for analysis and alternative solutions from .
Figure 11. AHP analysis (Saaty Citation2012).
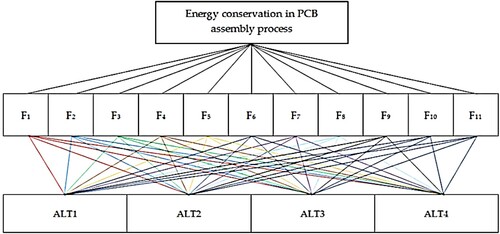
Table 8. Criteria analysis.
Table 9. Alternatives analysis.
2.5.1. Matrix comparing pair-criteria table for making decision
presents a paired comparison. Compared to other factors, the impact of this factor is at a higher level. As in the table below.
Table 10. The matrix is used to show the comparison of factors under the objective of the problem (Saaty Citation2012).
where a12 is the priority value of Factor 1 compared to Factor 2 under the objectives of the problem. Then, 1/a21 is reciprocal, under which the decision criterion concludes that Factor 1 is compared with Factor 2 to Factor n in the horizontal row of Factor 1. Therefore, the comparison is performed in the same manner as for Factor 2 in Row 2.
2.5.2. Comparison between the pair criteria to determine the significance weight
In the comparison between the pair criteria for determining the significance weights, a number was assigned instead of a value to determine the comparative significance of each subsection. A standard numerical significance level of 1–9 is reasonable and can effectively show the relationship between the criteria. shows the scale used to compare the significance.
Table 11. The standard table shows the scale used to compare the significance (Saaty Citation2012).
Comparing the pair of criteria with a matrix table hierarchically and systematically, both horizontal and vertical rows. The next step is to analyse the geometric mean, which is the product of the desired numbers you want to find. Finally, the root, according to the number of numbers, is given by Equation 12.
(12)
(12) where aij is the number in the matrix, Vi is the geometric mean, and n is the number that must be analysed as the mean.
Numerical values were obtained by comparing the factors individually, as shown in . Next, the significant weight is used by dividing the precedence values in each column by the sum of the precedence values in the same column to obtain a matrix of percentage values and calculate the mean in each row horizontally with a percentage matrix, which is the weight analysis of the factors. We look at the table below:
Table 12. The matrix table shows the sum of the vertical rows.
The significance weights of the factors in each class were obtained from data synthesis, as shown in Equations 13 and 14.
(13)
(13)
(14)
(14) where Wi is the score weight of each factor, Vi is the geometric mean, and n is the number of values to be averaged. shows the important weights of the factors, shows a comparison of the scores between objectives, and shows the eigenvector calculations.
Table 13. Table of important weights of factors.
Table 14. Comparison of scores between objectives.
Table 15. Eigenvector calculations.
From , the average of the numbers in vector D, λmax = 12.37. Consistency test: Significant weight analysis, C.I. value, C.R. value.
Table 16. Dividing the number in vector C by vector B (C/B) yields vector D.
A consistency test was performed by comparing the obtained values with all the criteria. Subsequently, the sum of the diagnostic values for each criterion in the column was individually multiplied by the sum of the horizontal means. The resulting products were added. This result is equal to the total number of criteria compared. The sum of the calculated values, known as the eigenvalues, is expressed as follows: if the analytical results are fully consistent, λmax = n.
(15)
(15) The consistency index (C.I.) was calculated by multiplying the significant weight of the factors by the precedence values in the same vertical row, We then analysed the mean in the horizontal rows to obtain a multiplication table to determine the consistency of the reasons, as shown in Equation 15. The consistency ratio (C.R.) can be calculated from the ratio of the consistency index (C.I.) calculated from the matrix table and the random consistency index (R.I.), as shown in Equation 16.
(16)
(16) where n is the number of factors equal to 11 from the calculation C.I. = 12.4
(17)
(17) where C.R. is the consistency ratio, C.I. is the consistency index, and R.I. is the random ratio. The random index is the consistency index, which is obtained by sampling the reciprocal matrix using a standard criterion of significance ranging from one to nine. The means of the experimentally obtained depression indices in each dimension of the matrix at n = 1–15 are presented in .
Table 17. The value of the conformity index is according to the metric size.
From , when the value of n = 11, the value of R.I. = 1.45 substituted the value in Equation 17. Therefore, the CR value is 0.09. The results obtained were less than 0.1, indicating that the factors were consistent. The eigenvectors can be used as the weight values.
2.6. Investigation of causes that occurred in reflow soldering m/c
A reflow soldering machine is one of the many devices that use heat energy in the manufacturing process. With an average surface temperature of 90–120 oC and a maximum temperature of 220 oC, all surfaces of the reflow solder front, back, top, and bottom were heated while the solder was operating. This transmission transmits wasted energy in two ways.
The heaters on board have a greater workload to try to stabilise the temperature.
The air conditioning system also works harder to create and maintain room temperature.
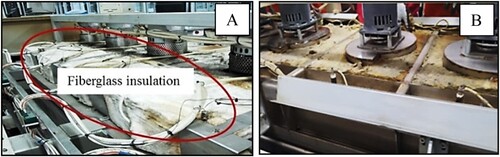
In the examination of electronic circuit dryers, it was found that there was single-layer heat-resistant fiberglass insulation installed inside the machine, as shown in showing single-layer heat-resistant fiberglass insulation
Figure 12. (A) Fiberglass insulation deterioration and (B) Deterioration of insulation around the blower motor.
Guidelines for improvement and correction
Replace insulation
Determine the workflow of employees to control the machine on–off.
Set a schedule for turning on and off the machine
Temperature control of tin to260 oC
From the study of additional information, it was found that innovation developed. A form of insulation that can effectively prevent heat radiation can help to reduce the use of electricity. One of them, the thermal insulation jacket, is one of the solutions to ‘Energy Conservation,’ which works by preventing heat radiation from machinery or equipment from affecting the room temperature and reducing the workload of onboard heaters. The interior consists of a high-silica glass cloth ceramic blanket and silicone-coated glass cloth for water and chemical resistance. Sewing with fiber-coated glass threads. In addition, the life of the insulation jacket can be extended by inserting aluminum rods into the insulation to further enhance the shape and strength of the jack. Individual packets on wave solder pots formulate solutions from meetings and brainstorming by considering preliminary results. The same conclusion was reached, namely, changing the single-layer fiberglass insulation to a thermal insulation jacket instead of the original one.
3. Research results
3.1. Experimental design
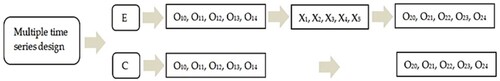
The experimental scheme used in this study was a multiple-time series design. The data were collected multiple times at different time intervals. A control box was used in the experimental process; however, nothing was performed in the control group. The symbols used were as follows: E, experimental group; C, control group; X, treatment; O1, pre-observation; O2, post-observation. The experimental model (Tanner Citation2018) is illustrated in .
Figure 13. Experimental design model.
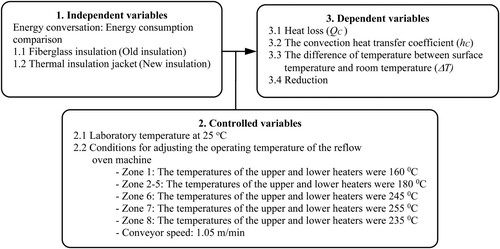
Variables used in the experiment. In the design of the experiment, the researcher defined the variables used in this study from . The details of this study are as follows.
| 1. | Independent variables
| ||||
| 2. | Controlled variables
| ||||
| 3. | Dependent variables | ||||
| 4. | Heat loss (QC) | ||||
| 5. | The convection heat transfer coefficient (hC) | ||||
| 6. | The difference of temperature between surface temperature and room temperature (ΔT) | ||||
| 7. | Reduction | ||||
Figure 14. Assumptions in the experiment.
3.2. Installation operation of thermal insulation jacket
In the PCB assembly process, the researcher found that when PCB passed through the reflow oven machine before the improvement, the number of PCB produced was 7 sheets. The delay time for releasing the PCB sheets was 15 s per sheet. This causes production to slow down and results in a decrease in production. Including it will result in decreased profits as well. Bringing innovation in insulation wrapping is one way with properties. Can help reduce heat radiation from the machine that affects room temperature by replacing the original one.
Innovative insulation jackets are designed to prevent heat radiation from machinery or equipment that affects room temperature and reduces the load on the heater on the machine. A removable insulated jacket consists of a high-silica glass cloth and a ceramic. The blankets and glass cloths were silicone-coated for water and chemical resistance. Sewn with PTFE coated. The glass thread was clamped and was made of stainless steel. Hooks have extended the working life of our heat applications for a long time. Insulation jackets were created by inserting aluminum rods into the insulation to reinforce their shape and to reinforce each jacket onto the wave solder pot. The specifications of the thermal insulation jacket are listed in . Change the fiberglass insulation out of the machine and clean around the area where the insulation will be installed Then install the thermal insulation jacket in the reflow oven machine from shows the installation of the thermal insulation jacket inside the reflow oven machine.
Figure 15. Installation of thermal insulation jacket.
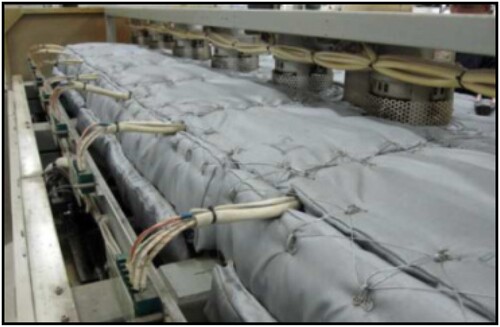
Table 18. Specifications of the thermal insulation jacket.
3.3. Thermal temperature measurement test after thermal insulation jacket installation
When the thermal insulation jacket was complete, the operation of the reflow oven machine was tested to measure the heat-generated temperature. The measurement results are shown in .
Figure 16. Results of temperature measurement at different points of the reflow oven after thermal insulation jacket installation.
shows the results of the heat value measurement and heat loss calculation after the installation of the thermal insulation jacket. The results show that at the position of the right-side cover, the mean temperature is 25.66 oC. The mean heat loss was 221.485 (W), at the position of the left-side cover, the average temperature was 25.55 oC, the average heat loss was 220.515 (W), at the right-side middle covers position, the average temperature was 25.35 oC, the average heat loss was 300.84 (W), at the left-side middle covers position, the mean temperature was 25.35 oC, the mean heat loss was 300.83 (W), and at the position of the top cover, the mean temperature was 25.6 oC, the mean heat loss was 466.5 (W). Calculate the heat loss and find that the heat loss will occur at the top part the most because the temperature will spread to the top.
Table 19. Thermal measurement results and calculations for heat loss after improvement.
Comparing the results of the heat loss calculations before and after the improvement, it was found that the heat loss decreased. In the right-side covered position, the average heat loss decreased by 52.82%, left-side covered position, the average heat loss decreased by 53.72%, right-side middle covered position, the average heat loss decreased by 55.48%. At the left-side middle cover position, the average heat loss decreased by 55.56%, and at the position of the top cover, the average heat loss decreased by 53.57%. The calculation results showed that the heat loss after installing the thermal insulation jacket resulted in a heat loss reduction at every position; in particular, the top cover positions can be considered in .
Table 20. Comparison of results from heat loss before-after improvement.
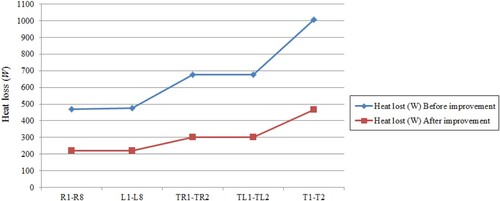
To examine the measurement of the heat temperature at various locations that were defined for comparison before and after improvement, it was found that a thermal insulation jacket can help reduce heat dissipation and heat temperature to the outside as well as the original. As shown in , when the temperature decreased, the heat loss decreased, as shown in .
Figure 17. Comparison of Temperature at various positions before – after improvement.
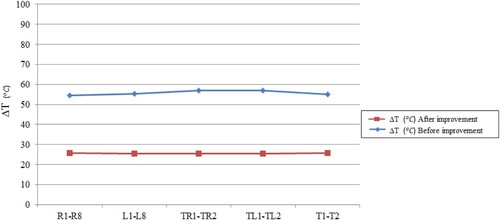
Figure 18. Comparison of heat loss at various positions before and after improvement.
Measurement of electrical energy of the reflow oven machine after installation of the thermal insulation jacket from shows the result of the electrical energy measurement, it was found that the average voltage was 390.88 (V), the current was an average of 22.16 (A), and the sum of the power values is equal to 11.17 kW.
Table 21. Result of electrical energy measurement of reflow oven machine after improvement.
From the comparison before and after the installation of the thermal insulation jacket from the measurements, the voltage was an average of 390.88 (V), and the current was an average of 36.19(A). As a result, energy was reduced by 54.14%, which can be determined in .
Table 22. Comparison of electrical energy measurement of reflow oven machine before and after improvement.
In shows the comparison of the electricity consumption of the reflow oven machine, the electricity consumption of the reflow oven machine is calculated per 1 machine before the improvement of the total energy consumption throughout the year is 103,742 kWh/y after installation. insulator, the total energy consumption throughout the year was 50,298 kWh/y, which can be reduced from the previous 53,445 kWh/y, or 51%. Therefore, the insulation installation of electronic circuit dryers can reduce heat dissipation outside the oven and can save electricity able to reduce electricity bills by 263,333 baht per year or 70.1%.
Table 23. Comparison of collecting electricity bills before and after improvements.
3.4. Investment analysis
Improving the reflow oven machine by changing the fiberglass insulation to a thermal insulation jacket requires an investment. The total investment budget had an expense of 447,000,000 baht, and the difference in electricity costs was 263,333 in the payback period calculation. Consider EquationEquation 1(1)
(1) 8.
(18)
(18) where PB is the payback period (years), C is the total cost of insulation installation (baht), and S is the cost of electricity (years). presents the calculation of the payback period.
Table 24. Calculation of the payback period.
4. Conclusions
Research on ways to save energy, which is the main goal and policy of the company to focus on reducing energy consumption problems and promoting energy conservation within the organisation, is a global issue. Therefore, a study in the PCB assembly department surveyed and collected data on electricity consumption throughout the year, which is equal to a maximum of 2,099,093 kWh/y. The processes that use the most energy are the preheat zone and peak-temperature processes. The calculation for heat loss begins by testing the operation of the reflow oven machines and measuring the heat temperature using a measuring device. According to the positions and points that have been defined and taken the value to calculate the heat loss that occurs during the operation of the reflow oven, it was found that the heat loss occurring in the top cover was the highest with an average of 1,004.885 (W) which causes the cooling system in the working room to adjust the temperature to be equal to the set room temperature. This is why it results in higher electricity consumption. Therefore, researchers searched for the cause and found that the original glass wool insulation deteriorated. Therefore, there is a conclusion from the brainstorming. Changing the new insulation. The innovative insulating materials were introduced in the form of a thermal insulation jacket with a thermal conductivity of 0.125 W/m. K at 500 oC, which can help reduce the heat radiation from the machinery that affects the temperature. Instead, instead of the existing landscape, it was installed.
In summary, the experiment showed that the production number increased to 11 sheets after the improvement.The delay time for releasing PCB sheets was 10 s per sheet. It was growing production by 33.3% per production line. Heat loss at the top cover is reduced by 53.5%, resulting in reduced electrical energy savings. Accounted for 51% and can help reduce electricity costs. It is 70.1% when calculating the break-even point of the investment at 1.69 years. This study can help increase the amount of production, and thus reduce the cost of ordering more machinery to support higher production. and can reduce the use of electrical energy as well.
The Sustainable Development Goals of this researcher can lead the organisation to SDG 9 Industry, Innovation and Infrastructure, SDG 13 Climate Action, and SDG 17 Partnerships for the goals, and the researcher sincerely hopes that this approach will be further developed to bring benefits in the field of energy management in the future.
Nomenclature
Acknowledgment
This research activity was framed within the context of the southeast Bangkok university project. The authors would like to thank southeast Bangkok university for authorisation to publish the main results of the present study.
Disclosure statement
No potential conflict of interest was reported by the author(s).
References
- Cai, C., K. Pan, J. Yang, and S. Park. 2020. “Comparative Analysis of Package Warpage Using Confocal Method and Digital Image Correlation.” Inter Society Conference on Thermal and Thermo Mechanical Phenomena in Electronic Systems 945–949. https://doi.org/10.1109/ITherm45881.2020.9190235.
- Castell, A., C. Solé, M. Medrano, J. Roca, L. F. Cabeza, and D. Garcia. 2008. “Natural Convection Heat Transfer Coefficients in Phase Change Material (PCM) Modules with External Vertical Fins.” Applied Thermal Engineering 28 (13): 1676–1686. https://doi.org/10.1016/j.applthermaleng.2007.11.004.
- Cengel, Y. A., and A. J. Ghajar. 2020. “Fundamentals of Convection.” 6th ed. Heat and mass transfer fundamentals and applications-Mcgraw-Hill Education, 391–393.
- Cheng, Z.H., W. F. Xu, and K. Meng. 2016. “The Application of PIP in Lead-Free Process of OSP Surface Treatment PCB.” Electronic Qualitative 7:48–54.
- Ding, Y., S. Q. Kong, Z. J. Jin, and Z. Rongyue. 2010. “Molecular Dynamics Simulation of Ultrasonic Wire Welding Mechanism in Electronic Packages.” China Mechanical Engineering 21:2496–2500.
- Esfandyari, A., S. K. Aarief, T. Javied, and J. Franke. 2014. “Energy Efficiency Investigation on High-Pressure Convection Reflow Soldering in Electronics Production.”Applied Mechanics and Materials 655:95–100. https://doi.org/10.4028/www.scientific.net/AMM.655.95.
- Gao, Y., S. Tse, and H. Mak. 2003. “An Active Coolant Cooling System for Applications in Surface Grinding.” Applied Thermal Engineering 23 (5): 523–537. https://doi.org/10.1016/S1359-4311(02)00214-4.
- Gao, J., Y. Wu, and H. Ding. 2007. “Optimization of a Reflow Soldering Process Based on The Heating Factor.” Soldering & Surface Mount Technology 19 (1): 28–33. https://doi.org/10.1108/09540910710748131.
- Gong, Y., Q. Li, and D. Yang. 2006. “The Optimization of Reflow Soldering Temperature Profile Based on Simulation.” Proceedings of the 2006 7th International Conference on Electronic Packaging Technology, pp. 1–4, Shanghai, China. https://doi.org/10.1109/ICEPT.2006.359831.
- Goosey, M., and R. Kellner. 2010. “Energy Conservation and Related Best Practices in Printed Circuit Board (PCB) Manufacturing.” Circuit World 36 (1): 38–42. https://doi.org/10.1108/03056121011015086.
- Ha, J., K. Pan, H. Wang, D. H. Won, and S. B. Park. 2020. “The Effect of Misaligned Passive Component on Fatigue Life of Solder Joints and Solder Shape.” Inter Society Conference on Thermal and Thermo Mechanical Phenomena in Electronic Systems, 1029–1034. https://doi.org/10.1109/ITherm45881.2020.9190328.
- Illés, B. 2010. “Distribution of The Heat Transfer Coefficient in Convection Reflow Oven.” Applied Thermal Engineering 30 (13): 1523–1530. https://doi.org/10.1016/j.applthermaleng.2010.02.016.
- Illés, B., and I. Bakó. 2014. “Numerical Study of The Gas Flow Velocity Space in Convection Reflow Oven.” International Journal of Heat and Mass Transfer 70:185–191. https://doi.org/10.1016/j.ijheatmasstransfer.2013.10.075.
- Illés, B., and G. Harsányi. 2009a. “Heating Characteristics of Convention Reflow Ovens.” Applied Thermal Engineering 29 (11-12): 2166–2171. https://doi.org/10.1016/j.applthermaleng.2008.10.014.
- Illés, B., and G. Harsányi. 2009b. “Investigating Direction Characteristics of The Heat Transfer Coefficient in Forced Convection Reflow Oven.” Experimental Thermal and Fluid Science 33 (4): 642–650. https://doi.org/10.1016/j.expthermflusci.2009.01.001.
- Jeswiet, J., and S. Kara. 2008. “Carbon Emissions and CES™ in Manufacturing.” CIRP Annals 57:17–20. https://doi.org/10.1016/j.cirp.2008.03.117.
- Lai, Y., K. Pan, Y. Cen, J. Yang, C. Cai, P. Yin, and S. Park. 2022. “An Intelligent System for Reflow Oven Temperature Settings Based on Hybrid Physics-Machine Learning Model.” Soldering & Surface Mount Technology, https://doi.org/10.1108/SSMT-10-2021-0063.
- Liow, J. L. 2009. “Mechanical Micromachining: A Sustainable Microdevice Manufacturing Approach.” Journal of Cleaner Production 17 (7): 662–667. https://doi.org/10.1016/j.jclepro.2008.11.012.
- Luo, Z., K. Cheng, R. Holt and Z. Liu. 2005. “ Modeling Flank Wear of Carbide Tool Insert in Metal Cutting.” Wear 259 (7–12), 1235–1240. https://doi.org/10.1016/j.wear.2005.02.044.
- Ma, G., X. Huang, and S. Liu. 2021. “Heat Transfer Modeling and Oven Temperature Curve Optimization of Integrated Circuit Board Reflow Soldering.” IEEE Accesss 9:141876–141889. https://doi.org/10.1109/ACCESS.2021.3120496.
- Pan, K., J. H. Ha, H. Y. Wang, V. Veeraraghavan, and S. B. Park. 2019. “The Effect of Solder Paste Volume on Surface Mount Assembly Self-Alignment.” Procedia Manufacturing 38:1381–1393. https://doi.org/10.1016/j.promfg.2020.01.150.
- Pan, E. S., Y. Jin, H. Xu, and W. Z. Liao. 2010. “Forecasting and Parameters Optimization of Reflow Soldering Profile Based on BPNN and GA.” Advanced Materials Research 139-141:990–995. https://doi.org/10.4028/www.scientific.net/AMR.139-141.990.
- Park, Y. J., and G. B. Lee. 2013. “Analysis of Energy Efficiency and Productivity in Dry Process in PCB Manufacturing.” International Journal of Precision Engineering and Manufacturing 14 (7): 1213–1221. https://doi.org/10.1007/s12541-013-0165-0.
- Pusavec, F., P. Krajnik, and J. Kopac. 2010. “Transitioning to Sustainable Production – Part I: Application on Machining Technologies.” Journal of Cleaner Production 18 (2): 174–184. https://doi.org/10.1016/j.jclepro.2009.08.010.
- Rajemi, M. F., P. T. Mativenga, and A. Aramcharoen. 2010. “Sustainable Machining: Selection of Optimum Turning Conditions Based on Minimum Energy Considerations.” Journal of Cleaner Production 18:1059–1065. https://doi.org/10.1016/j.jclepro.2010.01.025.
- Saaty, T. L. 1980. The Analytic Hierarchy Process. New York: Mc Grow-Hill.
- Saaty, T. L. 1990. “How to Make a Decision: The Analytic Hierarchy Process.” European Journal of Operational Research 48 (1): 9–26. https://doi.org/10.1016/0377-2217(90)90057-I.
- Saaty, T. L. 2012. Model, Method. Concepts and Application of the Analytic Hierarchy Process, 2nd ed. New York: Mc Grow-Hill.
- Tanner, K. 2018. Research Methods Experimental Research, 337–356. https://doi.org/10.1016/B978-0-08-102220-7.00014-5.
- Tsai, T. N. 2012. “Termal Parameters Optimization of a Reflow Soldering Profile in Printed Circuit Board Assembly: A Comparative Study.” Applied Soft Computing 12 (8): 2601–2613. https://doi.org/10.1016/j.asoc.2012.03.066.
- Veselỳ, P., E. Horynová, J. Starỳ, D. Bušek, K. Dušek, V. Zahradník, et al. 2018. “Solder Joint Quality Evaluation Based on Heating Factor.” Circuit World 44 (1): 37–44. https://doi.org/10.1108/CW-10-2017-0059.
- Wang, Y., Z. Cui, and B. Wang. 2010. “Test and Assessment of The Heating System of Reflow Ovens.” Proceedings, 11th International Conference on Electronic Packaging Technology and High Density Packaging, 798–804. https://doi.org/10.1109/ICEPT.2010.5582693.
- Wang, M. Q., X. R. Zhou, and B. W. Li. 2021. “Furnace Temperature Curve Regulation Model Based on Thermodynamic Principle.” Science, Technology and Innovation 1:1–3.
- Whalley, D. C. 2004. “A Simplified Reflow Soldering Process Model.” Journal of Materials Processing Technology 150:134–144. https://doi.org/10.1016/j.jmatprotec.2004.01.029.
- Wunderle, B., and B. Michel. 2006. “Progress in Reliability Research in the Micro and Nano Region.” Microelectronics Reliability 46 (9-11): 1685–1694. https://doi.org/10.1016/j.microrel.2006.08.005.
- Xu, J., C. Cai, V. Pham, K. Pan, H. Wang, and S. Park. 2020. “A Comprehensive Study of Electromigration in Leadfree Solder Joint.” Proceedings – Electronic Components and Technology Conference, 284–289. https://doi.org/10.1109/ECTC32862.2020.00054.
- Xu, Y., Y. Liu, and L. Zhang. 2021. “Effects of The Solder Phase Transformation on The Optimization of Reflow Soldering Parameters and Temperature Profiles.”.” Discrete Dynamics in Nature and Society 2021:1–19. https://doi.org/10.1155/2021/9955967.
- Zhang, Y., Q. Xue, and Y.F. Wang. 2016. “Development History and New Trends of Microelectronic Packaging.” Mechanical and Automation Engineering 1 (2): 215–216. https://doi.org/10.1177/0954407015583599.