
 ?Mathematical formulae have been encoded as MathML and are displayed in this HTML version using MathJax in order to improve their display. Uncheck the box to turn MathJax off. This feature requires Javascript. Click on a formula to zoom.
ABSTRACT
Background
Rapid increase in COVID-19 suspected cases has rendered disease diagnosis challenging, mainly depending upon RT-qPCR. Reliable, rapid, and cost-effective diagnostic assays that complement RT-qPCR should be introduced after thoroughly evaluating their performance upon various disease phases, viral load, and sample storage conditions.
Objective
We investigated the correlation of cycle threshold (Ct) value, which implies the viral load and infection phase, and the storage condition of the clinical specimen with the diagnosis of SARS-CoV-2 through our newly developed in-house rapid enzyme-linked immunosorbent assay (ELISA) system.
Method
Naso-oropharyngeal samples of 339 COVID-19 suspected cases were collected and evaluated through RT-qPCR that were stored up to 30 days in different conditions (i.e. −80°C, −20°C and initially at 4°C followed by −80°C). The clinical specimens were evaluated with our in-house ELISA system after finalizing the assay method through checkerboard assay and minimizing the signal/noise ratio.
Result
The ELISA system showed the highest sensitivity (92.9%) for samples with Ct ≤30 and preserving at −80°C temperature. The sensitivity reduced proportionally with increasing Ct value and preserving temperature. However, the specificity ranged between 98.3% and 100%.
Conclusion
The results indicate the necessity of early infection phase diagnosis and lower temperature preservation of samples to perform rapid antigen ELISA tests.
1. Introduction
In the current pandemic situation of coronavirus disease 2019 (COVID-19), people worldwide are suffering as the number of cases so far has crossed 185 million and still counting along with more than 4 million deaths [Citation1]. To date, no specific therapeutics or treatment for COVID-19 has been developed [Citation2]. Even though few vaccines have been introduced, some already have achieved approval, while others are in either development or trial phases; for worldwide distribution, severe acute respiratory syndrome coronavirus 2 (SARS-CoV-2) variants and efficacy are still a significant concern [Citation3–6]. Hence the early and quick diagnosis is undoubted essential [Citation7,Citation8]. Primarily, reverse transcriptase quantitative polymerase chain reaction (RT-qPCR) and chest computed tomography (chest-CT) were considered the powerful diagnostics for SARS-CoV-2 identification, and a combination of both tests is recommended [Citation9–11]. However, RT-qPCR is accepted as the gold standard for detecting SARS-CoV-2 in COVID-19 suspected cases.
Several underdeveloped or developing countries are at a disadvantage due to the lack of quality laboratory setup, proper sample handling tools, safety equipment such as personal protective equipment (PPE) and well-trained laboratory personnel [Citation12–14]. Furthermore, the high-cost RT-qPCR test is in contention of being an economic burden for the low or mid-income population [Citation15,Citation16]. Besides, a moderate-to-high rate of false-negative results and recent claims about false-positive results of SARS-CoV-2 RT-qPCR created unintended complications in diagnosing the disease [Citation17,Citation18].
Understanding the circumstance, the World Health Organization (WHO) has consented to implement antigen detecting rapid diagnostic tests (Ag-RDTs) for the rapid diagnosis of case clusters and widespread community transmission [Citation19]. However, scientists are struggling to develop a rapid antigen test kit with high sensitivity and specificity [Citation14,Citation20]. So far, the US Food and Drug Administration (FDA) has approved a few rapid antigen tests based on lateral flow immunofluorescent sandwich assay, magnetic force-assisted electrochemical sandwich immunoassay (MESIA) assay, visually readable lateral flow assay, microfluidic immunofluorescence assay, and chromatographic digital immunoassay [Citation11,Citation21]. However, to our knowledge, no SARS-CoV-2 antigen enzyme-linked immunosorbent assay (ELISA) system has been recorded in the literatures to diagnose COVID-19. Nevertheless, to fulfill the requirement of a considerable number of tests daily, more cost-effective, high-throughput, and rapid antigen kits with simple test mechanisms and higher sensitivity and specificity are necessary.
We developed an in-house rapid ELISA method-based SARS-CoV-2 antigen detection tool and evaluated more than three hundred clinical specimens (RT-qPCR examined positive and negative) categorizing into different ranges of cycle threshold (Ct) value (i.e. ≤40, ≤35, and ≤30) and storage conditions (i.e. −80°C, −20°C and 4°C followed by −80°C) after preserving up to 30 days. We found a strong association of assay performance with viral load and storage condition with our tested samples.
2. Method and materials
2.1. Reagents
Two different types of SARS-CoV-2 nucleocapsid (NCP)-specific monoclonal antibodies (MAb), mouse Mab (MMAb), and rabbit Mab (RMAb), and horseradish peroxidase (HRP) conjugated anti-rabbit secondary antibody was purchased from SinoBiological, China. However, chemicals used such as 3,3′,5,5′-Tetramethylbenzidine (TMB) (Dojindo Molecular Technologies, USA), peroxidase substrate (Wako, Japan), and H2SO4 (Sigma-Aldrich, Germany) were of reagent grade. A semi-auto microplate ELISA reader (Thermo-Fisher Scientific, USA) was used to obtain the final optical density (OD) value at 450 nm.
2.2. Clinical specimen
Naso-oropharyngeal samples were collected in viral transport medium (VTM) for the real-time RT-qPCR test followed by our antigen ELISA test. Samples were obtained from Enam Medical College and Hospital, Gonoshasthaya Samaj Vittik Medical College, situated in Savar, Dhaka, and Gonoshasthaya RNA Molecular Diagnostic and Research Center Dhaka Metropolitan Area. Specimens were handled carefully with complete protection and processed in a biosafety level 2 cabinet (Airstream, Esco Class II Biological Safety Cabinet, Singapore).
2.3. SARS-CoV-2 detection using RT-qPCR
Primarily molecular test (RT-qPCR) was operated as the ‘gold standard’ to confirm SARS-CoV-2 positive/negative cases using samples within 1–3 hours after collection. Total RNA was collected from samples using the FavorPrep Viral Nucleic Acid Extraction Kit (Favorgen Biotech, Taiwan), using the manufacturer’s protocol. Later, one-step RT-qPCR was carried out using GoTaq 1-Step RT-qPCR System (Promega, USA) and Novel Coronavirus (2019-nCoV) Nucleic Acid Diagnostic Kit (Sansure Biotech). For the former RT-qPCR system, CDC 2019-nCoV Real-Time RT-qPCR primers, i.e. SARS-CoV-2 specific N1, N2 target genes, and Human RNase P gene, while for the latter SARS-CoV-2 typical N and ORF1ab target genes and Human RNase P genes were used. The CFX-96 real-time thermal cycler (Bio-Rad Laboratories, Inc., Hercules, CA, USA) was used for nucleic acid amplification. For GoTaq 1-Step RT-qPCR System, the RT-PCR thermal cycling initiated with reverse transcription at 50°C for 30 minutes followed by hot-start activation at 95°C for 2 minutes, 45 cycles of denaturation at 95°C for 15 seconds, and annealing/extension at 55°C for 30 seconds, with signal acquisition during the annealing/extension stage of cycling. A similar protocol with slight variation (cDNA pre-denaturation at 95°C for 1 minute and annealing/extension at 60°C) was maintained for Novel Coronavirus (2019-nCoV) Nucleic Acid Diagnostic Kit.
2.4. Sample preservation
After the RT-qPCR test, an adequate amount of remaining samples in the VTM were stored, including negative and positive samples at −80°C, −20°C, and 4°C for up to 30 days. The samples stored primarily at 4°C for 1 week were transferred to −80°C and kept there until the 30 days’ preservation period. These samples were designated as ‘4°C followed by −80°C.’ After 30 days of preservation in different conditions, samples were analyzed using this rapid in-house antigen ELISA system.
2.5. Assay plate preparation
Immunoplate 96-well flat-bottom plate (Extra Gene, USA) was coated with different dilution (1:50, 1:100, and 1:200) 100 µL/well of mouse SARS-CoV-2 NCP specific monoclonal antibody using coating buffer (sodium bicarbonate, pH >9) and incubated either overnight at 4°C or 37°C for an hour following our previously established ELISA methods [Citation22,Citation23]. The unbound antibody was then decanted, and nonspecific interaction was blocked using blocking buffer (150 µl/well; phosphate buffer saline (PBS), 0.1% Tween-20, 2% bovine serum antigen (BSA)), which was then incubated at 37°C for an hour. Wells were washed with 1x wash buffer (50 mm Tris, 0.05% Tween 20, 0.1% SDS, 0.8% NaCl, distilled water) and prepared for the assay procedure.
2.6. Standardization and LOD determination
The ELISA procedure was standardized by checkerboard analysis using various concentrations of capture MMAb (1:50–1:200), detection RMA (1:500–1:1000), and secondary antibody (1:1000–2000). Primarily, the SARS-CoV-2 NCP protein (Sino Biological, China) was used in different concentrations (1:50–1:400) for standardization and limit of detection (LOD) optimization.
Moreover, we determined the plausible cross-reaction between capture antibody (1:12.5–100) and secondary antibody (1:1000–2000) using different concentrations, maintaining the detection antibody concentrations as same (1:500–1000) with no added NCP protein/sample in the well. The selection of different concentrations for checkerboard analysis and the incubation period was determined based on our previously developed rapid ELISA method for the determination of SARS-CoV-2 anti-NCP IgG/IgM/IgA, anti-receptor binding domain (RBD) IgG/IgM/IgA, anti-spike-1 (S1) IgG/IgM/IgA, and anti-whole spike (S1+ S2) IgG/IgM/IgA in human serum [Citation22,Citation23].
2.7. Standardization using sample
After standardization using NCP, we used one confirmed (symptomatic patient and RT-qPCR positive) positive sample and an RT-qPCR negative sample with no symptoms to verify our protocol further. Each step was tested in triplicate, otherwise mentioned.
2.8. Evaluation using clinical specimens
The stored RT-qPCR samples, both positive (n = 147) and negative (n = 192), were examined using the optimized condition of this rapid in-house ELISA system and the determined sensitivity and specificity.
2.9. Assay procedure
Naso-oropharyngeal samples were added to each well at 1:4 dilutions in diluent buffer (PBS, 0.1% Tween 20, 1% Bovine Serum Albumin) and incubated at 37°C for 15 minutes. Each plate contains positive (n = 1), negative (n = 3), and plate controls with no added sample (n = 2), including other tested samples. The wells were washed five times afterward with ELISA wash buffer followed by the addition of RMAb and incubated at 37°C for 10 minutes. Five times wash after incubation, HRP-conjugated specific anti-rabbit monoclonal antibody was added and further incubated (37°C) for 5 minutes. After incubation, subsequent wash (5 times) was done, followed by the addition of tetramethylbenzidine (TMB) (100 μl), and the plate was kept until 5 minutes at room temperature for the color development in a dark place. Adding 100 μl of 1.5 M Sulfuric Acid (H2SO4), the reaction was stopped, and the OD was measured at 450 nm.
2.10. Estimation of cutoff value
The cutoff value was estimated with the negative samples previously tested negative in RT-qPCR and collected from healthy individuals. The mean OD value of the negative controls (n = 3) was determined as the cutoff value. Sample crossed the cutoff OD value at 450 nm was considered as positive. For a sample to be negative, the value should be equal to or less than the Cutoff OD.
2.11. Statistical analysis
Sensitivity, specificity, positive predictive value (PPV), and negative predictive value (NPV) with 95% confidence interval (95% CI) of this ELISA assay were determined to investigate its performance. Analyses were performed with STATA 13 (StataCorp, LP, College Station, Texas, USA), and GraphPad Prism 7.05 was used for graphical presentation.
2.12. Ethical approval
This study was approved by the National Research Ethics Committee (NREC) of Bangladesh [Reference No.: BMRC/NREC/2019-2022/1042]. Human participants in this study were enrolled, maintaining the NREC’s ethical standards and the 1964 Helsinki Declaration. The participants consented to their participation through consent forms and willingly provided their samples for the study.
3. Results
3.1. Sample characterization
A total of 339 specimens were primarily examined with RT-qPCR. As a result, both the positive (n = 147) with different ranges of Ct values (<30, <35, and <40) and negative (n = 192) samples were determined. All the remaining RT-qPCR examined samples stored (n = 339, stored up to 30 days, at −80°C (n = 192), −20°C (n = 31), and 4°C followed by −80°C (n = 116)) in VTM for further analysis with our rapid in-house antigen ELISA system.
3.2. Protocol establishment
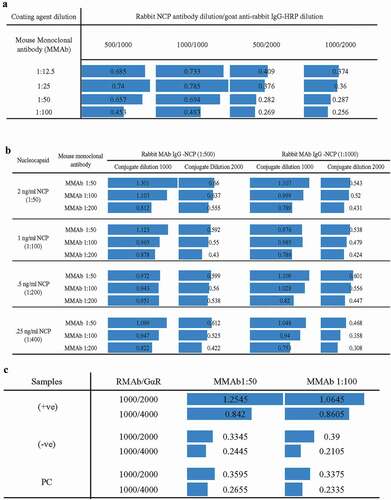
The checkerboard analyses were done in three repetitions using different conditions to establish the protocol. After the primary checkerboard, analyses were carried out to check the cross-reactivity among MMAb, RMAb, and secondary antibodies ()). We found that 1:100 dilution of MMAb, 1:1000 dilution of RMAb, and 1:2000 dilution of secondary goat anti-rabbit HRP tagged antibody provided the lowest optimum cross-reaction. Later, commercial SARS-CoV-2 NCP was employed to validate the assay principle. Different concentrations of recombinant NCP (0.25, 0.5, 1.0, 2.0 ng/ml) were challenged, where the assay successfully detected NCP proteins even at 0.25 ng/ml level ()). Later, we tested our assay with RT-qPCR positive and negative samples, and like the NCP challenge test, our assay successfully differentiated the positive and negative samples ()). Interestingly, the cross-reaction was much lower when the secondary antibody concentration was 1:4000, and hence, we selected this condition for the in-house antigen ELISA system.
Figure 1. Checkerboard analysis for the development of the assay method. Each bar represents OD values. (a)The higher bar represents higher detection cross-reaction among test components. (b) Different concentrations of recombinant nucleocapsid (NCP) antigen challenge in various tests conditioned to determine the limit of detection. (c) Positive and negative sample challenge test to validate the method. Upon observing the cross-reaction values, the optimum condition was found with 1:100 dilution for monoclonal mouse anti-nucleocapsid antibody (MMAb), 1: 1000 dilution for monoclonal rabbit anti-nucleocapsid antibody (RMAb), and 1:4000 dilution for goat anti-rabbit secondary HRP conjugated antibody (G?R).
3.3. Clinical evaluation
We observed and collected data on the working of our ELISA system in various conditions based on sample preservation (stored in −80°C, −20°C, and 4°C followed by −80°C) and Ct value (i.e. ≤30, ≤35, and ≤40). After examining all the stored samples in our in-house rapid SARS-CoV-2 antigen ELISA system, the specificity and sensitivity of the system, including the entire preserved positive (Ct ≤40, n = 147) and negative (n = 192) samples, were determined as 61.9% and 99.0%, respectively (). Categorizing the samples according to the preserving conditions, higher sensitivity (70.7%) was achieved for the samples stored directly at −80°C as compared to the sensitivity of samples stored at −20°C (44.4%) and 4°C followed by −80°C (54.0%) (, ). Interestingly, average Ct values for samples stored at −80°C, −20°C, and 4°C followed by −80°C were 34.05 ± 4.84, 32.70 ± 3.92, and 26.40 ± 4.40, respectively, indicating that samples stored in −80°C can not only detect COVID-19 in the acute phase but recovered phase also ().
Figure 2. Determination of the OD/Cut off ratio of all samples (n = 339) using the standardized ELISA assay.
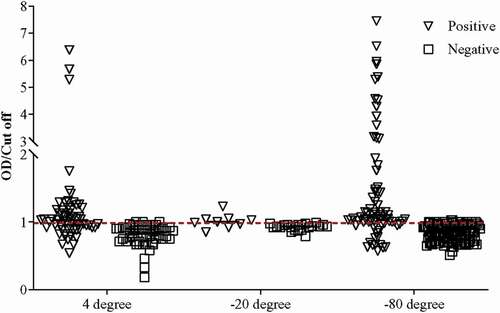
Table 1. The variation of sensitivity and specificity of the in-house antigen ELISA system depending on Ct value and storage condition as compared to RT-qPCR result (n = 339)
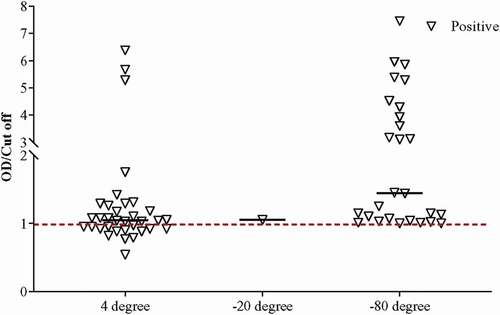
Similar observation with better sensitivity was found when positive stored samples with Ct value ≤35 were evaluated. In that case, the sensitivity for the samples stored at −80°C increased to 89.6%. Similarly, the sensitivity for samples stored at −20°C (60.0%) and 4°C followed by −80°C (54.8%) also increased (, ). The pattern of sensitivity was similar in positive samples with Ct ≤30. Interestingly, our in-house ELISA system demonstrated the highest sensitivity (92.9%) for −80°C preserved positive samples (, ). The sensitivity for samples stored at 4°C followed by −80°C was found 61.1%, which was better than the other two categories of Ct value (i.e. ≤35 and ≤40) for that particular preserving condition. Although the sensitivity at −20°C was found to be 100%, we do not consider that as only one positive sample remained at −20°C after Ct >30 exclusion.
Figure 3. Detection of positives samples having Ct less than 35 and stored in various conditions using the ELISA.
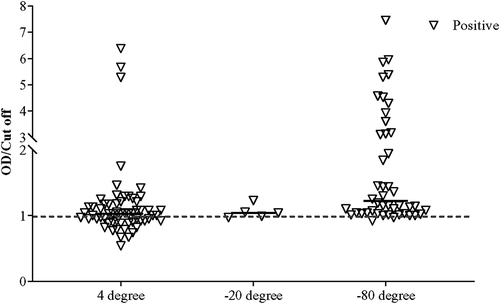
Figure 4. Detection of positives samples having Ct less than 30 and stored in various conditions using the ELISA.
4. Discussion
To date, molecular tests, essentially RT-qPCR, are regarded as the standard for SARS-CoV-2 detection. However, in a meta-analysis published by Kim et al., the sensitivity of RT-qPCR was investigated to be 89% (PPV ranged from 47.3% to 96.4%, NPV ranged from 96.8% to 99.9%). In that same study, the pooled sensitivity of chest CT was found even higher as compared to RT-qPCR (94% (95% CI: 91%, 96%)), although for low prevalence regions, chest CT would not be suitable because of the higher rate of a false-positive result [Citation11,Citation24]. Besides, these complex processes perhaps would not meet the urgency of quick and early diagnosis of vast amounts of suspected cases. Hence it necessitates the essentiality of a rapid antigen detection kit [Citation11,Citation12,Citation14]. A few antigen kits have been developed recently to detect the SARS-CoV-2 [Citation25–29]. However, no ELISA technique has been published for antigen assessment of SARS-CoV-2 to date.
Among the available SARS-CoV-2 antigen kits, Cerutti et al. evaluated the performance of STANDARD Q COVID-19 Ag by SD Biosensor, which presented 70.6% sensitivity where they could detect only one positive sample with Ct value <37 and one sample with Ct value = 35. The rest of the samples detected to be positive had Ct values <35. However, only 7% of the total sample used was stored at −20°C [Citation30]. Fenollar et al. assessed Panbio Covid-19 rapid antigen detection test device, where they found higher sensitivity (75.4%) in positive samples (Ct <35), but the device struggled to maintain specificity (94.8%) using freshly collected samples [Citation25]. In contrast, Torres et al. also evaluated the same device immediately after specimen collection and found lower sensitivity (48.1%) but higher specificity (100%) [Citation26]. COVID-19 Ag Respi-Strip was evaluated by Scohy et al., where they determined a lower sensitivity (30.1%), although the specificity was 100%. However, they did acknowledge that unless the test was done immediately for a sample, they would preserve it at 4°C [Citation27]. Interestingly, this association of sample preservation in 4°C with lower sensitivity does correlate with our observations. Furthermore, SARS-CoV-2 NADAL® COVID-19 Ag displayed 64.2% sensitivity only when the Ct values of the positive samples were ≤30 [Citation28]. Besides, according to Kohmer et al., an FDA-approved antigen detection kit also demonstrated 50% sensitivity when the Ct value of positive samples ranged between 22.13 and 36.46 [Citation29].
In our in-house rapid antigen ELISA system, considering all the preserving conditions, we obtained higher sensitivity (69.6%) when the Ct value of positive samples was ≤35 compared to the sensitivity (61.9%) we perceived for positive samples Ct value up to 40 (; ). Following the same pattern of the inverse relation of Ct value and sensitivity, the highest sensitivity (75.4%) was achieved for samples with Ct value ≤30 (, ). Ct value of RT-qPCR has an inverse correlation with viral load [Citation31]. It is our understanding that most of the commercially available antigen kits could detect valid positive samples when the Ct value is less than 35 and detects better when the Ct value is even lower (e.g. Ct <25) [Citation28,Citation30]. Hence, these observations correlate with the result of our antigen ELISA system (). Usually, the viral load is higher in the acute phase of infection [Citation32]. Therefore, earlier diagnosis just after the symptom onset or acute phase of the disease is better for the exact result, especially in the antigen-based detection system.
Table 2. Comparison of performances of reported rapid antigen kits with this ELISA system, including different test conditions
Proteasomal degradation of viral NCP has been previously observed in host cells [Citation33]. Using our in-house ELISA system, we observed that the false-negative ratio of RT-qPCR positive samples (Ct <35) stored at 4°C followed by −80°C (34/62) was much higher when compared to samples stored at −80°C (43/48) and −20°C (3/5) indicating the possibility of proteasomal degradation of viral NCP during storage especially in a higher preserving temperature (). However, due to the sample storage time and temperature variation for each sample, we could not determine the relation between sample storage time and our assay’s sensitivity. Nevertheless, our in-house ELISA system achieved 99.0% specificity for overall samples. We assume the plausibility of false-negative results in RT-qPCR for the negative samples in our antigen ELISA system.
To conclude, our observation displays a significant correlation between Ct value and preserving temperature with the diagnosis of SARS-CoV-2 antigen by ELISA method. Both present an inverse correlation between sample quality during preservation and the sensitivity of the system. Moreover, our antigen ELISA system demonstrated a significant performance that can be commercialized as a cost-effective and rapid diagnostic tool for SARS-CoV-2 detection compared to NAAT-based methods (~8 times lower) and would verify higher accuracy than currently available quick antigen kits.
4.1. Limitation of the study
We concede the dissimilarities in the number of samples stored as a limitation of this study. We further acknowledge the limitation of not re-confirming the assumption of the false-negative result that slightly reduced the specificity of this antigen ELISA system to 99%. Moreover, sample storage time varied among each sample before final testing. Henceforth, we could not determine the storage time effect on the outcome of the assay. Moreover, unavailability of the BSL-3 facility and limitation of the fund, the LOD of the assay could not be determined by inactivated SARS-CoV-2 virus and cross-reactivity with other respiratory pathogens.
4.2. Recommendations
Antigen test for COVID-19 detection is generally suggested for screening purposes and is not preferred, while RT-qPCR setup is available. Nevertheless, due to the surge of newer SARS-CoV-2 variants, unavailability of RT-qPCR facility, scarcity of reagents, consumables, and trained human resources, it is suggested to screen the symptomatic patients with an antigen test [Citation6,Citation34–36]. If positive results are found in kits having high specificity, the result can be trusted. Nevertheless, if symptomatic patients are given negative consequences, a retest should be performed, or a sample should be sent for RT-qPCR testing. Likewise, asymptomatic patients should not be assessed with an antigen test. Moreover, antigen tests should be carried out in the BSL-2 facility or under the biosafety cabinet using proper PPE, as infectious samples are handled during testing. High-throughput antigen testing, such as ELISA, should be implemented for screening while reducing the burden on molecular testing.
Article highlights
This rapid in-house antigen ELISA is based on nucleocapsid detection. Thus, sensitivity should not be affected by different circulating variants, unless mutation occurs in the nucleocapsid epitope regions.
The overall incubation time is only 30 minutes. Thus, rapid screening of suspected samples is possible but would require a BSL-2 facility like an RT-qPCR test.
For assay evaluation, clinical specimens have been evaluated and confirmed positive/negative with RT-qPCR before examining the ELISA system.
The correlation of different Ct values and sample preserving conditions with antigen detection performance of the ELISA system has been evaluated.
Ct values lower than 30 gave the highest sensitivity among the tested sample.
Samples stored at −80°C for up to 30 days compared to other conditions also improved the test’s sensitivity.
Declaration of interest
The authors have no relevant affiliations or financial involvement with any organization or entity with a financial interest in or financial conflict with the subject matter or materials discussed in the manuscript. This includes employment, consultancies, honoraria, stock ownership or options, expert testimony, grants or patents received or pending, or royalties.
Author contributions
All authors made a significant contribution to the work reported, whether that is in the conception, study design, execution, acquisition of data, analysis, and interpretation, or in all these areas; took part in drafting, revising, or critically reviewing the article; gave final approval of the version to be published; have agreed on the journal to which the article has been submitted, and decided to be accountable for all aspects of the work.
Consent for publication
All authors reviewed and approved the final version and have agreed to be accountable for all aspects of the work, including any issues related to accuracy or integrity.
Acknowledgments
The authors are grateful to the participants who participated in the study and provided their specimens.
Additional information
Funding
References
- Worldometer. COVID-19 CORONAVIRUS PANDEMIC Worldometer. 2021. [Accessed July 7-2021]. Available from: https://www.worldometers.info/coronavirus/
- Felsenstein S, Herbert JA, McNamara PS, et al. COVID-19: immunology and treatment options. Clin Immunol. 2020;215:108448.
- Mills MC, Salisbury D. The challenges of distributing COVID-19 vaccinations. EClinicalMedicine. 2021;31:100674.
- Grauer J, Löwen H, Liebchen B. Strategic spatiotemporal vaccine distribution increases the survival rate in an infectious disease like Covid-19. Sci Rep. 2020;10(1):21594.
- Kim JH, Marks F, Clemens JD. Looking beyond COVID-19 vaccine phase 3 trials. Nat Med. 2021;27(2):205–211.
- Adnan N, Khondoker MU, Rahman MS, et al. Coding-complete genome sequences and mutation profiles of nine SARS-CoV-2 strains detected from COVID-19 patients in Bangladesh. Microbiol Resour Announc. 2021;10(10):e00124–21.
- Peck KR. Early diagnosis and rapid isolation: response to COVID-19 outbreak in Korea. Clin Microbiol Infect. 2020;26(7):805–807.
- Mei X, Lee H-C, Diao K-Y, et al. Artificial intelligence–enabled rapid diagnosis of patients with COVID-19. Nat Med. 2020;26(8):1224–1228.
- Ai T, Yang Z, Hou H, et al. Correlation of chest CT and RT-PCR testing for coronavirus disease 2019 (COVID-19) in China: a report of 1014 cases. Radiology. 2020;296(2):E32–E40.
- Xie X, Zhong Z, Zhao W, et al. Chest CT for typical coronavirus disease 2019 (COVID-19) pneumonia: relationship to negative RT-PCR testing. Radiology. 2020;296(2):E41–E45.
- Oishee MJ, Ali T, Jahan N, et al. COVID-19 pandemic: review of contemporary and forthcoming detection tools. Infect Drug Resist. 2021;14:1049–1082.
- Russo A, Minichini C, Starace M, et al. Current status of laboratory diagnosis for COVID-19: a narrative review. Infect Drug Resist. 2020;13:2657–2665.
- Wacharapluesadee S, Kaewpom T, Ampoot W, et al. Evaluating the efficiency of specimen pooling for PCR‐based detection of COVID‐19. J Med Virol. 2020;92(10):2193–2199.
- Dinnes J, Deeks JJ, Adriano A, et al. Rapid, point‐of‐care antigen and molecular‐based tests for diagnosis of SARS‐CoV‐2 infection. Cochrane Database Syst Rev. 2021;3(3):CD013705.
- Dorlass EG, Monteiro CO, Viana AO, et al. Lower cost alternatives for molecular diagnosis of COVID-19: conventional RT-PCR and SYBR green-based RT-qPCR. Braz J Microbiol. 2020;51(3):1117–1123.
- Reddy KP, Shebl FM, Foote JH, et al. Cost-effectiveness of public health strategies for COVID-19 epidemic control in South Africa: a microsimulation modelling study. Lancet Glob Health. 2021;9(2):e120–e129.
- Kucirka LM, Lauer SA, Laeyendecker O, et al. Variation in false-negative rate of reverse transcriptase polymerase chain reaction–based SARS-CoV-2 tests by time since exposure. Ann Intern Med. 2020;173(4):262–267.
- Surkova E, Nikolayevskyy V, Drobniewski F. False-positive COVID-19 results: hidden problems and costs. Lancet Respir Med. 2020;8(12):1167–1168.
- World Health Organization. Critical preparedness, readiness and response actions for COVID-19 WHO 2020. [Accessed June 30-2021]. Available from: https://apps.who.int/iris/bitstream/handle/10665/336373/WHO-COVID-19-Community_Actions-2020.5-eng.pdf
- Lin Q, Wen D, Wu J, et al. Microfluidic immunoassays for sensitive and simultaneous detection of IgG/IgM/antigen of SARS-CoV-2 within 15 min. Anal Chem. 2020;92(14):9454–9458.
- US Food and Drug Administration. In vitro diagnostics EUAs U.S. FDA2020. {Accessed June 30-2021}. Available from: https://www.fda.gov/medical-devices/coronavirus-disease-2019-covid-19-emergency-use-authorizations-medical-devices/vitro-diagnostics-euas#individual-antigen
- Sil BK, Jahan N, Haq MA, et al. Development and performance evaluation of a rapid in-house ELISA for retrospective serosurveillance of SARS-CoV-2. PLoS One. 2021;16(2):e0246346.
- Jamiruddin MR, Haq MA, Tomizawa K, et al. Longitudinal antibody dynamics against structural proteins of SARS-CoV-2 in three COVID-19 patients shows concurrent development of IgA, IgM, and IgG. J Inflamm Res. 2021;14:2497–2506.
- Kim H, Hong H, Yoon SH. Diagnostic performance of CT and reverse transcriptase polymerase chain reaction for coronavirus disease 2019: a meta-analysis. Radiology. 2020;296(3):E145–E155.
- Fenollar F, Bouam A, Ballouche M, et al. Evaluation of the Panbio Covid-19 rapid antigen detection test device for the screening of patients with Covid-19. J Clin Microbiol. 2021;59(2):e02589–20.
- Torres I, Poujois S, Albert E, et al. Evaluation of a rapid antigen test (Panbio™ COVID-19 Ag rapid test device) for SARS-CoV-2 detection in asymptomatic close contacts of COVID-19 patients. Clin Microbiol Infect. 2021;27(4):636.e1–636.e4.
- Scohy A, Anantharajah A, Bodéus M, et al. Low performance of rapid antigen detection test as frontline testing for COVID-19 diagnosis. J Clin Virol. 2020;129:104455.
- Strömer A, Rose R, Schäfer M, et al. Performance of a point-of-care test for the rapid detection of SARS-CoV-2 antigen. Microorganisms. 2020;9(1):58.
- Kohmer N, Toptan T, Pallas C, et al. The comparative clinical performance of four SARS-CoV-2 rapid antigen tests and their correlation to infectivity in vitro. J Clin Med. 2021;10(2):328.
- Cerutti F, Burdino E, Milia MG, et al. Urgent need of rapid tests for SARS CoV-2 antigen detection: evaluation of the SD-biosensor antigen test for SARS-CoV-2. J Clin Virol. 2020;132:104654.
- Tom MR, Mina MJ. To interpret the SARS-CoV-2 test, consider the cycle threshold value. Clin Infect Dis. 2020;71(16):2252–2254.
- Argyropoulos KV, Serrano A, Hu J, et al. Association of initial viral load in severe acute respiratory syndrome coronavirus 2 (SARS-CoV-2) patients with outcome and symptoms. Am J Pathol. 2020;190(9):1881–1887.
- Antón LC, Schubert U, Bacík I, et al. Intracellular localization of proteasomal degradation of a viral antigen. J Cell Biol. 1999;146(1):113–124.
- Yang W, Shaman J. COVID-19 pandemic dynamics in India and impact of the SARS-CoV-2 Delta (B. 1.617. 2) variant. medRxiv. 2021. 10.1101/2021.06.21.21259268
- Campbell F, Archer B, Laurenson-Schafer H, et al. Increased transmissibility and global spread of SARS-CoV-2 variants of concern as at June 2021. Euro Surveill. 2021;26(24):2100509.
- Jungnick S, Hobmaier B, Mautner L, et al. Detection of the new SARS-CoV-2 variants of concern B. 1.1. 7 and B. 1.351 in five SARS-CoV-2 rapid antigen tests (RATs), Germany, March 2021. Euro Surveill. 2021;26(16):2100413.