
ABSTRACT
Introduction: Numerous diseases are caused by changes in post-translational modifications (PTMs). Therefore, the number of clinical proteomics studies that include the analysis of PTMs is increasing. Combining complementary information—for example changes in protein abundance, PTM levels, with the genome and transcriptome (proteogenomics)—holds great promise for discovering important drivers and markers of disease, as variations in copy number, expression levels, or mutations without spatial/functional/isoform information is often insufficient or even misleading.
Areas covered: We discuss general considerations, requirements, pitfalls, and future perspectives in applying PTM-centric proteomics to clinical samples. This includes samples obtained from a human subject, for instance (i) bodily fluids such as plasma, urine, or cerebrospinal fluid, (ii) primary cells such as reproductive cells, blood cells, and (iii) tissue samples/biopsies.
Expert commentary: PTM-centric discovery proteomics can substantially contribute to the understanding of disease mechanisms by identifying signatures with potential diagnostic or even therapeutic relevance but may require coordinated efforts of interdisciplinary and eventually multi-national consortia, such as initiated in the cancer moonshot program. Additionally, robust and standardized mass spectrometry (MS) assays—particularly targeted MS, MALDI imaging, and immuno-MALDI—may be transferred to the clinic to improve patient stratification for precision medicine, and guide therapies.
1. PTMs and their role in health and disease
Cellular homeostasis is primarily maintained through adaptive changes of the proteome and metabolome. On the proteome level, this mainly involves changes in (i) protein abundance levels, for example through altered expression, degradation, or both, (ii) protein localization, (iii) protein–protein interactions, (iv) protein function, and (v) protein activity—all of which can be modulated by post-translational modifications (PTMs). PTM involves the attachment, removal, exchange, and rearrangement of functional groups to amino acid side chains and protein N-termini, but also the hydrolysis of peptide bonds (proteolysis). Indeed, PTMs are a most elegant, energetically efficient, and rapid strategy to modulate and maximize the functionality of a single gene product—depending on the type of PTM, this even can occur in a highly reversible manner, such as in case of phosphorylation or redox modifications. Hence, throughout all species, PTMs are important for regulating fundamental biochemical processes. This is reflected in both the high number of known PTMs (>400 reported in the Uniprot database, 326 in eukaryotes, 250 in bacteria, and 80 in archaea [Citation1]) but also in their prevalence. Every human protein has the potential to be post-translationally modified at least once during its life span. The fundamental role of PTMs as switches of cellular homeostasis therefore implies that they represent critical and sensitive nodes for pathogenesis, both as drivers and markers, and thus aberrant PTM patterns have been associated with numerous diseases.
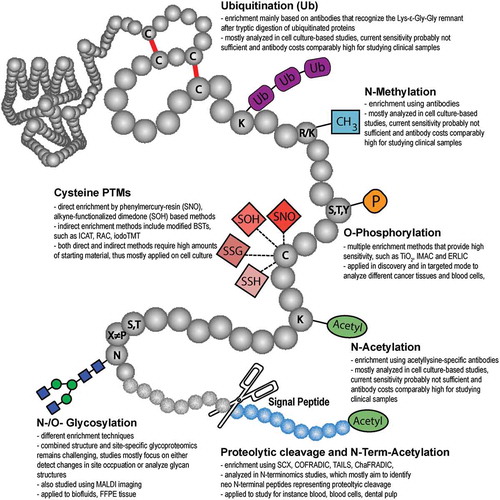
Mass spectrometry (MS) is an unrivaled tool for detecting and quantifying PTMs and their changes in a broad variety of samples, including purified proteins and protein complexes, organelles, cells, tissues, or biofluids. Consequently, more than 95% of current data on PTMs is derived from MS-based proteomic studies [Citation2] and—with the ongoing advances in instrumentation, methods, and bioinformatics—the number of known PTMs is likely to increase in the future [Citation3,4]. The largest and manually curated PTM database available, PhosphoSitePlus (www.phosphosite.org) contains more than 400,000 non-redundant PTMs on more than 20,000 proteins, mainly from human and mouse [Citation2] ().
Figure 1. Distribution of the >400,000 PTM sites reported at www.phosphosite.org, October 2017. Due to historical and technical reasons five PTMs—Ser/Thr/Tyr phosphorylation, ubiquitination, and acetylation—account for 92% of these modifications, but this may not necessarily mirror the biological relevance and abundance of individual PTMs.
Importantly, a protein sequence can have many different modifiable amino acids (), but not necessarily all will be modified at the same time point or within the same copy of that particular protein. Even for a specific residue, there can be a competition between different modifications, as shown, for example, for Lys acetylation and ubiquitination [Citation5], for different lipid modifications [Citation6], and also for O-phosphorylation and O-GlcNac [Citation7,Citation8]. For each modifiable amino acid, there is an equilibrium between the free and different modified versions within a biological system, which can be shifted to precisely drive cellular response in a specific direction. Particularly for p53, it has been demonstrated that function and activity depend on the complete PTM pattern rather individual PTMs, as they can synergistically modulate protein structure (PTM crosstalk and PTM code) [Citation9-Citation11]. Analyzing complete protein PTM patterns is a major challenge for MS, as currently PTM research is mainly restricted to the identification of peptides after proteolytic digestion (‘bottom-up’ proteomics) [Citation12]. Thus, information about the full modification state of individual protein molecules is typically lost and would require the analysis of intact proteins (‘top-down’ proteomics) which, unfortunately, might not be applicable to the analysis of PTMs from clinical samples in the near future, as discussed elsewhere [Citation12,Citation13]. In this review, we define ‘clinical samples’ as samples obtained from a human subject. This includes (i) bodily fluids such as serum, plasma, urine, nasal fluid, cerebrospinal fluid, etc., and stool; (ii) primary cells, including reproductive cells, blood cells such as erythrocytes, leukocytes, platelets, etc.; (iii) tissue samples/biopsies; whereas studies including (primary) cell culture, patient derived xenografts or cell lines, and animal models are not considered as ‘clinical’ in this review.
Figure 2. Frequently reported post-translational protein modifications (adapted from Pagel et al., Expert Rev Proteomics; 12(3):235-53; with permission).
Numerous diseases are driven by the dysregulation of the proteome, either due to changes in expression levels, changes in the primary sequence, and/or changes in PTMs. Non-synonymous single nucleotide polymorphisms (SNPs) can alter the activity or specificity of enzymes that attach/remove a certain PTM to proteins and thereby can change for example phosphorylation, glycosylation, or acetylation patterns in a pathway-specific or even proteome-wide manner. SNPs can also affect the range of substrates of these enzymes by altering consensus/targeting/recognition motifs on common substrates or by incorporating such motifs into novel (non-physiological) substrates. Both cases, mutations of enzymes and substrates, can have severe consequences for cellular homeostasis [Citation14,Citation15]. For many types of cancer, a dysregulation of kinases has been reported, which can, for example, lead to constitutive kinase activity and hyperactive signaling pathways [Citation16-Citation18]. SNPs can also induce mistargeting of proteins such as has been reported for the renal Fanconi syndrome, where the mutation E3K in EHHADH produces a de novo mitochondrial import sequence [Citation19,Citation20]. Upon mitochondrial import the mitochondrial targeting sequence is proteolytically removed and the truncated and mislocalized protein impairs energy production [Citation19,Citation20]. Differential antibody glycosylation has been associated with autoimmunity [Citation21], and murine cytomegalovirus has been reported to activate intracellular PTM-based signaling pathways through expression of the viral G protein-coupled receptor M33 [Citation22]. Owing to these fundamental roles of PTMs in health and disease, their analysis is important from two different aspects: First, to understand disease mechanisms on the molecular level. Second, in the context of precision medicine: To identify PTM signatures that can be correlated with disease (progression), and that may help to diagnose and stratify patients and to predict the effectiveness of a treatment and guide therapy.
In this review, we discuss general considerations, requirements, pitfalls, and future perspectives in applying PTM-centric proteomics to clinical samples—from experimental design to data analysis. We focus on four classes of PTMs: phosphorylation, glycosylation, proteolytic cleavage and oxidative Cysteine modifications and provide examples of relevant studies and methods.
2. Can PTMs be used as biomarkers?
Studying disease mechanisms has been mainly done with the help of models, such as cell culture and animal models. However, more and more, omics studies involve the analysis of clinical samples. For precision medicine, PTM signatures may either be identified in disease models and then validated in clinical samples or directly identified using clinical samples. Although, for example, specific changes in phosphorylation and glycosylation are increasingly reported as potential markers of disease, and many PTM assays have been developed so far (for instance reviewed in [Citation23-Citation25]), only few are really routinely used for diagnostic purposes to date, due to a variety of reasons [Citation26]. We are still in the early days of PTM-specific research and detection and many potential PTM biomarkers and the corresponding assays still need to be validated extensively. Consequently, most clinical assays are genomics-based or involve the use of antibodies, which are mainly available for proteins rather than for specific PTMs. For instance, the expert curated Cancer Biomarkers database (https://www.cancergenomeinterpreter.org/biomarkers) reports around 200 different genes as potential cancer biomarkers, ~50 of those as approved. Still, whether pre-clinical, from case reports and early trials, or approved, virtually all of them are either point mutations, gene amplifications, or expression changes, whereas no specific PTM markers are listed. Nevertheless, some PTM-specific assays are currently used. Glycated hemoglobin (HbA1c) is formed non-enzymatically upon contact with plasma glucose and is increased in diabetes [Citation27]. Whereas diabetes can be diagnosed by measuring fasting glucose, HbA1c has several advantages such as higher repeatability [Citation28]. HbA1c can also be measured in the non-fasting state, and elevated levels may be a risk factor for macrovascular disease [Citation28]. The phosphorylation levels of vasodilator stimulated phosphoprotein (VASP) are measured as indicator of P2Y12 receptor inhibition during antiplatelet treatment [Citation29]. Different glycan structures on the surface of red blood cells define the blood type. Besides that, there is huge list of potential biomarkers reported in the literature, though their diagnostic or predictive value remains to be proven in many cases (see supplemental table 1).
Considering the complexity of human health and disease, in many cases a single molecule (e.g. a single gene, protein, glycan or phosphorylation site) may be insufficient as specific biomarker for diagnosis and for predicting effective treatment. Recent studies indicate, that combining multiple ‘omics’ levels such as (i) the analysis of protein expression and PTMs, (ii) proteomics, metabolomics and lipidomics, or (iii) proteogenomics integrating genomics, transcriptomics and proteomics data is beneficial for identifying specific disease patterns and signatures. Particularly in cancer, it has emerged that information from next-generation sequencing or RNAseq alone is not sufficient to understand the mechanisms underlying the development of resistance in certain tumors [Citation30], such that additional data on protein expression and PTM levels is needed. Thus, mutations in the receptor tyrosine kinase epidermal growth factor receptor (EGFR) are apparent in many cancer types and lead to aberrant phosphorylation signaling. EGFR mutations are often used to select treatment with specific EGFR inhibitors for non-small cell lung cancer. Response rates, however, are still too low (40-80%) while concurrently 10-15% of patients without mutation do respond [Citation31]. Obtaining data on protein phosphorylation levels for downstream targets of the EGFR signaling pathway might complement the non-conclusive genomics data. Indeed, in a recent study by the Clinical Proteomic Tumor Analysis Consortium (CPTAC), only integration and clustering of DNA, RNA, protein, and protein phosphorylation profiles allowed distinguishing subtypes in 77 breast cancer tumors [Citation32].
3. General considerations for sampling, sample preparation and data analysis
When conducting PTM (and also global) proteome analyses on clinical samples, several important aspects have to be considered. While bodily fluids (such as blood, urine, or tear fluid) are usually available in high amounts and (almost) non-invasively, tissue samples are often limited in amount and/or are often formalin-fixed and paraffin-embedded (FFPE). For biopsies, most of the sample is often needed for histological purposes, or is stored in dedicated biobanks. Consequently, the amounts that remain for proteomic analyses are often strictly limited (low to medium µg-range of protein) and downstream compatibility with sensitive proteomics workflows can be poor.
Another key challenge when analyzing PTMs from clinical samples is heterogeneity, which may have a multitude of preanalytical sources that are usually not relevant or less relevant for cell culture experiments and are only partially relevant for animal models [Citation33]. First, even for healthy control groups, biological variation between individuals can be substantial. This is due not only to generally occurring genetic variations, but, more importantly can be due to considerable differences in life style, diet, environment, and age, as well as between genders. While it may already be challenging to clearly state what defines a ‘healthy’ control, the variation across patient cohorts can be substantially higher, and often patients present with multiple diseases. Particularly for cancer, during the past decade we have learned that even for specific subtypes of cancer such as breast cancer, tumors are individual and may require specific, personalized, treatment [Citation34]. Therefore, a thorough and clear subtyping of patient cohorts is as important as maintaining a sufficiently high number of individuals for both patient and matching (age, gender, etc.) control groups [Citation35].
Another major source of variation lies in the sampling procedure [Citation36-Citation38]. Clinical samples have to be collected and stored over time. While here the need for well-defined standard operating procedures (SOPs) that define how, when, and under exactly which conditions samples should be taken, is well-accepted, their implementation into daily clinical practice is often not straightforward. This could be due not only to different personnel being involved in the sampling and the inevitable daily stress in clinical environments, but also due to underestimating how small variations in SOPs, such as changing incubation times by only a few minutes or buffers by a few µL, different lengths of time between sampling and freezing, etc., can severely affect the proteome and—particularly—PTM signaling pathways. Therefore, a close collaboration between clinicians and analytical scientists is mandatory to jointly (i) design realistic and robust SOPs [Citation39-Citation44] and (ii) (ideally) to monitor their correct implementation, particularly in the beginning of a project but also throughout its progress. Because minor deviations from the agreed-upon sampling SOPs cannot be completely excluded, it is also important to track and document these thoroughly [Citation45] so that later inconsistent results may be correlated with such changes. An important issue, in the case of tissue, is how the samples are provided. Fresh-frozen tissue might be preferable, but often clinical specimen are provided as FFPE samples. Although sample preparation protocols for FFPE tissues have been published [Citation46-Citation48], this type of sample preparation considerably complicates the entire analysis, and may reduce both sensitivity and reproducibility. It should be kept in mind that fixation processes can potentially alter labile PTM signatures, such as phosphorylation, if not proteome-wide at least for certain pathways that quickly respond to cell stress.
Finally, variation can be introduced during the actual proteomic sample preparation and LC-MS analysis. Therefore, here also it is mandatory to strictly follow well-designed SOPs detailing all individual steps, from lysis to sample analysis [Citation49-Citation51], including quality control of proteolytic digestion prior to LC-MS analysis [Citation52], as well as controls for labeling efficiency in case chemical stable isotope labeling (SIL) is used [Citation53,Citation54]. Lysis and homogenization should be harsh and fast to preserve the biological state of the sample and avoid artificial changes, particularly of fast and reversible PTMs. Tissues should be kept on ice and ideally, inhibitors should be used where applicable (e.g. phosphatase inhibitor cocktails for phosphoproteomics), including the use of protease inhibitors (particularly when analyzing proteolytic cleavage). Protein digestion should be controlled prior to extensive analytical workflows, as unreproducible and inefficient digestion can substantially affect and ruin sample analysis, including strong variation between samples and artificial fold-changes. Digestion can be controlled in multiple ways that differ in precision, effort, and sensitivity [Citation52]. Gel electrophoresis of samples pre- and post-digestion does not require special equipment but is rather slow, cannot be automated and poor resolution in the low MW range and comparably poor sensitivity do not allow to reliably evaluate the reproducibility of individual digests. MALDI MS spectra can be used for a quick and very sensitive overall pattern comparison using only small aliquots of the digested samples, but due to the huge sample complexity may lack the sensitivity to detect differences apart from major components that are easy to digest. Monolithic HPLC columns require a dedicated HPLC system, ideally with nL/µL UV detector, but are fast, sensitive, automated, and robust. Complete UV traces allow a reliable assessment of digest efficiency and reproducibility [Citation52]. Finally, digested (but not pre-digest) samples can be analyzed by short LC-MS gradients, preferably using not the newest instrument generations in the laboratory, to assess the overall reproducibility. However, samples with poor digest efficiency may ruin the column or contaminate the HPLC. LC-MS instruments have to be well-maintained, including regular cleaning, calibration, and (ideally) the analysis of a daily quality-control analysis of well-designed samples [Citation55]. For this purpose, specifically designed peptide mixtures [Citation44,Citation50,Citation56] and software tools [Citation57-Citation60] allow monitoring the reproducibility of retention times, intensities, sensitivity, and mass deviation with and without background.
For clinical samples, data analysis is substantially more challenging than for common proteome analyses, as it requires the analysis of larger sample cohorts as well as more sophisticated data analysis and statistical approaches. Analyzing a large number of samples, however, leads to an additional challenge: missing values [Citation61-Citation63], in both label-free and label-based quantitation approaches. Thus, even for technical replicates analyzed consecutively under highly reproducible conditions, the overlap of confidently identified and even more so quantified peptides and proteins is usually far below 100% in discovery experiments. Generally, when analyzing large cohorts, one should (i) only place samples on the autosampler immediately prior to injection, (ii) run daily quality control samples, (iii) analyze samples in randomized order, to avoid systematic biases derived from changing instrument performance, and (iv) use SIL peptides for precise quantitation for all steps following discovery.
4. From discovery to validation: sample analysis by quantitative MS
For clinical samples, three different kinds of analysis platforms have to be considered. First, discovery would rely on non-targeted methods that provide high sensitivity and coverage (in-depth analysis), but which do not necessarily provide high throughput. Here the goal is to identify potential biomarker panels or targets from a manageable number of representative samples. This is mainly achieved through relative quantitation, where fold-changes between samples are detected, however without knowing analyte concentrations or amounts. Second, there is validation with larger cohorts focusing on a limited number of candidate proteins/peptides, usually applying targeted MS techniques [Citation64,Citation65] such as multiple reaction monitoring (MRM) [Citation66,Citation67] or parallel reaction monitoring (PRM) [Citation68], and usually employing absolute quantitation where the concentration or amount of an analyte in a sample is precisely determined using a specific internal standard (discussed more in detail in the following chapter). This not only allows obtaining more reliable fold-changes, but in case of PTMs enables determining site occupancy, for example which share of EGFR molecules in a cell is phosphorylated at a specific position. This information may be more biologically relevant then mere fold-changes usually obtained in MS-based proteomics. Third, there is translation to the clinic. Here, sensitivity is still an issue, but robustness, throughput, and precise quantitation of a limited number of candidates are even more important, so that absolute quantification is essential.
As aforementioned, there is usually an equilibrium—in the case of reversible PTMs often very dynamic—between modified and non-modified states of amino acid residues and proteins, which can be shifted in order to induce certain biochemical effects. For instance, for the best-studied signaling PTM, phosphorylation, there might be only minor qualitative changes (i.e. presence of phosphorylation sites) between control and stimulated or diseased conditions, whereas quantitative differences (i.e. degree of phosphorylation) can be vast. It is therefore unlikely that a specific phosphorylation site can be solely detected under a specific disease state and therefore just used as a biomarker. It is, however, more likely that this phosphorylation is significantly more or less prominent under disease conditions, for instance representative of an increased or reduced activity of the corresponding protein, while protein expression may be unchanged. Importantly, in some cases a phosphorylation might be only detectable due to a disease-relevant SNP: For instance when single amino acid substitutions lead to the presence/exposure of either novel Ser/Thr/Tyr residues or novel kinase consensus motifs inducing a non-standard phosphorylation site. In both cases, the novel phosphorylated peptide might only be detectable using protein databases that consider the respective mutation. Therefore, as long as a specific PTM is not present only due to SNPs, a mere qualitative analysis of clinical samples is not sufficient, and well-defined and carefully-conducted quantitative experiments are mandatory to subtract relevant signaling from background. This is particularly relevant as clinical tissue samples represent cell populations that may differ in their respective PTM (e.g. phosphorylation) status, such that disease markers may be suppressed in the final analysis. For instance, heterogeneous tumors may contain certain cells with a significantly regulated PTM, while surrounding cells may mask the extent of this regulation. The often transient and sub-stoichiometric nature of PTMs renders an enrichment step prior to analysis mandatory to make them accessible for MS analysis, with the most efficient methods typically applied on the peptide level. This substantially improves the identification and quantitation of modified peptides, however, at the expense of more elaborate workflows and—consequently—further increases in technical variation (as well as additional shortcomings of bottom-up PTM analysis discussed elsewhere [Citation13]). Some examples of enrichment strategies that have been successfully applied to clinical samples will be given in the following chapters. There, we will focus on four classes of PTMs of high abundance and relevance (phosphorylation, glycosylation, proteolytic cleavage, and redox modifications) that can be enriched without antibody IP, as such methods often require relatively large amounts of sample and are usually not applied to clinical samples.
5. Methods for quantifying PTMs in clinical samples
MS-based discovery is still mostly done using data-dependent acquisition (DDA) methods, where the MS continuously applies analysis cycles in which usually the top 5-20 most intense peptides are subjected to fragmentation, slight variations in (i) retention times, (ii) signal intensities, as well as (iii) co-isolation of peptides, and (iv) poor MS/MS spectrum quality, can cause so-called ‘undersampling’—in other words, although a peptide is clearly present in a sample, it will not be identified and therefore not quantified. This affects both label-free and label-based approaches, although the latter usually include numerous multiplexed experiments in order to analyze sufficiently high numbers of samples (e.g. ten 10-plex experiments). In label-free quantitation (discovery), this has been compensated for by various software tools that use so-called matching or alignment of LC-MS runs [Citation69-Citation71]. Here, different LC-MS runs can be aligned based on unique characteristics of ‘features’ (i.e. ions represented by e.g. m/z, retention time window, elution profile, isotope pattern). Thus, it is sufficient that a specific peptide (feature) is only reliably identified in a single LC-MS run to trace it in all other analyses, as long as these are sufficiently reproducible. Thus, quantitation becomes almost independent of identification, allowing a considerably improved coverage across different samples. Still, inconsistent behavior during LC-MS analysis limits the alignment capabilities of the different software tools. Even when identified and clearly present in multiple runs, the same peptide may still be represented by different features, so that the quantitative information is incomplete without manual inspection (). In large datasets, missing values can be predicted by imputation [Citation62], which facilitates statistical data analysis but which is certainly not ideal.
Figure 3. Issues with alignment of LC-MS runs in label-free discovery experiments, exemplified by theoretical extracted ion chromatograms leading to inconsistent quantitation of peptides. (A) Alignment can be generally impaired by inconsistent retention times due to non-linear shifts of peptide and background peaks. A substantial retention time shift of 20 s in one of the LC-MS runs might lead to misassignment of the peptide to another feature (feature 2). B) For PTM peptides inconsistent assignment of PTM modification sites within an identified peptide can also impair alignment; preferentially if various modifiable amino acid residues are in close proximity and if MS/MS spectra quality is insufficient (‘s’ indicates the phosphorylation site assigned by the database search). C) Indeed, both effects can superimpose, leading to multiple features that may represent a single peptide. In targeted approaches this can be compensated for by the use of stable isotope labeled (SIL) reference peptides.
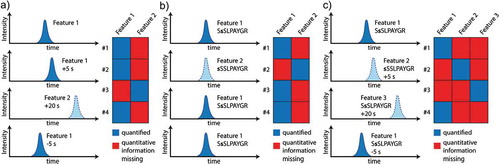
For modified peptides, quantitation is even more challenging. First, single-peptide quantitation in discovery approaches is less robust than protein quantitation based on multiple peptide measurements. Second, the issue of missing values is more pronounced because, in addition to alignment problems, for PTMs the position of the modified amino acid has to be unambiguously identified within the peptide sequence [Citation72] (). This can be complicated, as multiple modifiable amino acids can be in close proximity within a sequence (for example, the unambiguous localization of the phosphorylation site in the sequence SSSLPAYGR in human dermatin is challenging) and, in addition, MS/MS spectra quality can be severely impaired due to the modification(s) [Citation73,Citation74]. Consequently, label-free PTM-centric discovery studies suffer even more from missing values and inconsistent quantitation (). Recent studies demonstrated that data-independent acquisition (DIA) strategies allow a more consistent, reproducible, and precise quantitation of proteomes and particularly of larger sample sets and cohorts [Citation75-Citation77]. Here, in contrast to DDA, individual ions are not targeted for isolation and fragmentation, but instead a mass range of interest (e.g. 300-1500 m/z) is divided in multiple smaller m/z windows that are consecutively selected for fragmentation, leading to hybrid MS/MS spectra often including several peptides. Individual fragment ion spectra are then later assembled based on elution profiles. In DIA peptides are continuously fragmented throughout their elution profile, and quantitation can be conducted using fragment ions rather than precursor ions, reducing interference and allowing a more robust quantitation than in DDA. A potential shortcoming of DIA methods is that, for optimal performance, they require the generation of comprehensive spectral libraries, which may not be optimal, particularly for discovering novel candidates under disease conditions. Thus, spectral libraries would be ideally required for representative samples of all cohorts included in the study.
Generally, MS methods must be thoroughly validated and the transfer to a clinical environment for daily use as routine procedure has to be realistic and feasible. This may include a shift from nano-LC typically used in discovery proteomics to larger columns and flow rates that are considerably more robust at the expense of slight sensitivity losses [Citation78]. There is always a trade-off between proteomic coverage and analysis time on one hand, and precision and costs on the other. Sample fractionation prior to LC-MS will substantially improve coverage, not only for global proteomics, but also with regard to PTM-centric workflows where fractionation can boost the identification of modified peptides. However, fractionation in label-free approaches is challenging as—even under ideal and reproducible conditions—it will add another level of technical variation which is extremely challenging to handle with data analysis software tools. An alternative strategy, one that is particularly relevant for PTM-centric studies due to more complex and susceptible workflows, is the use of chemical SIL strategies allowing multiplexing of samples. The most popular commercial labels (iTRAQ [Citation79,Citation80] and TMT [Citation81,Citation82]) allow multiplexing of eight and ten samples, respectively. Though this multiplexing capacity is still way too low for virtually any clinical setting, several such experiments could be combined in order to analyze sufficient numbers of patient samples. Ideally, this would imply the use of a mixture of samples (all or a subset) that is applied as one channel to every single multiplexing experiment for normalization purposes. Because, after labeling, the same peptide derived from different samples is always virtually isobaric, even multiplexing 10 samples does not considerably increase sample complexity. Consequently, the differently labeled versions of a single peptide will be isolated and fragmented just like a single precursor in DDA experiments, releasing reporter ions that reflect the relative amounts of the peptide in the different samples in the low m/z region of the MS/MS spectrum, which furthermore contains the usual peptide backbone information (). Once samples are multiplexed, they can undergo various enrichment and fractionation strategies without largely compromising precision. Thus, iTRAQ and TMT are well-suited for highly sensitive PTM-centric analysis, as multiplexing allows quantitative PTM analysis even from as little as 10 µg of protein start material per sample or condition [Citation83] and has been applied to quantify e.g. phosphorylation [Citation84], glycosylation [Citation85], proteolysis [Citation86], Lys acetylation [Citation87], cysteine modifications [Citation88], or combinations thereof. However, TMT and iTRAQ suffer from ratio compression (), an effect caused by the potential co-isolation of background peptides and consistent, low-level background fragmentation [Citation89], as virtually every peptide in the sample releases the same reporter ions (labeling efficiency >97% can be readily achieved) [Citation90,Citation91]. Notably, this effect renders reporter ion-based methods incompatible with DIA methods as it cannot be deduced how much of a specific reporter ion signal in a hybrid spectrum derives from a specific peptide (). However, selective PTM enrichment and the usage of dedicated DDA analysis strategies, particularly involving narrow m/z isolation windows with modern instruments of 0.4 to 0.8 m/z can largely compensate for ratio compression. Importantly, iTRAQ and TMT can alter the physicochemical properties of peptides and thus affect the efficiency of PTM enrichment and MS detection, but also chromatographic behavior. Consequently, the validation of iTRAQ/TMT derived target peptides for example by targeted methods such as parallel reaction monitoring (PRM) [Citation92] with unlabeled samples may not always be successful, even for sequences which should be well detectable. Recent improvements exploiting mass defects and ultra-high resolution MS, such as the NeuCode approach developed by the Coon lab (for a detailed explanation of the approach we refer to [Citation93,Citation94]) show great promise that one of the drawbacks of current reporter ion methods, that is the limited multiplexing capacity, will be overcome in the future, allowing for more comprehensive studies. Importantly, this would massively reduce the problem of missing values in large scale studies, because a quantitative value will be obtained for every peptide as long as the peptide is really present in the sample above the detection limit.
Figure 4. Problems with reporter ion-based quantitation, demonstrated for iTRAQ 8plex. A) In DDA experiments, all differentially labeled versions of an iTRAQ/TMT labeled peptide will contribute to (basically) a single isotope pattern in MS survey scans. In this case, an isolation window of 1.6 m/z (dashed lines) is sufficient to prevent co-isolation. Upon fragmentation, the reporter ions reflecting the relative amounts of the peptide in the eight samples will be released. B) iTRAQ 8plex reporter ion area of an MS/MS spectrum, exemplified by 4 diseased samples (red) and four healthy controls (blue). Note that the higher m/z range of the MS/MS (not shown here) contains the fragment ions representing the peptide backbone. From, the reporter ions it can be deduced that the peptide is significantly downregulated in the diseased samples. C) If another peptide is in close m/z proximity, an isolation window of 1.6 m/z (grey) may be too wide, leading to co-isolation and ratio compression (representative MS/MS spectrum shown in D), whereas a narrower isolation window of 0.8 m/z (black) may prevent this; representative MS/MS spectrum shown in B). D) Ratio compression due to co-isolation distorts quantitation: The peptide no longer appears to be significantly downregulated. E) In DIA experiments, wider windows are selected for continuous fragmentation of the entire mass range, as represented here by 4.0 m/z. F) In DIA, the elution profiles of the fragment ions are assembled from individual MS/MS scans, and matching elution profiles point to fragment ions from the same precursor (as demonstrated by the black traces). In contrast, reporter ions will be constantly present in all MS/MS spectra with varying intensities, rendering it impossible to infer reporter ion intensities for individual peptides.

While these approaches allow the discovery-based quantification of thousands of PTMs across multiple samples, validation of interesting targets will be usually conducted with MS-independent technologies, for instance immunoassays such as ELISA. These are straightforward to implement and provide high throughput, but suffer from low to medium multiplexing capacities and are relatively expensive [Citation95], although substantial improvements have recently been achieved for antibody-based assays. For instance Treindl et al. have developed a complex workflow that allows antibody-based quantitation of hundreds of proteins from a single sample [Citation96]. Proteins are first separated by gel electrophoresis, blotted on a membrane and biotinylated. Next, the membrane lane is cut into 96 bands and proteins are eluted in a 96-well plate. Next, Neutravidin-coated and differentially color-coded Luminex beads are added to each well, so that different colors represent the different molecular weight areas of the original gel. The beads can be pooled and small aliquots can be incubated with hundreds of antibodies when using 5-20 μg of protein, comparable to a standard Western blot analysis. A Phycoerythrin-labeled secondary antibody is used for signal generation, and the samples are analyzed on a flow cytometer, generating discrete signals for 96 bead populations which can be used for visualization.
Still, completely relying on antibody specificity can be an issue, even for validated antibodies, and even more so for PTM-specific antibodies (). Notably, antibodies are not even available for many candidates of interest that appear in system-wide quantitative PTM-centric discovery studies. Therefore, recently, MRM and PRM (discussed in detail elsewhere [Citation97-Citation99]), have gained increasing attention as powerful alternative validation approaches. They have the advantage of always combining peptide (or protein) quantitation with identification, instead of just detecting an increase in the signal as in antibody-based procedures. In MRM, the MS is set up to specifically quantify a pre-defined set of candidates in a very specific manner, allowing higher precision and throughput, as sample analysis can often be performed in one hour or less. However, the non-targeted bulk of the proteome remains a black box. Ideally, MRM/PRM assays would involve the usage of SIL reference peptides. Here, the peptides-of-interest are synthesized with incorporated stable isotopes and their sequences, such as 13C, 15N or 18O. The label is usually introduced in the C-terminal amino acid and therefore the y-ion series shows a shifted m/z. A SIL reference and the corresponding endogenous peptide share the same sequence and physicochemical properties, but differ by mass—ideally by at least 4 Da. Thus, they have the same dose/response rates in MS. Consequently, a well-defined amount (e.g. 50 fmol) of SIL reference peptide can be spiked into a sample, allowing precise absolute quantitation of endogenous peptide (and consequently protein) amounts/concentrations by comparing their signals (i.e. intensity or area under the curve) over several orders of magnitude, down to amol amounts on column. The usage of SIL peptides further increases the confidence in peptide identification, as the SIL and endogenous peptides co-elute and have identical fragmentation patterns, after the intentionally-introduced mass shift has been taken into account. The key to precise protein quantitation using SIL reference peptides is the selection of appropriate peptides, that are proteotypic and not prone to degradation or modifications artificially induced during sample preparation.
Figure 5. Antibody specificity as an issue. Depicted are a full length anti-Zyxin antibody and two antibodies against phosphorylated Zyxin (p-Zyxin) from different vendors showing poor specificity. Importantly, there can be substantial differences between antibodies from different vendors.
Once set up and optimized, MRM and PRM enable a highly sensitive quantitation of 100s of peptides per LC-MS run in ‘scheduled mode’, which relies on reproducible chromatography with stable retention times. For targeted MS, peptides-of-interest are typically evaluated for their suitability, namely detectability, stability, and uniqueness [Citation100]. Well-generated, quality controlled, and validated targeted assays [Citation64] enable the analysis of larger sample cohorts in accordance with the demands of clinical research, including good inter-laboratory reproducibility and precision [Citation101]. To this end, more than 1500 characterized targeted assays are available through the CPTAC Assay Portal [Citation102] (https://proteomics.cancer.gov/assay-portal), including >200 for phosphopeptides.
If the sensitivity of MRM/PRM is not sufficient to quantify the peptide of interest from whole cell or tissue lysate, as often the case for modified peptides, these methods can be combined with fast enrichment procedures to reduce the huge background of non-modified peptides [Citation103,Citation104]. If 90% of the non-modified background can be removed, a larger proportion of the PTM-proteome of interest can be loaded on-column to improve sensitivity. If this is still not sufficient, combining anti-peptide antibody immunoprecipitation (IP) with MS, such as ‘Stable Isotope Standards and Capture by Anti-Peptide Antibodies’ (SISCAPA) [Citation105-Citation107] and immuno MALDI (iMALDI) [Citation108-Citation111], or TXP antibodies [Citation112] that recognize peptides with a common epitope of 3-4 amino acids at the N- or C-terminus, prior to (LC-)MS analysis can considerably improve the accessibility of target peptides. The unique capabilities of MS can even compensate for low antibody specificity, while the use of SIL reference peptides allows absolute quantitation from bodily fluids, cells, and tissues [Citation42]. In a recent project which shows great promise for clinical settings, Popp et al. used iMALDI (a technique that combines anti-peptide antibody immuno-enrichment with on target elution and MALDI MS) for the accurate quantitation of AKT1 and AKT2 out of cell lysate, flash frozen and FFPE tissues [Citation111].
Translation to clinical settings requires robust methods that are precise, cheap and provide high throughput, among those immunoassays (given the previously mentioned limitations), targeted MS with robust LC conditions, as well as SISCAPA [Citation105-Citation107] and iMALDI [Citation108-Citation111].
6. Analyzing protein glycosylation and phosphorylation in clinical samples
Protein glycosylation and phosphorylation are the two most abundant PTMs. While phosphorylation is generally reversible and allows rapid signaling, glycosylation represents a wide range of heterogeneous sugar structures of different complexity, which can make up more than 90% of a protein’s molecular weight and may be reversible or irreversible. Phosphorylation and glycosylation play key roles in many clinically relevant processes such as immunity [Citation113,Citation114], inflammation [Citation115,Citation116], or metastasis [Citation117,Citation118]. Aberrant modification patterns can be linked to multiple diseases, including Alzheimer’s disease [Citation20,Citation119-Citation121], diabetes [Citation122-Citation125], cancer [Citation126-Citation129], and cardiovascular diseases [Citation130-Citation132]. Both PTMs have been extensively studied by MS. However, while numerous strategies for the direct analysis of phosphopeptides from complex samples after specific enrichment have been developed, because of the enormous complexity of glycan structures and glycopeptide fragmentation patterns, in-depth analysis strategies for protein glycosylation usually employ the release of glycans, so that either previously-glycosylated peptides (site mapping) or the glycan structures by themselves (without the peptide backbone) can be analyzed in detail. To date, most studies on PTMs in clinical samples have focused on either protein phosphorylation or glycosylation, mostly with the goal of discovering biomarkers (panels of proteins or affected pathways rather than single proteins) and stratifying patients to improve risk assessment, precision medicine, and therapy guidance (reviewed by [Citation133,Citation134]).
For glycan profiling, different approaches have been applied to the study of clinical samples, e.g. focusing on either on glycomes by LC-MS after glycan release and capture, or glycan spatial distributions by MALDI imaging. MS-based profiling of glycans in bodily fluids had already started in the 2000s [Citation135-Citation140], as those samples can be easily obtained in rather large amounts. In 2012, Alley et al. studied N-glycans in blood sera obtained from ovarian cancer patients and controls [Citation141]. They were able to observe differences that allowed distinguishing patient samples from controls. Sonneveld et al. used nano-LC-MS to study aberrant glycosylation in autoimmune hemolytic anemia (AIHA) using a total of 103 plasma samples [Citation142]. In AIHA, red blood cells (RBC) are destroyed by IgG anti-RBC autoantibodies, which can lead to hemolysis. They were able to demonstrate aberrant galactosylation patterns in IgG1-anti-RBC autoantibodies. More recently, glycoproteomics has also been increasingly applied to the study of tissue samples. Thus, Jin et al. studied mucin o-glycosylation from 10 individuals with and without gastric disease [Citation143]. Mucins were isolated from frozen gastric specimen using isopycnic density centrifugation and pooling of mucin-containing fractions. O-glycans were released and analyzed by LC-MS. The authors found a large diversity in gastric O-glycosylation patterns, and concluded that the high individual variation may render it difficult to identify cancer-specific patterns, though they did observe higher sialylation and sulfation patterns on O-glycans identified from cancerous tissue. Hinneburg et al. reported a novel approach to study N- and O-glycomes simultaneously from FFPE tissue [Citation144]. Cells were isolated from FFPE tissue through laser capture microdissection, proteins were extracted, blotted on PVDF membranes, and the N- and O-glycans were sequentially released, followed by nano-LC-MS using porous graphitized carbon columns. Using this method, the authors were able to characterize the N- and O-glycomes of tissue specimens, and even to differentiate and relatively quantify structural isomers. Recently, Everest-Dass et al. used MALDI imaging to study N-glycans in ovarian cancer FFPE tissues [Citation141]. N-linked glycans were first released and analyzed by porous graphitized carbon LC-MS and the identified glycan profiles were then used to determine the spatial distribution of released N-glycans on FFPE ovarian-cancer sections by MALDI imaging. Interestingly, the authors were able to detect differences between the tumor region which had high levels of high mannose glycans, and the intervening stroma which had high levels of complex/hybrid N-glycans.
Compared to glycosylation, phosphorylation-based signaling can be very rapid, dynamic, and easily altered during sampling and sample processing. Thus, strategies applicable to clinical samples were developed only after the development of robust and highly sensitive strategies that allowed the system-wide precise quantitation of phosphorylation changes (extensively reviewed elsewhere [Citation145-Citation148]), and therefore phosphoproteomics of clinical samples has recently gained more attention. The first quantitative phosphoproteomics studies of patient samples included the temporal profiling of phospho-signaling in human platelets obtained from fresh blood donations, after specific treatment with inhibiting and activating compounds. This analysis revealed proteins in platelets that might be relevant for hemostasis and thrombosis [Citation104]. Here, chemical stable-isotope labeling, multiplexing, and TiO2/HILIC-based phosphopeptide enrichment/fractionation [Citation149] were combined with nano-LC-MS to quantify thousands of phosphorylation sites from approximately 100 µg of protein per sample. Schweppe et al. used strong cation exchange (SCX) chromatographic fractionation followed by TiO2 phosphopeptide enrichment to quantify non-small lung cancer (NSLC) tissue from human individuals using a super-SILAC approach [Citation150]. For this study, NSLC cancer cell lines were grown in SILAC medium with heavy arginine and lysine and were spiked in as reference standard, allowing the quantitation of two individual tumor samples against the super-SILAC mix and thus against each other [Citation151]. Dazert et al. analyzed primary tumor and control non-tumor biopsies from a sorafenib-treated hepatocellular carcinoma (HCC) patient, 7 weeks before treatment and 7.5 weeks after a non-effective treatment [Citation152]. They used a super-SILAC standard consisting of five different cell lines for normalization, SCX-based fractionation, and TiO2-based enrichment followed by nano-LC-MS. A small portion of each SCX fraction was used for global proteome analysis. The authors were able to observe reduced phosphorylation of the Raf-Erk-Rsk pathway, indicating a successful inhibition of the target kinase Raf, but downstream targets did not show reduced phosphorylation. A pathway analysis combining both proteome and phosphoproteome data revealed the potential role of two processes in developing resistance: epithelial-to-mesenchymal transition, and cellular adhesion molecule-dependent drug resistance.
The validation of phosphoproteomic changes obtained from discovery experiments in sample cohorts is still mainly done using antibodies. However, because of the aforementioned issues of antibody availability and specificity (which is particularly true for phosphospecific antibodies, see ()), a combination of phosphopeptide enrichment and targeted MS is increasingly used instead of antibody-based approaches. Targeted MS is flexible, can be multiplexed, and allows the highly specific and sensitive quantitation of phosphopeptides by single-shot LC-MS analyses, e.g. after TiO2 [Citation103,Citation104] or IMAC-based enrichment [Citation153,Citation154]. In contrast to Western blot or ELISA, MS-based methods allow the unambiguous connection between qualitative (peptide sequence and phosphorylation site) and quantitative information with high precision, and, if SIL peptides are used, even absolute quantitation, including the assessment of phosphorylation levels (stoichiometry). Thus, in order to quantify a specific phosphorylation-site of interest, PHD Ser125, in fresh frozen colorectal cancer biopsies, Di Conza et al. applied HPLC-based electrostatic repulsion-hydrophilic interaction liquid chromatography (ERLIC) [Citation155,Citation156] for combined phosphopeptide enrichment and fractionation [Citation157]. In ERLIC, the majority of the unphosphorylated peptides are found in the flow-through and the early fractions [Citation158], while phosphopeptides are efficiently retained [Citation159] and separated according to the number of phosphoamino acids [Citation160]. Using a SIL reference for the phosphopeptide AKPPADPAAAAsPCR, the authors first determined a retention-time window, which then allowed them to specifically collect the enriched phosphopeptide from only 32 µg of total protein from the tissue samples. Absolute quantitation of the phosphopeptide, and the non-phosphorylated counterpart in complete digest, using PRM, allowed them to determine the phosphorylation stoichiometry in cancerous and healthy tissue samples from ten individuals. Their results showed significantly reduced phosphorylation levels in the cancer tissue, in line with the hypothesis based on from cell culture experiments [Citation157].
CPTAC has conducted several relevant phosphoproteomics studies in cancer tissues. Mertins et al. addressed the aforementioned issue that tissue collection cannot always be standardized, and consequently ischemic time can vary between tissue samples collected for the same study [Citation161]. This, however, can alter phosphorylation levels of biopsy samples as the authors demonstrated. They collected human ovarian tumor and breast cancer xenograft tissue from different patients without vascular interruption (0 min) and then allowed defined ischemic time intervals of 5, 30, and 60 min. Samples were labeled with 4-plex iTRAQ, fractionated, and enriched for phosphorylated peptides using IMAC. A total of ~3 mg protein was used per experiment, 10% of which was used for global proteome quantitation. Interestingly, the global proteome and most of the more than 25,000 phosphorylation sites did not show significant changes after 60 min. However, approximately one quarter of the phosphoproteome showed rapid changes, many in critical cancer pathways related to stress response, transcriptional regulation, and cell death. This underscores the need for well-standardized and documented sampling procedures for clinical proteomics. This was further confirmed by Gajadhar et al. who analyzed high-grade serous ovarian carcinoma tissue and colon adenocarcinoma biopsies from five patients each [Citation162]. After vessel ligation, specimens were surgically removed and the first biopsy was taken immediately and snap frozen (0 min). Further biopsies were taken after 10, 30, and 60 min of cold ischemia. Samples were labeled with the iTRAQ-4plex reagents, and phosphotyrosine (pTyr) peptides were enriched using a pTyr antibody mixture, followed by IMAC enrichment and LC-MS. Ten percent of each sample was further fractionated and analyzed by LC-MS for global proteome quantitation. The authors observed a rapid, unpredictable, and widespread impact on phosphotyrosine patterns in which up to 50% of pTyr sites were changed more than 2-fold, in addition to observing a considerable spatial heterogeneity within the tissue. Notably, both spatial heterogeneity and the dynamic response to ischemia varied substantially between the different patients. Huang et al. applied quantitative (phospho)proteomics to study 24 breast cancer-derived xenografts (PDX) models [Citation30]. They were able not only to confirm predicted genomic targets, but also to find protein expression and phosphorylation changes that could not be explained based on genomic data, showing the potential of MS-based proteomics for identifying novel drug targets.
7. Analyzing endogenous proteolytic cleavage (proteolysis) in clinical samples
Proteolysis is the irreversible cleavage of proteins into smaller polypeptides, and is usually catalyzed by proteases. In addition to its role in protein degradation and apoptosis, proteolysis also affects protein localization, function, activity, and protein-protein interactions. Aberrant proteolytic cleavage is connected to a variety of diseases, including cardiovascular and neurodegenerative diseases [Citation163,Citation164], inflammation and impaired wound healing [Citation165], as well as tumor metastasis [Citation166]. This can be caused by, for example, dysregulation of proteases, or SNPs that suddenly render a protein a non-physiological substrate of a protease. To better understand the role of proteolysis in disease, it is important to not only identify the substrates that are cleaved under pathophysiological conditions, but also to determine where they are cleaved and how they are differentially regulated between healthy and diseased states. While the protease responsible for a specific cleavage might be a promising drug target, its reliable identification is rather challenging and not straightforward. This may usually require cell culture-based differential control experiments either with specific protease inhibitors or the usage of specific protease knock outs. Analysis may be conducted by MS or by Western blot-based migration shifts.
As is the case for phosphorylation and glycosylation, it can be anticipated that specific proteolytic signatures indicate aberrant cleavage, perhaps even by a specific protease, and—importantly—may serve as markers for diagnosis and treatment.
Proteolysis leads to the formation of novel (‘neo’) protein N-termini and MS-based proteomics has become an indispensable tool to identify these neo N-termini. This is preferentially done through the system-wide specific enrichment of N-terminal peptides, which include not only the original but also neo protein N-termini, followed by LC-MS. This approach has been referred to as N-terminomics. A variety of methods have been developed for this purpose, among these are combined fractional diagonal chromatography (COFRADIC) [Citation167], terminal-amine isotopic labeling of substrates (TAILS) [Citation168], charge-based fractional diagonal chromatography (ChaFRADIC) [Citation169], and subtiligase N-terminal enrichment [Citation170]. All of these methods include the specific labeling of protein N-termini prior to in vitro digestion in order to distinguish the specifically labeled N-terminal from internal peptides. These methods allow the identification of protease substrates through the differential formation of neo N-terminal peptides between different conditions—usually, protease knockout vs. wild-type, but increasingly also patients vs. controls. Notably, the identification of neo N-terminal peptides appearing under specific conditions directly reveals the respective cleavage sites, and also allows the researcher to deduce consensus motifs. In addition to these direct strategies, there are also more indirect methods such PROTOMAP, which combines SDS-PAGE with LC-MS to globally identify shifts in protein migration that are indicative of proteolytic processing [Citation171]. This method, however, cannot readily reveal cleavage sites or motifs. In general protease inhibitors should be used during sample homogenization/lysis, especially in case of tissues, to ensure that ongoing endogenous protease activity does not alter the cleavage patterns.
To date, there are still only few studies that have applied quantitative N-terminomics to patient-derived samples; in the large majority of studies, these techniques have been used to study fundamental and clinically relevant processes in cell culture or animal models. Lange et al. used TAILS and LC-MS to study erythrocytes obtained from 6 mL of whole blood per healthy donor. The extremely high abundance of hemoglobin in erythrocytes makes their proteomic analysis quite challenging. Using TAILS and thus specifically focusing on protein N-termini allowed the researchers to substantially reduce sample complexity in order to improve the detection of low-abundance proteins. In this way, the authors were able to identify 1369 N-terminal peptides from 1234 proteins, 281 of which were novel erythrocyte proteins while six previously-missing proteins [Citation172,Citation173] were identified by MS for the first time [Citation174]. The same group also analyzed human dental pulp as a unique tissue that could lead to the identification of additional missing proteins, and found that most of the identified N-termini represented proteolytic cleavage sites [Citation175]. In another study, TAILS was used to compare B cells from the only known living patient worldwide with a genetic MALT1 deficiency, which leads to immunodeficiency and immune dysregulation, with heterozygous family members presenting no immunological disorders. MALT1 is a paracaspase that plays an important role in regulating lymphocyte responses in NF-κB activation. The authors were able to identify HOIL1, a member of the linear ubiquitin chain assembly complex, as a novel MALT1 substrate, inhibiting reactivation of the NF-κB pathway [Citation176].
Subtiligase labeling and N-terminal enrichment [Citation170] was used for enriching protein N-termini in plasma and serum obtained from healthy donors, in order to elucidate the roles of proteases in blood. The authors identified 772 unique N-terminal peptides from 222 proteins, ranging over six orders of magnitude in abundance [Citation177]. They were able to validate known proteolytic processes, including peptide cleavage in coagulation and complement activation, and also found a large number of cleavages that had not previously been reported. Recently, using the same method and combining discovery with subsequent quantitation by MRM, Witta et al. analyzed plasma from patients after chemotherapy to detect proteolytic signatures released from apoptotic cells which may serve as indicators of chemotherapy-induced cell death [Citation178]. The experiment was performed in 1.5-mL cell-free plasma samples from 5 different patients, which included two acute myeloid leukemia (AML) patients and one patient with non-Hodgkin lymphoma (NHL) of diffuse large B-cell lymphoma subtype. The authors reported 153 proteolytic peptides which may serve as an initial library of proteolytic biomarkers.
Solari et al. applied quantitative iTRAQ-8plex-based ChaFRADIC and (phospho)proteomics to platelets isolated from the only Scott syndrome patient available worldwide. The Scott syndrome is a rare but likely underdiagnosed bleeding disorder associated with mutations in ANO6 that lead to an impaired procoagulant response [Citation179]. From only 20 µg of protein per sample, they quantified 1596 N-terminal peptides between activated patient and control platelets, 180 of which were confirmed as calpain-regulated (corresponding to 106 proteins) and 23 (corresponding to 23 proteins) were confirmed as caspase-regulated. The authors detected reduced calpain-dependent cleavage of cytoskeleton-linked and signaling proteins in the Scott patient, in agreement with increased phosphorylation states. While in this study, the high sensitivity was achieved using a rather elaborate HPLC-based ChaFRADIC workflow, the authors have recently developed a tip-based improvement of the procedure that allows quantitative N-terminomics with high sensitivity [Citation180].
8. Analyzing oxidative Cys modifications in clinical samples
A high diversity of protein PTMs are formed as a result of direct or indirect interaction with reactive oxygen/nitrogen species (ROS/RNS) [Citation181,Citation182]. Small reactive radical or non-radical ROS/RNS, such as superoxide (O2·−2) produced by the NAD(P)H oxidase family, and nitrogen monoxide (NO) produced by nitric oxide synthases (NOS), are byproducts of cellular respiration [Citation183] and primarily form redox modifications on cysteine (Cys), due to the high reactivity of its thiol side chain [Citation182,Citation184]. Reversible cysteine redox PTMs include S-nitrosylation (SNO), S-sulfenylation (SOH), disulfide formation (S–S), S-glutathionylation (SSG), S-cysteinylation (S-Cys), and S-sulfhydration (SSH), while sulfinylation (SO2H) and sulfonylation (SO3H) are generally considered to be irreversible [Citation181,Citation184]. Cys modifications are key regulators of cellular redox homeostasis [Citation185]. At low ROS levels, reversible/protective PTMs are formed that are associated with cell proliferation, differentiation, and redox signaling, while increasing ROS levels result in irreversible modifications and damage to proteins [Citation186]. Importantly, specific redox-reactive Cys residues can be present in their reduced forms or may compete for different types of redox modifications, making them into ‘redox-switches’ which sense the redox microenvironment and allow reversible and—if required—irreversible fine tuning of biochemical processes [Citation181,Citation185]. ROS-mediated signaling is involved in many key metabolic processes, and affects a wide variety of upstream and downstream protein targets, thereby influencing the regulation of other PTMs such as phosphorylation, acetylation, and ubiquitination [Citation88,Citation187,Citation188].
Although the functional relevance of Cys oxidative PTMs in human diseases, such as cancer [Citation189], cardiovascular [Citation188,Citation190], inflammatory [Citation191], and neurodegenerative diseases [Citation191,Citation192] is clear, the molecular mechanisms of redox signaling still remain unclear. A number of proteomics techniques have been developed to study the targets and modulations of redox signaling [Citation193]. Because redox proteomics is still an emerging field with continuing method development, research has mainly focused on basic method development and the application of the newly-developed methods to cell culture and animal models [Citation193,Citation194]; only a few redox proteomics studies have involved human subjects [Citation195,Citation196]. A major challenge in transferring redox proteomics methods to clinical samples is the necessity for blocking free Cys residues and preserving endogenous levels as much and as soon as possible. In contrast to purely enzymatically driven PTMs, Cys redox states can even change in denatured samples and during sample preparation, which means that protocols have to be specifically optimized to reduce the occurrence of new (and exchange of existing) redox modifications. This involves avoiding exposure to UV light and atmospheric oxygen, avoiding lysis of the cells before the addition of blocking reagent, avoiding common pathogen inactivation procedures [Citation197] etc. While this is already complicated for cell culture and requires careful use of controls, it represents a major challenge for clinical samples, particularly tissues. In the following section, we will briefly discuss the most relevant Cys redox modifications, their roles in health and disease, and the current state of proteomic investigations.
The important role of NO in cardiac function and neurotransmission has been suggested by multiple studies [Citation186,Citation188,Citation192], and the cardioprotective potential of S-nitrosylation has been attributed to its ability to shield thiol groups from irreversible oxidation [Citation186-Citation188]. The neuronal isoform of NOS produces NO in the brain, which was first thought to be a neurotoxin associated with neurodegenerative diseases. Recent studies, however, also indicate the protective function of SNO in neurotransmission and synaptic plasticity [Citation192].
Direct analysis of SNO is highly challenging as it is not only present at low levels, but—more importantly—also labile. Currently, phenylmercury-resin-based enrichment approaches allow the direct capture of SNO via formation of stable thiol-Hg bonds. Using this technique Raju et al. identified 269 endogenous SNO sites in wild-type mouse brain [Citation192]. A broad spectrum of indirect methods to enrich and analyze SNO and other cysteine PTMs utilize different types of modified biotin switch techniques (BST) such as iodoTMT [Citation198], resin-assisted capture (RAC) [Citation199], and isotope-coded affinity tags (ICAT) [Citation200]. These assays include blocking of the free thiols, followed by selective reduction of modified cysteines and introduction of functional groups enabling stable-adduct formation, enrichment, and (preferably) also quantitation of the switched PTMs. Using a IodoTMT switch assay, including specific reduction of SNO by sodium ascorbate, Pan et al. identified 12 significantly regulated SNO proteins in hypoxic cardiomyocytes [Citation201]. Another modified BST, disulfide exchange based RAC, showed high specificity (~95 %) and superior sensitivity for proteins higher than 100 kDa compared to biotin-based enrichment [Citation199,Citation202]. Using another RAC approach in combination with iTRAQ labeling, Forrester et al. demonstrated the progressive decay of SNO signal over time as a result of CysNO treatment of HEK293 cells. Roughly 300 negatively-regulated SNO sites were quantified [Citation202], possibly indicating the presence of regulatory mechanisms for removal of SNO or exchange of the transient SNO to more stable disulfide [Citation203]. A modified form of ICAT: SNOxICAT, allowed for quantitative analysis of SNO site occupancy in vivo and demonstrated that the exposure to NO2 leads to widespread SNO formation only in ischemic mouse hearts, but not in ischemia or NO2 exposure solely [Citation204]. Ibáñez-Vea et al. applied titanium dioxide (TiO2) chromatography enrichment after SNO reduction by ascorbate followed by labeling with cysteine specific phosphonate adaptable tag (CysPAT) and identified high number of SNO proteins (569 endogeneous and 795 chemically induced) in macrophages [Citation205].
SOH is a highly reactive and unstable modification [Citation206]. Depending on the local redox-environment, it can be further converted to other reversible and irreversible cysteine PTMs. As an intermediate form of cysteine oxidation, it is a key player in redox signaling [Citation207]. Notably, the unique reactivity of SOH to dimedone compounds allows its use for direct labeling in living cells. Thus, stable isotope coded alkyne-functionalized dimedone (DYn-2 and d6-DYn-2) probes enable the enrichment and relative quantitation of SOH peptides. In a recent study of human RKO cells, about 1000 SOH-modified Cys sites from more than 700 proteins were identified in response to epidermal growth factor (EGF) stimulation and H2O2 treatment, from which 215 and 360 SOH sites could be quantified, respectively [Citation208]. Indirect analysis of SOH by modified BST and specific reduction of SOH by arsenite was used for the study of a SILAC-labeled THP-1 human monocytic cell line treated with H2O2 or activated human platelet releasate. More than 200 SOH peptides were quantified [Citation209].
One of the important functions of cellular disulfide bonds is the stabilization of protein structure via intramolecular and intermolecular covalent linkages [Citation210]. Nevertheless, specific Cys residues form redox-active disulfides as a result of reduction by oxidoreductases, interaction with small-molecule thiols such as glutathione (GSH) and free cysteine, or by replacement of less-stable SNO/SOH. Allosteric redox-active disulfides induce a functional change in the protein and are involved in redox signaling [Citation210]. A recent study has demonstrated the role of redox-active S-S in cancer: In vascular endothelial growth factor receptor (VEGFR2), Cys1199 and Cys1206 form an intra-molecular disulfide bond at elevated ROS levels, suppressing VEGFR2 activity [Citation189]. Importantly, knockdown of the key antioxidant enzyme peroxiredoxin III resulted in inactivation of VEGFR2 and repression of tumor angiogenesis in vivo [Citation211].
Proteome-wide analysis of intact disulfides represents a significant challenge. For analysis of native disulfides, Lu et al. used a combination of proteases, including Lys-C, trypsin, subtilisin, Glu-C, elastase, proteinase K, and/or Asp-N for protein digestion, extensively fractionated the resulting digests, performed LC-MS, and used their pLink-SS data analysis software for the identification of cross-linked peptides. In this way, more than 550 disulfide bonds were mapped in the secretome of human umbilical vein endothelial cells (HUVECs) [Citation212].
SSG has been suggested to provide more persistent protection against oxidative damage than transient SNO or SOH. Murdoch et al. showed that SSG is increased in ischemic muscle even several days after hindlimb ischemia, and that it facilitates revascularization [Citation213]. SSG of specific cysteines in the upstream and downstream targets of VEGFR2 were shown to considerably increase cardiac angiogenesis [Citation187]. As there are no direct methods available for the analysis of endogenous SSG, most studies are based on modified BST and the specific reduction of SSG by glutaredoxin [Citation214,Citation215].
The free intracellular cysteine concentration of ~100 µM is the source of S-Cys [Citation210]. An analysis of the cysteinylation of human serum albumin (HSA) at Cys34 in human plasma samples obtained from 229 patients (139 of whom had liver disease, 38 of whom had kidney disease, and 52 of whom had diabetes mellitus), showed a strong correlation of increased S-Cys34 with these three oxidative stress-related diseases [Citation195].
All these examples clearly demonstrate the high relevance of Cys modifications for human health, and the need to further improve the sensitivity and robustness of current methods so that they can be applied to clinical samples in the future. As demonstrated for phosphorylation, it can be anticipated that additional information on Cys redox status will be another important layer of information to stratify patient samples, and may lead to important markers of disease.
9. Study design for biomarker discovery
With the continuous advancement of proteomic instrumentation, methods, algorithms, and data analysis strategies, there has been also a paradigm shift with regard to study design. In the early days of clinical proteomics, two-dimensional PAGE was a widely-used but tedious and limited technology (with regard to quantitation, precision and coverage), and studies usually included only a few patients; nowadays, there is a general trend for the application of sophisticated gel-free workflows to larger cohorts. Cross-sectional comparisons between different cohorts are complemented more and more by longitudinal studies that follow patients over time [Citation216]. Particularly for biofluids which tend to show a large variation between patients, this is a promising strategy for the identification biomarker panels. Still today, most studies follow the ‘biomarker pipeline’ and include smaller initial cohorts for identifying potential markers and then expand this to larger cohorts for validation [Citation217]. If sufficient instrumentation and computational power are available, Geyer et al. propose an alternative strategy, which utilizes a large cohort in the discovery phase, and a second alternative cohort of the same size for the validation phase, both in a non-targeted rather than targeted mode [Citation218].
Obtaining well-classified samples for a sufficient number of patients and matched controls that have been collected under well-defined conditions that are compatible with downstream proteomic analysis, is often a bottleneck. However, beside stratification sample size is a major determinant of the reliability of the biomarkers and targets which have been identified in clinical samples, as sample size directly affects the statistical power [Citation219,Citation220]. Skates et al. calculated the probabilities for a biomarker passing through the biomarker pipeline from discovery to validation, and to then clinical validation as a function of the number of biospecimens and for different scenarios [Citation221]. In this study, they hypothesized that approximately 8000 proteins would be quantified during discovery, leading to 20/50/100 candidates for measurement in the validation state, and then 2/5/10 candidates for measurement in the clinical validation state. Thus, if 10 controls are compared against 10 patients during discovery, the likelihood that an authentic biomarker present in 50% of the cases with a median distance of 3 standard deviations is passed to the validation step is only 15% when 20 targeted assays are performed. In the case where 50 (100) targeted assays are performed, this likelihood increases to 24% (35%). However, increasing the number of samples has a much stronger effect. Under the aforementioned conditions, with 20 targeted assays and 25 (50) patients and controls, the likelihood increases to 60% (93%).
These theoretical considerations underline the importance of cohort size for biomarker discovery, but sample normalization and statistical tests to actually identify potential biomarkers in the discovery phase are also relevant. The conventional two-sided t-test to estimate the probability that a value is significantly different is not sufficient—if many individual tests are conducted (i.e. for thousands of proteins), a substantial share will yield significant p-values just by chance (false positives) [Citation222]. Therefore, corrections such as Benjamini Hochberg are typically applied in order to take false discovery rates into account for multiple comparisons. In addition to the statistical significance, the level of regulation must also be considered. A statistically highly significant 1.1-fold regulation may not be relevant—the median standard deviation of the entire dataset needs to be considered, too, in order to apply realistic cutoffs that take into account the quality of the individual dataset (e.g. 3 times the standard deviation as in the aforementioned example from Stakes et al.).
Sometimes sample size is inherently limited, for instance in case of rare disorders with low prevalence, rendering the estimation of the variance uncertain. Nevertheless, such rare disorders may still be analyzed by proteomics [Citation223]. For small sample sizes, the t-test may consider that a potential marker showing strong regulation but (concurrently) high intra-group variance is not significant [Citation224] (). Large intra-group variations can particularly appear between patients. Thus, one strategy to compensate for the inaccuracy of the estimation of variance in small sample sizes is ‘empirical Bayes method shrinking’ [Citation224] which uses a moderated t-test where the p-value is assessed by the fold-change rather than the initially estimated variance. Notably, empirical Bayes methods have been successfully applied in the microarray field for approximately 10 years [Citation225] and can be adapted for use in proteomics studies [Citation224,Citation226,Citation227].
Figure 6. Limits of t-test based statistics for small sample sizes. (A) Two simulated potential markers 1 and 2. Although the first marker shows a considerable difference between patients and controls, the strong intra-group variance leads to a poor p-value. In contrast, the second marker yields a low p-value and might be considered as statistically significant, but the difference between patients and groups is negligible. (B) Volcano plot of the two markers in the background of an iTRAQ-based phosphoproteomics experiment based on a t-test. (C) Volcano plot of the same data based on the moderated t-test provided in the Limma package [Citation226-Citation228]. Only marker 1 is actually significant. A detailed description for the use of this package was recently published by Kammers et al. [Citation224]. (Figure reprinted with permission, Pagel et al., Expert Rev Proteomics 2015).
![Figure 6. Limits of t-test based statistics for small sample sizes. (A) Two simulated potential markers 1 and 2. Although the first marker shows a considerable difference between patients and controls, the strong intra-group variance leads to a poor p-value. In contrast, the second marker yields a low p-value and might be considered as statistically significant, but the difference between patients and groups is negligible. (B) Volcano plot of the two markers in the background of an iTRAQ-based phosphoproteomics experiment based on a t-test. (C) Volcano plot of the same data based on the moderated t-test provided in the Limma package [Citation226-Citation228]. Only marker 1 is actually significant. A detailed description for the use of this package was recently published by Kammers et al. [Citation224]. (Figure reprinted with permission, Pagel et al., Expert Rev Proteomics 2015).](/cms/asset/b888980e-6316-4041-a3f2-63429c092b2d/ieru_a_1483340_f0006_oc.jpg)
Despite these promising alternative data analysis strategies, the major important determinant of successful biomarker discovery still remains: The most sophisticated data analysis strategies cannot compensate for poor sample or data quality. There is a continuously increasing number of clinical proteomics studies facing these issues, but there are also continuous improvements in available methods and instrumentation. Thus, it can be anticipated that improved statistical methods and tools will be developed to improve the detection and verification of biomarker candidates in proteomics studies.
10. Expert commentary
In recent years (i) technologies for proteomic sample preparation, PTM enrichment, chromatographic separation, and (ii) LC and MS instrumentation, as well as (iii) data analysis strategies, have been considerably improved. Concurrently, there has been an increasing awareness of the importance of quality control and standardization in MS-based proteomics in order to produce more reliable and robust quantitative data. Particularly for phosphorylation, glycosylation, proteolytic cleavage, and Cys modifications, highly sensitive methods have been developed that can even be applied to limited sample amounts, as often the case for biopsies. Consequently, an increasing number of clinical proteomics studies that focus on PTMs are emerging. Combining different and complementary layers of information, e.g. changes in (i) protein abundance and PTM levels, (ii) differences in PTMs, or (iii) changes in the genome, transcriptome, or proteome (proteogenomics [Citation229,Citation230]) holds great potential for discovering important drivers and markers of disease. Mere knowledge of protein abundance without spatial information and without full isoform resolution (both of which are missing in conventional proteomics studies) might, in some cases, be insufficient or even misleading. Therefore, the search for specific PTM signatures of disease is a promising complementary strategy, as demonstrated for potential proteolytic signatures in postchemotherapeutic blood [Citation178], for example.
Compared to genomics and transcriptomics, proteomic workflows are still considerably more challenging and less standardized. Thus, a general transfer of discovery proteomics workflows into routine clinics might be unrealistic in the near future. Nevertheless, interdisciplinary collaborations between clinicians, proteomics researchers, biochemists, bioinformaticians, and statisticians can provide important and novel insights into disease mechanisms, biomarkers, and therapeutic targets. Pilot projects such as CPTAC have made great progress in standardization and identifying potential pitfalls for in-depth (phospho)proteomics analyses of cancer tissues [Citation102,Citation161], and different cancer tissues have been analyzed using proteogenomic workflows, leading to the relative quantitation of thousands of proteins and phosphopeptides [Citation30,Citation32].
In addition to discovery, the transfer of MS-based assays into the clinic is an exciting opportunity. In cases where, for example current immunohistochemistry assays have limited predictive value, technologies such as MALDI imaging or iMALDI may be promising alternatives for the future [Citation111,Citation231]. Standardized MRM and PRM assays can be used to quantify defined sets of proteins and modified peptides. For phosphopeptides, this has already been demonstrated, but existing workflows are still too complex and time-consuming. Thus, Di Conza et al. were able to use a tailored PRM workflow for absolute quantitation of phosphorylation levels for PHD2 Ser125 in colorectal cancer biopsies [Citation157]. Although this is an exciting example which demonstrates the unique capabilities of MS for the absolute quantitation of phosphorylation levels from small amounts of tissue, the analysis required a specific ERLIC enrichment step; although this could probably be automated, it still might be too laborious to transfer into clinics. Also, it will be very important to ensure that such workflows work for FFPE samples. An alternative indirect workflow for determining phosphorylation stoichiometry is by spiking in the non-phosphorylated SIL reference peptide and splitting the sample in two aliquots, one of which treated with phosphatase [Citation232]. Individual measurement then allows assessment of phosphorylation stoichiometry. However, phospo-isomers cannot be distinguished after phosphatase treatment.
11. Five-year perspective
The increasing awareness of quality measures in the field of proteomics, initially with regard to reliable peptide and protein identification through the implementation of false discovery rate assessments [Citation233] and site localization algorithms [Citation72], but (importantly) also for system performance [Citation50] and more precise quantitation, have been critical milestones in the move from cell biology-driven proteomics to clinical proteomics. It can be anticipated that instrumentation will further improve in the next 5 years, leading to more robust, more rapid, and more sensitive LC-MS analyses with higher resolution. (Semi-)automated and parallelized sample preparation workflows are increasingly being developed and applied to reduce technical variation and increase analysis throughput. These developments will have an impact on DDA, DIA, and targeted methods, and will further improve the coverage, precision, and reproducibility of MS-based identification and quantitation. In this way, precise and deep proteomic profiling will become less time-consuming and more cost-effective, facilitating the implementation of studies on large sample cohorts as well as complex longitudinal studies. It will be important that data analysis pipelines are able to match the speed of the experimental progress, particularly regarding data amounts, comprehensiveness, and complexity. In addition to label-free analysis of samples, the increased multiplexing capacities of NeuCode will allow multi-level analysis of PTMs even from clinical samples [Citation234]. As instrumentation for targeted MS is comparatively robust, inexpensive, and widespread, it can be anticipated that clinics will increasingly consider establishing MS-based assays for the quantitation of proteins and PTM levels [Citation217]. MALDI imaging also holds a great potential for improving or complementing current histopathology, with the ultimate goal of having powerful algorithms that can help with diagnosis [Citation235]. As a rapid and straightforward approach, iMALDI may allow the MS-based precise quantitation of protein panels that may help to stratify patients [Citation110,Citation111].
Large multinational consortium-driven proteogenomic studies will increasingly exploit the unique possibilities of synergizing genomic, transcriptomic, proteomic, metabolomic, and lipidomic datasets [Citation236]. Thus, the ‘cancer moonshot’ program initiated by former US vice-president Joe Biden [Citation237,Citation238] led to the formation of the International Cancer Proteogenomics Consortium (ICPC), bringing together ‘some of the world’s leading cancer and proteogenomic research centers’ in order to improve our understanding of cancer. Such large worldwide consortia hold a great potential, as they enable access to larger patient cohorts, complementary technologies, and improved data sharing. It may be expected that similar large coordinated efforts will be undertaken for other widespread diseases, as well as for rare diseases where the increase in the number of available patients is even more critical.
In summary, MS has just recently began to reveal its real potential for clinical research, and the near future will be an exciting era where researchers will have the opportunity to demonstrate that the unique capabilities of MS-based proteomics can be translated into clinical environments in order to improve human health and healthy aging.
Key issues
To discover PTM signatures in clinical samples that may serve as biomarkers or targets, it is vital to have an optimal and elaborate study design, including the use of matching controls and thorough stratification of patient and control samples. Including inappropriate samples may lead to increased intra-group variation and therefore could mask potential markers. On the contrary, having well-characterized samples may allow reducing the number of samples.
Also, to keep preanalytical variance as low as possible it is important to strictly follow elaborate SOPs during sampling and sample processing. Ideally the sample collection should be commonly planned by clinicians and proteomics experts together and all steps should be followed strictly. In case small deviations from agreed-upon SOPs cannot be excluded, these should be well-documented so that later inconsistent results may be correlated with such changes.
PTM enrichments procedures should first be tested and optimized for sensitivity and robustness using reference samples such as HeLa or other cell culture models. As these procedures are often complex, the use of chemical labeling procedures that allow multiplexing prior to enrichment should be considered in order to reduce technical variation. Additionally, multiplexing may be used to improve sensitivity as in total more sample material can be used for the analysis.
For data analysis, it is important to consider how to deal with missing values. The selection of interesting targets should not be solely based on p-values and should additionally require reasonable fold-changes that take into account the standard deviation and distribution of the whole dataset at hand.
The validation of targets identified in the discovery phase should include a larger independent sample cohort, ideally collected using the same SOPs. The use of solely antibody-based assays has to be carefully considered, as particularly modification-specific protein antibodies often show poor specificity. More promising alternatives may be (i) targeted LC-MS in case of moderate to high-abundance targets using whole lysates and (ii) after enrichment e.g. of phosphopeptides, or (iii) using a combination of anti-peptide antibodies and (targeted) MS such as SISCAPA and iMALDI. Compatibility with FFPE tissue samples should be evaluated thoroughly.
For transfer into the clinic promising assays should be straightforward, robust, ideally fast and precise and therefore should have potential for (partial) automation and provide a simple and clear read-out.
Declaration of interest
C.H.Borchers is the Chief Scientific Officer of MRM Proteomics, Inc. The other authors have no other relevant affiliations or financial involvement with any organization or entity with a financial interest in or financial conflict with the subject matter or materials discussed in the manuscript apart from those disclosed.
Reviewer disclosures
Peer reviewers on this manuscript have no relevant financial or other relationships to disclose.
Supplemental Material
Download PDF (504.8 KB)Supplementary Materials
supplementary material can be accessed here
Additional information
Funding
References
- UniProt C. UniProt: a hub for protein information. Nucleic Acids Res. 2015;43(Database issue):D204–212.
- Hornbeck PV, Zhang B, Murray B, et al. PhosphoSitePlus2014: mutations, PTMs and recalibrations. Nucleic Acids Res. 2015;43(Database issue):D512–520.
- Vaudel M, Burkhart JM, Zahedi RP, et al. PeptideShaker enables reanalysis of MS-derived proteomics data sets. Nat Biotechnol. 2015;33(1):22–24.
- Lemeer S, Heck AJ. The phosphoproteomics data explosion. Curr Opin Chem Biol. 2009;13(4):414–420.
- Zhao Y, Brickner JR, Majid MC, et al. Crosstalk between ubiquitin and other post-translational modifications on chromatin during double-strand break repair. Trends Cell Biol. 2014;24(7):426–434.
- Hentschel A, Zahedi RP, Ahrends R. Protein lipid modifications–More than just a greasy ballast. Proteomics. 2016;16(5):759–782.
- Ruan HB, Nie Y, Yang X. Regulation of protein degradation by O-GlcNAcylation: crosstalk with ubiquitination. Molecular & cellular proteomics: MCP. 2013;12(12):3489–3497.
- Hart GW, Greis KD, Dong LY, et al. O-linked N-acetylglucosamine: the “yin-yang” of Ser/Thr phosphorylation? Nuclear and cytoplasmic glycosylation. Adv Exp Med Biol. 1995;376:115–123.
- Creixell P, Linding R. Cells shared memory and breaking the PTM code. Molecul sys bio. 2012;8:598.
- Benayoun BA, Veitia RA. A post-translational modification code for transcription factors: sorting through a sea of signals. Trends Cell Biol. 2009;19(5):189–197.
- Gu B, Zhu WG. Surf the post-translational modification network of p53 regulation. Int J Biol Sci. 2012;8(5):672–684.
- Venne AS, Kollipara L, Zahedi RP. The next level of complexity: crosstalk of posttranslational modifications. Proteomics. 2014;14(4–5):513–524.
- Solari FA, Dell’Aica M, Sickmann A, et al. Why phosphoproteomics is still a challenge. Mol Biosyst. 2015;11(6):1487–1493.
- Ren J, Jiang C, Gao X, et al. PhosSNP for systematic analysis of genetic polymorphisms that influence protein phosphorylation. Molecular & cellular proteomics: MCP. 2010;9(4):623–634.
- Ruggles KV, Krug K, Wang X, et al. Methods, Tools and Current Perspectives in Proteogenomics. Molecular & cellular proteomics: MCP. 2017;16(6):959–981.
- Slamon DJ, Clark GM, Wong SG, et al. Human breast cancer: correlation of relapse and survival with amplification of the HER-2/neu oncogene. Science. 1987;235(4785):177–182.
- Yuste L, Montero JC, Esparis-Ogando A, et al. Activation of ErbB2 by overexpression or by transmembrane neuregulin results in differential signaling and sensitivity to herceptin. Cancer Res. 2005;65(15):6801–6810.
- Paez JG, Janne PA, Lee JC, et al. EGFR mutations in lung cancer: correlation with clinical response to gefitinib therapy. Science. 2004;304(5676):1497–1500.
- Klootwijk ED, Reichold M, Helip-Wooley A, et al. Mistargeting of peroxisomal EHHADH and inherited renal Fanconi’s syndrome. N Engl J Med. 2014;370(2):129–138.
- Ohno M. Roles of eIF2alpha kinases in the pathogenesis of Alzheimer’s disease. Front Mol Neurosci. 2014;7:22.
- Seeling M, Bruckner C, Nimmerjahn F. Differential antibody glycosylation in autoimmunity: sweet biomarker or modulator of disease activity? Nat Rev Rheumatol. 2017;13(10):621–630.
- Sherrill JD, Stropes MP, Schneider OD, et al. Activation of intracellular signaling pathways by the murine cytomegalovirus G protein-coupled receptor M33 occurs via PLC-{beta}/PKC-dependent and -independent mechanisms. J Virol. 2009;83(16):8141–8152.
- Powers AD, Palecek SP. Protein analytical assays for diagnosing, monitoring, and choosing treatment for cancer patients. J Healthc Eng. 2012;3(4):503–534.
- Chandler K, Goldman R. Glycoprotein disease markers and single protein-omics. Molecular & cellular proteomics: MCP. 2013;12(4):836–845.
- Van Scherpenzeel M, Willems E, Lefeber DJ. Clinical diagnostics and therapy monitoring in the congenital disorders of glycosylation. Glycoconj J. 2016;33(3):345–358.
- Abdel-Kahaar E, Kabakchiev M, Hartmann B, et al. Performance of a phosphoflow assay to determine phosphorylation of S6 ribosomal protein as a pharmacodynamic read out for mTOR inhibition. Clin Biochem. 2016;49(15):1181–1187.
- Rahbar S, Blumenfeld O, Ranney HM. Studies of an unusual hemoglobin in patients with diabetes mellitus. Biochem Biophys Res Commun. 1969;36(5):838–843.
- Selvin E, Steffes MW, Zhu H, et al. Glycated hemoglobin, diabetes, and cardiovascular risk in nondiabetic adults. N Engl J Med. 2010;362(9):800–811.
- Schwarz UR, Geiger J, Walter U, et al. Flow cytometry analysis of intracellular VASP phosphorylation for the assessment of activating and inhibitory signal transduction pathways in human platelets–definition and detection of ticlopidine/clopidogrel effects. Thromb Haemost. 1999;82(3):1145–1152.
- Huang KL, Li S, Mertins P, et al. Proteogenomic integration reveals therapeutic targets in breast cancer xenografts. Nat Commun. 2017;8:14864.
- Heist RS, Christiani D. EGFR-targeted therapies in lung cancer: predictors of response and toxicity. Pharmacogenomics. 2009;10(1):59–68.
- Mertins P, Mani DR, Ruggles KV, et al. Proteogenomics connects somatic mutations to signalling in breast cancer. Nature. 2016;534(7605):55–62.
- Salvagno GL, Danese E, Lippi G. Preanalytical variables for liquid chromatography-mass spectrometry (LC-MS) analysis of human blood specimens. Clin Biochem. 2017;50(10–11):582–586.
- Longo DL. Tumor heterogeneity and personalized medicine. N Engl J Med. 2012;366(10):956–957.
- Maes E, Mertens I, Valkenborg D, et al. Proteomics in cancer research: are we ready for clinical practice? Crit Rev Oncol Hematol. 2015;96(3):437–448.
- Burkhart JM, Vaudel M, Gambaryan S, et al. The first comprehensive and quantitative analysis of human platelet protein composition allows the comparative analysis of structural and functional pathways. Blood. 2012;120(15):e73–82.
- Skold K, Alm H, Scholz B. The impact of biosampling procedures on molecular data interpretation. Molecular & cellular proteomics: MCP. 2013;12(6):1489–1501.
- Aasebo E, Mjaavatten O, Vaudel M, et al. Freezing effects on the acute myeloid leukemia cell proteome and phosphoproteome revealed using optimal quantitative workflows. J Proteomics. 2016;145:214–225.
- Lalmahomed ZS, Coebergh van den Braak RR, Mh O, et al. Multicenter fresh frozen tissue sampling in colorectal cancer: does the quality meet the standards for state of the art biomarker research? Cell tissue banking 2017;18(3):425–431.
- Ivanov AR, Colangelo CM, Dufresne CP, et al. Interlaboratory studies and initiatives developing standards for proteomics. Proteomics. 2013;13(6):904–909.
- Percy AJ, Yang J, Chambers AG, et al. Protocol for Standardizing High-to-Moderate Abundance Protein Biomarker Assessments Through an MRM-with-Standard-Peptides Quantitative Approach. Adv Exp Med Biol. 2016;919:515–530.
- Percy AJ, Yang J, Hardie DB, et al. Precise quantitation of 136 urinary proteins by LC/MRM-MS using stable isotope labeled peptides as internal standards for biomarker discovery and/or verification studies. Methods. 2015;81:24–33.
- Percy AJ, Chambers AG, Smith DS, et al. Standardized protocols for quality control of MRM-based plasma proteomic workflows. J Proteome Res. 2013;12(1):222–233.
- Percy AJ, Chambers AG, Yang J, et al. Method and platform standardization in MRM-based quantitative plasma proteomics. J Proteomics. 2013;95:66–76.
- Malm J, Fehniger TE, Danmyr P, et al. Developments in biobanking workflow standardization providing sample integrity and stability. J Proteomics. 2013;95:38–45.
- Casadonte R, Caprioli RM. Proteomic analysis of formalin-fixed paraffin-embedded tissue by MALDI imaging mass spectrometry. Nat Protoc. 2011;6(11):1695–1709.
- Ostasiewicz P, Wisniewski JRA. Protocol for Large-Scale Proteomic Analysis of Microdissected Formalin Fixed and Paraffin Embedded Tissue. Methods Enzymol. 2017;585:159–176.
- Kennedy JJ, Whiteaker JR, Schoenherr RM, et al. Optimized Protocol for Quantitative Multiple Reaction Monitoring-Based Proteomic Analysis of Formalin-Fixed, Paraffin-Embedded Tissues. J Proteome Res. 2016;15(8):2717–2728.
- Dickhut C, Radau S, Zahedi RP. Fast, efficient, and quality-controlled phosphopeptide enrichment from minute sample amounts using titanium dioxide. Methods in molecular biology. 2014;1156:417–430.
- Burkhart JM, Premsler T, Sickmann A. Quality control of nano-LC-MS systems using stable isotope-coded peptides. Proteomics. 2011;11(6):1049–1057.
- Muller T, Winter D. Systematic Evaluation of Protein Reduction and Alkylation Reveals Massive Unspecific Side Effects by Iodine-containing Reagents. Molecular & cellular proteomics: MCP. 2017;16(7):1173–1187.
- Burkhart JM, Schumbrutzki C, Wortelkamp S, et al. Systematic and quantitative comparison of digest efficiency and specificity reveals the impact of trypsin quality on MS-based proteomics. J Proteomics. 2012;75(4):1454–1462.
- Burkhart JM, Vaudel M, Zahedi RP, et al. iTRAQ protein quantification: a quality-controlled workflow. Proteomics. 2011;11(6):1125–1134.
- Bittremieux W, Tabb DL, Impens F, et al. Quality control in mass spectrometry-based proteomics. Mass Spectrom Rev. 2017. Epub ahead of print.
- Percy AJ, Mohammed Y, Yang J, et al. A standardized kit for automated quantitative assessment of candidate protein biomarkers in human plasma. Bioanalysis. 2015;7(23):2991–3004.
- Zolg DP, Wilhelm M, Yu P, et al. PROCAL: A set of 40 peptide standards for retention time indexing, column performance monitoring and collision energy calibration. Proteomics. 2017;17(21).
- Pichler P, Mazanek M, Dusberger F, et al. SIMPATIQCO: a server-based software suite which facilitates monitoring the time course of LC-MS performance metrics on Orbitrap instruments. J Proteome Res. 2012;11(11):5540–5547.
- Bereman MS. Tools for monitoring system suitability in LC MS/MS centric proteomic experiments. Proteomics. 2015;15(5–6):891–902.
- Sandin M, Teleman J, Malmstrom J, et al. Data processing methods and quality control strategies for label-free LC-MS protein quantification. Biochim Biophys Acta. 2014;1844(1Pt A):29–41.
- Mohammed Y, Percy AJ, Chambers AG, et al. Qualis-SIS: automated standard curve generation and quality assessment for multiplexed targeted quantitative proteomic experiments with labeled standards. J Proteome Res. 2015;14(2):1137–1146.
- Aittokallio T. Dealing with missing values in large-scale studies: microarray data imputation and beyond. Brief Bioinform. 2010;11(2):253–264.
- Lazar C, Gatto L, Ferro M, et al. Accounting for the Multiple Natures of Missing Values in Label-Free Quantitative Proteomics Data Sets to Compare Imputation Strategies. J Proteome Res. 2016;15(4):1116–1125.
- Tyanova S, Temu T, Sinitcyn P, et al. The Perseus computational platform for comprehensive analysis of (prote)omics data. Nature methods. 2016;13(9):731–740.
- Carr SA, Abbatiello SE, Ackermann BL, et al. Targeted peptide measurements in biology and medicine: best practices for mass spectrometry-based assay development using a fit-for-purpose approach. Molecular & cellular proteomics: MCP. 2014;13(3):907–917.
- Ebhardt HA, Root A, Sander C, et al. Applications of targeted proteomics in systems biology and translational medicine. Proteomics. 2015;15(18):3193–3208.
- Anderson L, Hunter CL. Quantitative mass spectrometric multiple reaction monitoring assays for major plasma proteins. Molecular & cellular proteomics: MCP. 2006;5(4):573–588.
- Ta A, Se A, Schilling B, et al. Multi-site assessment of the precision and reproducibility of multiple reaction monitoring-based measurements of proteins in plasma. Nat Biotechnol. 2009;27(7):633–641.
- Peterson AC, Russell JD, Bailey DJ, et al. Parallel reaction monitoring for high resolution and high mass accuracy quantitative, targeted proteomics. Molecular & cellular proteomics: MCP. 2012;11(11):1475–1488.
- Cox J, Mann M. MaxQuant enables high peptide identification rates, individualized p.p.b.-range mass accuracies and proteome-wide protein quantification. Nat Biotechnol. 2008;26(12):1367–1372.
- Sturm M, Bertsch A, Gropl C, et al. OpenMS - an open-source software framework for mass spectrometry. BMC bioinformatics. 2008;9:163.
- Rost HL, Sachsenberg T, Aiche S, et al. OpenMS: a flexible open-source software platform for mass spectrometry data analysis. Nature methods. 2016;13(9):741–748.
- Chalkley RJ, Clauser KR. Modification site localization scoring: strategies and performance. Molecular & cellular proteomics: MCP. 2012;11(5):3–14.
- Beck F, Lewandrowski U, Wiltfang M, et al. The good, the bad, the ugly: validating the mass spectrometric analysis of modified peptides. Proteomics. 2011;11(6):1099–1109.
- Mikesh LM, Ueberheide B, Chi A, et al. The utility of ETD mass spectrometry in proteomic analysis. Biochim Biophys Acta. 2006;1764(12):1811–1822.
- Gillet LC, Navarro P, Tate S, et al. Targeted data extraction of the MS/MS spectra generated by data-independent acquisition: a new concept for consistent and accurate proteome analysis. Molecular & cellular proteomics: MCP. 2012;11(6):O111 016717.
- Simburger JM, Dettmer K, Oefner PJ, et al. Optimizing the SWATH-MS-workflow for label-free proteomics. J Proteomics. 2016;145:137–140.
- Distler U, Kuharev J, Navarro P, et al. Label-free quantification in ion mobility-enhanced data-independent acquisition proteomics. Nat Protoc. 2016;11(4):795–812.
- Percy AJ, Chambers AG, Yang J, et al. Comparison of standard- and nano-flow liquid chromatography platforms for MRM-based quantitation of putative plasma biomarker proteins. Anal Bioanal Chem. 2012;404(4):1089–1101.
- Ross PL, Huang YN, Marchese JN, et al. Multiplexed protein quantitation in Saccharomyces cerevisiae using amine-reactive isobaric tagging reagents. Molecular & cellular proteomics: MCP. 2004;3(12):1154–1169.
- Treitz C, Cassidy L, Hockendorf A, et al. Quantitative proteome analysis of Caenorhabditis elegans upon exposure to nematicidal Bacillus thuringiensis. J Proteomics. 2015;113:337–350.
- Thompson A, Schafer J, Kuhn K, et al. Tandem mass tags: a novel quantification strategy for comparative analysis of complex protein mixtures by MS/MS. Anal Chem. 2003;75(8):1895–1904.
- Erickson BK, Jedrychowski MP, McAlister GC, et al. Evaluating multiplexed quantitative phosphopeptide analysis on a hybrid quadrupole mass filter/linear ion trap/Orbitrap mass spectrometer. Anal Chem. 2015;87(2):1241–1249.
- Venne AS, Solari, FA, Faden F, et al. An improved workflow for quantitative N-terminal charge-based fractional diagonal chromatography (ChaFRADIC) to study proteolytic events in Arabidopsis thaliana. Proteomics. 2015;15(14):2458–69.
- Hoffert JD, Pisitkun T, Saeed F, et al. Dynamics of the G protein-coupled vasopressin V2 receptor signaling network revealed by quantitative phosphoproteomics. Molecular & cellular proteomics: MCP. 2012;11(2):M111 014613.
- Parker BL, Palmisano G, Edwards AV, et al. Quantitative N-linked glycoproteomics of myocardial ischemia and reperfusion injury reveals early remodeling in the extracellular environment. Molecular & cellular proteomics: MCP. 2011;10(8):M110 006833.
- Prudova A, Auf Dem Keller U, Butler GS, et al. Multiplex N-terminome analysis of MMP-2 and MMP-9 substrate degradomes by iTRAQ-TAILS quantitative proteomics. Molecular & cellular proteomics: MCP. 2010;9(5):894–911.
- Melo-Braga MN, Verano-Braga T, Leon IR, et al. Modulation of protein phosphorylation, N-glycosylation and Lys-acetylation in grape (Vitis vinifera) mesocarp and exocarp owing to Lobesia botrana infection. Molecular & cellular proteomics: MCP. 2012;11(10):945–956.
- Huang H, Haar Petersen M, Ibanez-Vea M, et al. Simultaneous Enrichment of Cysteine-containing Peptides and Phosphopeptides Using a Cysteine-specific Phosphonate Adaptable Tag (CysPAT) in Combination with titanium dioxide (TiO2) Chromatography. Mol Cell Proteomics. 2016;15(10):3282–3296.
- Erickson BK, Jedrychowski MP, McAlister GC, et al. Evaluating multiplexed quantitative phosphopeptide analysis on a hybrid quadrupole mass filter/linear ion trap/orbitrap mass spectrometer. Anal Chem. 2015;87(2):1241–1249.
- Vaudel M, Burkhart JM, Radau S, et al. Integral quantification accuracy estimation for reporter ion-based quantitative proteomics (iQuARI). J Proteome Res. 2012;11(10):5072–5080.
- Karp NA, Huber W, Sadowski PG, et al. Addressing accuracy and precision issues in iTRAQ quantitation. Molecular & cellular proteomics: MCP. 2010;9(9):1885–1897.
- Gillette MA, Carr SA. Quantitative analysis of peptides and proteins in biomedicine by targeted mass spectrometry. Nature methods. 2013;10(1):28–34.
- Rose CM, Merrill AE, Bailey DJ, et al. Neutron encoded labeling for peptide identification. Anal Chem. 2013;85(10):5129–5137.
- Potts GK, Voigt EA, Bailey DJ, et al. Neucode Labels for Multiplexed, Absolute Protein Quantification. Anal Chem. 2016;88(6):3295–3303.
- Boesch AW, Zhao Y, Landman AS, et al. A multiplexed assay to detect antimicrobial peptides in biological fluids and cell secretions. J Immunol Methods. 2013;397(1–2):71–76.
- Treindl F, Ruprecht B, Beiter Y, et al. A bead-based western for high-throughput cellular signal transduction analyses. Nat Commun. 2016;7:12852.
- Shi T, Song E, Nie S, et al. Advances in targeted proteomics and applications to biomedical research. Proteomics. 2016;16(15-16):2160–2182.
- Bourmaud A, Gallien S, Domon B. Parallel reaction monitoring using quadrupole-Orbitrap mass spectrometer: principle and applications. Proteomics. 2016;16(15-16):2146–2159.
- Domon B, Gallien S. Recent advances in targeted proteomics for clinical applications. Proteomics Clin Appl. 2015;9(3–4):423–431.
- Mohammed Y, Domanski D, Jackson AM, et al. PeptidePicker: a scientific workflow with web interface for selecting appropriate peptides for targeted proteomics experiments. J Proteomics. 2014;106:151–161.
- Se A, Dr M, Schilling B, et al. Design, implementation and multisite evaluation of a system suitability protocol for the quantitative assessment of instrument performance in liquid chromatography-multiple reaction monitoring-MS (LC-MRM-MS). Molecular & cellular proteomics: MCP. 2013;12(9):2623–2639.
- Whiteaker JR, Halusa GN, Hoofnagle AN, et al. CPTAC Assay Portal: a repository of targeted proteomic assays. Nature methods. 2014;11(7):703–704.
- Beck F, Geiger J, Gambaryan S, et al. Temporal quantitative phosphoproteomics of ADP stimulation reveals novel central nodes in platelet activation and inhibition. Blood. 2017;129(2):e1–e12.
- Beck F, Geiger J, Gambaryan S, et al. Time-resolved characterization of cAMP/PKA-dependent signaling reveals that platelet inhibition is a concerted process involving multiple signaling pathways. Blood. 2014;123(5):e1–e10.
- Anderson NL, Anderson NG, Haines LR, et al. Mass spectrometric quantitation of peptides and proteins using Stable Isotope Standards and Capture by Anti-Peptide Antibodies (SISCAPA). J Proteome Res. 2004;3(2):235–244.
- Razavi M, Frick LE, LaMarr WA, et al. High-throughput SISCAPA quantitation of peptides from human plasma digests by ultrafast, liquid chromatography-free mass spectrometry. J Proteome Res. 2012;11(12):5642–5649.
- Lin D, Alborn WE, Slebos RJ, et al. Comparison of protein immunoprecipitation-multiple reaction monitoring with ELISA for assay of biomarker candidates in plasma. J Proteome Res. 2013;12(12):5996–6003.
- Popp R, Basik M, Spatz A, et al. How iMALDI can improve clinical diagnostics. Analyst. 2018;143(10):2197–2203.
- Li H, Popp R, Frohlich B, et al. Peptide and Protein Quantification Using Automated Immuno-MALDI (iMALDI). Journal of visualized experiments: JoVE. 2017 126.
- Jiang J, Parker CE, Hoadley KA, et al. Development of an immuno tandem mass spectrometry (iMALDI) assay for EGFR diagnosis. Proteomics Clin Appl. 2007;1(12):1651–1659.
- Popp R, Li H, LeBlanc A, et al. Immuno-Matrix-Assisted Laser Desorption/Ionization Assays for Quantifying AKT1 and AKT2 in Breast and Colorectal Cancer Cell Lines and Tumors. Anal Chem. 2017;89(19):10592–10600.
- Hoeppe S, Schreiber TD, Planatscher H, et al. Targeting peptide termini, a novel immunoaffinity approach to reduce complexity in mass spectrometric protein identification. Molecular & cellular proteomics: MCP. 2011;10(2):M110 002857.
- Marth JD, Grewal PK. Mammalian glycosylation in immunity. Nat Rev Immunol. 2008;8(11):874–887.
- Varinou L, Ramsauer K, Karaghiosoff M, et al. Phosphorylation of the Stat1 transactivation domain is required for full-fledged IFN-gamma-dependent innate immunity. Immunity. 2003;19(6):793–802.
- Kaneko Y, Nimmerjahn F, Ravetch JV. Anti-inflammatory activity of immunoglobulin G resulting from Fc sialylation. Science. 2006;313(5787):670–673.
- Viatour P, Merville MP, Bours V, et al. Phosphorylation of NF-kappaB and IkappaB proteins: implications in cancer and inflammation. Trends Biochem Sci. 2005;30(1):43–52.
- Hakomori S. Tumor malignancy defined by aberrant glycosylation and sphingo(glyco)lipid metabolism. Cancer Res. 1996;56(23):5309–5318.
- Hwang RF, Yokoi K, Bucana CD, et al. Inhibition of platelet-derived growth factor receptor phosphorylation by STI571 (Gleevec) reduces growth and metastasis of human pancreatic carcinoma in an orthotopic nude mouse model. Clinical cancer research: an official journal of the American Association for Cancer Research. 2003;9(17):6534–6544.
- Tepper K, Biernat J, Kumar S, et al. Oligomer formation of tau protein hyperphosphorylated in cells. J Biol Chem. 2014;289(49):34389–34407.
- Grundke-Iqbal I, Iqbal K, Tung YC, et al. Abnormal phosphorylation of the microtubule-associated protein tau (tau) in Alzheimer cytoskeletal pathology. Proc Natl Acad Sci U S A. 1986;83(13):4913–4917.
- Wang JZ, Grundke-Iqbal I, Iqbal K. Glycosylation of microtubule-associated protein tau: an abnormal posttranslational modification in Alzheimer’s disease. Nat Med. 1996;2(8):871–875.
- Scheuner D, Mierde DV, Song B, et al. Control of mRNA translation preserves endoplasmic reticulum function in beta cells and maintains glucose homeostasis. Nat Med. 2005;11(7):757–764.
- Ortsäter H, Grankvist N, Honkanen RE, et al. Protein phosphatases in pancreatic islets. J Endocrinol. 2014;221(3):R121–R144.
- Meyerovitch J, Backer JM, Kahn CR. Hepatic phosphotyrosine phosphatase activity and its alterations in diabetic rats. J Clin Invest. 1989;84(3):976–983.
- Brownlee M. Advanced protein glycosylation in diabetes and aging. Annu Rev Med. 1995;46:223–234.
- Blume-Jensen P, Hunter T. Oncogenic kinase signalling. Nature. 2001;411(6835):355–365.
- Zanivan S, Meves A, Behrendt K, et al. In vivo SILAC-based proteomics reveals phosphoproteome changes during mouse skin carcinogenesis. Cell Rep. 2013;3(2):552–566.
- Huelsemann MF, Patz M, Beckmann L, et al. Hypoxia-induced p38 MAPK activation reduces Mcl-1 expression and facilitates sensitivity towards BH3 mimetics in chronic lymphocytic leukemia. Leukemia. 2015;29(4):981–984.
- Hakomori S. Glycosylation defining cancer malignancy: new wine in an old bottle. Proc Natl Acad Sci U S A. 2002;99(16):10231–10233.
- Decker RS, Decker ML, Kulikovskaya I, et al. Myosin-binding protein C phosphorylation, myofibril structure, and contractile function during low-flow ischemia. Circulation. 2005;111(7):906–912.
- El-Armouche A, Pohlmann L, Schlossarek S, et al. Decreased phosphorylation levels of cardiac myosin-binding protein-C in human and experimental heart failure. J Mol Cell Cardiol. 2007;43(2):223–229.
- Schoutsen B, Blom JJ, Verdouw PD, et al. Calcium transport and phospholamban in sarcoplasmic reticulum of ischemic myocardium. J Mol Cell Cardiol. 1989;21(7):719–727.
- Nc T, Ab H, Jr G, et al. Quantitative analysis of cell signaling and drug action via mass spectrometry-based systems level phosphoproteomics. Proteomics. 2009;9(6):1469–1487.
- Kumar A, Baycin-Hizal D, Shiloach J, et al. Coupling enrichment and proteomics methods for understanding and treating disease. Proteomics Clin Appl. 2015;9(1–2):33–47.
- Liu T, Qian WJ, Gritsenko MA, et al. Human plasma N-glycoproteome analysis by immunoaffinity subtraction, hydrazide chemistry, and mass spectrometry. J Proteome Res. 2005;4(6):2070–2080.
- Jung K, Cho W, Regnier FE. Glycoproteomics of plasma based on narrow selectivity lectin affinity chromatography. J Proteome Res. 2009;8(2):643–650.
- Wang L, Li F, Sun W, et al. Concanavalin A-captured glycoproteins in healthy human urine. Molecular & cellular proteomics: MCP. 2006;5(3):560–562.
- Lewandrowski U, Moebius J, Walter U, et al. Elucidation of N-glycosylation sites on human platelet proteins: a glycoproteomic approach. Molecular & cellular proteomics: MCP. 2006;5(2):226–233.
- Block TM, Comunale MA, Lowman M, et al. Use of targeted glycoproteomics to identify serum glycoproteins that correlate with liver cancer in woodchucks and humans. Proc Natl Acad Sci U S A. 2005;102(3):779–784.
- Zhao J, Simeone DM, Heidt D, et al. Comparative serum glycoproteomics using lectin selected sialic acid glycoproteins with mass spectrometric analysis: application to pancreatic cancer serum. J Proteome Res. 2006;5(7):1792–1802.
- Alley WR Jr., Vasseur JA, Goetz JA, et al. N-linked glycan structures and their expressions change in the blood sera of ovarian cancer patients. J Proteome Res. 2012;11(4):2282–2300.
- Sonneveld ME, de Haas M, Koeleman C, et al. Patients with IgG1-anti-red blood cell autoantibodies show aberrant Fc-glycosylation. Sci Rep. 2017;7(1):8187.
- Jin C, Kenny DT, Skoog EC, et al. Structural diversity of human gastric mucin glycans. Molecular & cellular proteomics: MCP. 2017;16(5):743–758.
- Hinneburg H, Korac P, Schirmeister F, et al. Unlocking Cancer Glycomes from Histopathological Formalin-fixed and Paraffin-embedded (FFPE) Tissue Microdissections. Molecular & cellular proteomics: MCP. 2017;16(4):524–536.
- Pagel O, Loroch S, Sickmann A, et al. Current strategies and findings in clinically relevant post-translational modification-specific proteomics. Expert Rev Proteomics. 2015;12(3):235–253.
- von Stechow L, Francavilla C, Olsen JV. Recent findings and technological advances in phosphoproteomics for cells and tissues. Expert Rev Proteomics. 2015;12(5):469–487.
- Engholm-Keller K, Larsen MR. Technologies and challenges in large-scale phosphoproteomics. Proteomics. 2013;13(6):910–931.
- Riley NM, Coon JJ. Phosphoproteomics in the Age of Rapid and Deep Proteome Profiling. Anal Chem. 2016;88(1):74–94.
- Engholm-Keller K, Birck P, Storling J, et al. TiSH–a robust and sensitive global phosphoproteomics strategy employing a combination of TiO2, SIMAC, and HILIC. J Proteomics. 2012;75(18):5749–5761.
- Geiger T, Cox J, Ostasiewicz P, et al. Super-SILAC mix for quantitative proteomics of human tumor tissue. Nature methods. 2010;7(5):383–385.
- Schweppe DK, Rigas JR, Gerber SA. Quantitative phosphoproteomic profiling of human non-small cell lung cancer tumors. J Proteomics. 2013;91:286–296.
- Dazert E, Colombi M, Boldanova T, et al. Quantitative proteomics and phosphoproteomics on serial tumor biopsies from a sorafenib-treated HCC patient. Proc Natl Acad Sci U S A. 2016;113(5):1381–1386.
- Kennedy JJ, Yan P, Zhao L, et al. Immobilized Metal Affinity Chromatography Coupled to Multiple Reaction Monitoring Enables Reproducible Quantification of Phospho-signaling. Molecular & cellular proteomics: MCP. 2016;15(2):726–739.
- de Graaf EL, Kaplon J, Mohammed S, et al. Signal Transduction Reaction Monitoring Deciphers Site-Specific PI3K-mTOR/MAPK Pathway Dynamics in Oncogene-Induced Senescence. J Proteome Res. 2015;14(7):2906–2914.
- Loroch S, Zahedi RP, Sickmann A. Highly sensitive phosphoproteomics by tailoring solid-phase extraction to electrostatic repulsion-hydrophilic interaction chromatography. Anal Chem. 2015;87(3):1596–1604.
- Alpert AJ. Electrostatic repulsion hydrophilic interaction chromatography for isocratic separation of charged solutes and selective isolation of phosphopeptides. Anal Chem. 2008;80(1):62–76.
- Di Conza G, Trusso Cafarello S, Loroch S, et al. The mTOR and PP2A Pathways Regulate PHD2 Phosphorylation to Fine-Tune HIF1alpha Levels and Colorectal Cancer Cell Survival under Hypoxia. Cell Rep. 2017;18(7):1699–1712.
- Chien KY, Liu HC, Goshe MB. Development and application of a phosphoproteomic method using electrostatic repulsion-hydrophilic interaction chromatography (ERLIC), IMAC, and LC-MS/MS analysis to study Marek’s Disease Virus infection. J Proteome Res. 2011;10(9):4041–4053.
- Hao P, Ren Y, Dutta B, et al. Comparative evaluation of electrostatic repulsion-hydrophilic interaction chromatography (ERLIC) and high-pH reversed phase (Hp-RP) chromatography in profiling of rat kidney proteome. J Proteomics. 2013;82:254–262.
- Chen X, Wu D, Zhao Y, et al. Increasing phosphoproteome coverage and identification of phosphorylation motifs through combination of different HPLC fractionation methods. J Chromatogr B Analyt Technol Biomed Life Sci. 2011;879(1):25–34.
- Mertins P, Yang F, Liu T, et al. Ischemia in tumors induces early and sustained phosphorylation changes in stress kinase pathways but does not affect global protein levels. Molecular & cellular proteomics: MCP. 2014;13(7):1690–1704.
- Gajadhar AS, Johnson H, Slebos RJ, et al. Phosphotyrosine signaling analysis in human tumors is confounded by systemic ischemia-driven artifacts and intra-specimen heterogeneity. Cancer Res. 2015;75(7):1495–1503.
- Petrera A, Lai ZW, Schilling O. Carboxyterminal Protein Processing in Health and Disease: key Actors and Emerging Technologies. J Proteome Res. 2014;13(11):4497–4504.
- Mossmann D, Vögtle FN, Taskin Asli A, et al. Amyloid-β Peptide Induces Mitochondrial Dysfunction by Inhibition of Preprotein Maturation. Cell Metab. 2014;20(4):662–669.
- McCarty SM, Percival SL. Proteases and Delayed Wound Healing. Advances in wound care. 2013;2(8):438–447.
- Csiszar A, Kutay B, Wirth S, et al. Interleukin-like epithelial-to-mesenchymal transition inducer activity is controlled by proteolytic processing and plasminogen-urokinase plasminogen activator receptor system-regulated secretion during breast cancer progression. Breast cancer research: BCR. 2014;16(5):433.
- Gevaert K, Goethals M, Martens L, et al. Exploring proteomes and analyzing protein processing by mass spectrometric identification of sorted N-terminal peptides. Nat Biotechnol. 2003;21(5):566–569.
- Kleifeld O, Doucet A, Auf Dem Keller U, et al. Isotopic labeling of terminal amines in complex samples identifies protein N-termini and protease cleavage products. Nat Biotech. 2010;28(3):281–288.
- Venne AS, Vogtle FN, Meisinger C, et al. Novel highly sensitive, specific, and straightforward strategy for comprehensive N-terminal proteomics reveals unknown substrates of the mitochondrial peptidase Icp55. J Proteome Res. 2013;12(9):3823–3830.
- Mahrus S, Trinidad JC, Barkan DT, et al. Global sequencing of proteolytic cleavage sites in apoptosis by specific labeling of protein N termini. Cell. 2008;134(5):866–876.
- Dix MM, Simon GM, Cravatt BF. Global identification of caspase substrates using PROTOMAP (protein topography and migration analysis platform). Methods in molecular biology. 2014;1133:61–70.
- Segura V, Garin-Muga A, Guruceaga E, et al. Progress and pitfalls in finding the ‘missing proteins’ from the human proteome map. Expert Rev Proteomics. 2017;14(1):9–14.
- Baker MS, Ahn SB, Mohamedali A, et al. Accelerating the search for the missing proteins in the human proteome. Nat Commun. 2017;8:14271.
- Lange PF, Huesgen PF, Nguyen K, et al. Annotating N Termini for the Human Proteome Project: N Termini and Nα-Acetylation Status Differentiate Stable Cleaved Protein Species from Degradation Remnants in the Human Erythrocyte Proteome. J Proteome Res. 2014;13(4):2028–2044.
- Eckhard U, Marino G, Abbey SR, et al. The Human Dental Pulp Proteome and N-Terminome: Levering the Unexplored Potential of Semitryptic Peptides Enriched by TAILS to Identify Missing Proteins in the Human Proteome Project in Underexplored Tissues. J Proteome Res. 2015;14(9):3568–3582.
- Klein T, Fung S-Y, Renner F, et al. The paracaspase MALT1 cleaves HOIL1 reducing linear ubiquitination by LUBAC to dampen lymphocyte NF-κB signalling. 2015;6:8777.
- Wildes D, Wells JA. Sampling the N-terminal proteome of human blood. Proc Natl Acad Sci U S A. 2010;107(10):4561–4566.
- Wiita AP, Hsu GW, Lu CM, et al. Circulating proteolytic signatures of chemotherapy-induced cell death in humans discovered by N-terminal labeling. Proc Natl Acad Sci U S A. 2014;111(21):7594–7599. .
- Solari FA, Mattheij NJ, Burkhart JM, et al. Combined Quantification of the Global Proteome, Phosphoproteome, and Proteolytic Cleavage to Characterize Altered Platelet Functions in the Human Scott Syndrome. Molecular & cellular proteomics: MCP. 2016;15(10):3154–3169.
- Shema G, Nguyen MTN, Solari FA, et al. Simple, scalable, and ultrasensitive tip-based identification of protease substrates. Mol Cell Proteomics. 2018;17(4):826–834.
- Chung HS, Wang SB, Venkatraman V, et al. Cysteine oxidative posttranslational modifications: emerging regulation in the cardiovascular system. Circ Res. 2013;112(2):382–392.
- Kim HJ, Ha S, Lee HY, et al. ROSics: chemistry and proteomics of cysteine modifications in redox biology. Mass Spectrom Rev. 2015;34(2):184–208.
- Gould N, Doulias PT, Tenopoulou M, et al. Regulation of protein function and signaling by reversible cysteine S-nitrosylation. J Biol Chem. 2013;288(37):26473–26479.
- Waszczak C, Akter S, Jacques S, et al. Oxidative post-translational modifications of cysteine residues in plant signal transduction. J Exp Bot. 2015;66(10):2923–2934.
- Nietzel T, Mostertz J, Hochgrafe F, et al. Redox regulation of mitochondrial proteins and proteomes by cysteine thiol switches. Mitochondrion. 2016;33:72–83.
- Sun J, Protein ME. S-nitrosylation and cardioprotection. Circ Res. 2010;106(2):285–296.
- Watanabe Y, Cohen RA, Matsui R. Redox Regulation of Ischemic Angiogenesis- Another Aspect of Reactive Oxygen Species. Circ J. 2016;80(6):1278–1284.
- Wang SB, Foster DB, Rucker J, et al. Redox regulation of mitochondrial ATP synthase: implications for cardiac resynchronization therapy. Circ Res. 2011;109(7):750–757.
- Yuan K, Liu Y, Chen HN, et al. Thiol-based redox proteomics in cancer research. Proteomics. 2015;15(2–3):287–299.
- Murphy E, Kohr M, Menazza S, et al. Signaling by S-nitrosylation in the heart. J Mol Cell Cardiol. 2014;73:18–25.
- Butterfield DA, Dalle-Donne I. Redox proteomics: from protein modifications to cellular dysfunction and disease. Mass Spectrom Rev. 2014;33(1):1–6.
- Raju K, Doulias PT, Evans P, et al. Regulation of brain glutamate metabolism by nitric oxide and S-nitrosylation. Sci Signal. 2015;8(384):ra68.
- Duan J, Gaffrey MJ, Qian WJ. Quantitative proteomic characterization of redox-dependent post-translational modifications on protein cysteines. Mol Biosyst. 2017;13(5):816–829.
- McDonagh B. Detection of ROS Induced Proteomic Signatures by Mass Spectrometry. Front Physiol. 2017;8:470.
- Nagumo K, Tanaka M, Chuang VT, et al. Cys34-cysteinylated human serum albumin is a sensitive plasma marker in oxidative stress-related chronic diseases. PLoS One. 2014;9(1):e85216.
- Delobel J, Prudent M, Crettaz D, et al. Cysteine redox proteomics of the hemoglobin-depleted cytosolic fraction of stored red blood cells. Proteomics Clin Appl. 2016;10(8):883–893.
- Sonego G, Abonnenc M, Tissot JD, et al. Redox Proteomics and Platelet Activation: Understanding the Redox Proteome to Improve Platelet Quality for Transfusion. Int J Mol Sci. 2017;18:2.
- Wojdyla K, Williamson J, Roepstorff P, et al. SNO/SOH TMT strategy for combinatorial analysis of reversible cysteine oxidations. J Proteomics. 2015;113:415–434.
- Guo J, Gaffrey MJ, Su D, et al. Resin-assisted enrichment of thiols as a general strategy for proteomic profiling of cysteine-based reversible modifications. Nat Protoc. 2014;9(1):64–75.
- García-Santamarina S, Boronat S, Domènech A, et al. Monitoring in vivo reversible cysteine oxidation in proteins using ICAT and mass spectrometry. Nat Protoc. 2014;9(5):1131–1145.
- Pan KT, Chen YY, Pu TH, et al. Mass spectrometry-based quantitative proteomics for dissecting multiplexed redox cysteine modifications in nitric oxide-protected cardiomyocyte under hypoxia. Antioxid Redox Signal. 2014;20(9):1365–1381.
- Forrester MT, Thompson JW, Foster MW, et al. Proteomic analysis of S-nitrosylation and denitrosylation by resin-assisted capture. Nat Biotechnol. 2009;27(6):557–559.
- Wolhuter K, Whitwell HJ, Switzer CH, et al. Evidence against Stable Protein S-Nitrosylation as a Widespread Mechanism of Post-translational Regulation. Mol Cell. 2018;69(3):438–450 e435.
- Chouchani ET, James AM, Methner C, et al. Identification and quantification of protein S-nitrosation by nitrite in the mouse heart during ischemia. J Biol Chem. 2017;292(35):14486–14495.
- Ibanez-Vea M, Huang H, Martinez De Morentin X, et al. Characterization of Macrophage Endogenous S-Nitrosoproteome Using a Cysteine-Specific Phosphonate Adaptable Tag in Combination with TiO2 Chromatography. J Proteome Res. 2018;17(3):1172–1182.
- Yang J, Gupta V, Tallman KA, et al. Global, in situ, site-specific analysis of protein S-sulfenylation. Nat Protoc. 2015;10(7):1022–1037.
- Poole LB, Karplus PA, Claiborne A. Protein sulfenic acids in redox signaling. Annu Rev Pharmacol Toxicol. 2004;44:325–347.
- Yang J, Gupta V, Carroll KS, et al. Site-specific mapping and quantification of protein S-sulphenylation in cells. Nat Commun. 2014;5:4776.
- Li R, Klockenbusch C, Lin L, et al. Quantitative Protein Sulfenic Acid Analysis Identifies Platelet Releasate-Induced Activation of Integrin beta2 on Monocytes via NADPH Oxidase. J Proteome Res. 2016;15(12):4221–4233.
- Bechtel TJ, Weerapana E. From structure to redox: the diverse functional roles of disulfides and implications in disease. Proteomics. 2017;17:6.
- Kang DH, Lee DJ, Lee KW, et al. Peroxiredoxin II is an essential antioxidant enzyme that prevents the oxidative inactivation of VEGF receptor-2 in vascular endothelial cells. Mol Cell. 2011;44(4):545–558.
- Lu S, Fan SB, Yang B, et al. Mapping native disulfide bonds at a proteome scale. Nat Methods. 2015;12(4):329–331.
- Murdoch CE, Shuler M, Haeussler DJ, et al. Glutaredoxin-1 up-regulation induces soluble vascular endothelial growth factor receptor 1, attenuating post-ischemia limb revascularization. J Biol Chem. 2014;289(12):8633–8644.
- Duan J, Kodali VK, Gaffrey MJ, et al. Quantitative Profiling of Protein S-Glutathionylation Reveals Redox-Dependent Regulation of Macrophage Function during Nanoparticle-Induced Oxidative Stress. ACS Nano. 2016;10(1):524–538.
- McGarry DJ, Chen W, Chakravarty P, et al. Proteome-wide identification and quantification of S-glutathionylation targets in mouse liver. Biochem J. 2015;469(1):25–32.
- Chen R, Mias GI, Li-Pook-Than J, et al. Personal omics profiling reveals dynamic molecular and medical phenotypes. Cell. 2012;148(6):1293–1307.
- Parker CE, Borchers CH. Mass spectrometry based biomarker discovery, verification, and validation–quality assurance and control of protein biomarker assays. Mol Oncol. 2014;8(4):840–858. .
- Geyer PE, Holdt LM, Teupser D, et al. Revisiting biomarker discovery by plasma proteomics. Mol Syst Biol. 2017;13(9):942.
- Hernandez B, Parnell A, Pennington SR. Why have so few proteomic biomarkers “survived” validation? (Sample size and independent validation considerations). Proteomics. 2014;14(13-14):1587–1592.
- Christin C, Hoefsloot HC, Smilde AK, et al. A critical assessment of feature selection methods for biomarker discovery in clinical proteomics. Molecular & cellular proteomics: MCP. 2013;12(1):263–276.
- Skates SJ, Gillette MA, LaBaer J, et al. Statistical design for biospecimen cohort size in proteomics-based biomarker discovery and verification studies. J Proteome Res. 2013;12(12):5383–5394.
- Diz AP, Carvajal-Rodriguez A, Skibinski DO. Multiple hypothesis testing in proteomics: a strategy for experimental work. Molecular & cellular proteomics: MCP. 2011;10(3):M110 004374.
- Loroch S, Trabold K, Gambaryan S, et al. Alterations of the platelet proteome in type I Glanzmann thrombasthenia caused by different homozygous delG frameshift mutations in ITGA2B. Thromb Haemost. 2017;117(3):556–569.
- Kammers K, Cole RN, Tiengwe C, et al. Detecting Significant Changes in Protein Abundance. EuPA open proteomics. 2015;7:11–19.
- Datta S, Satten GA, Benos DJ, et al. An empirical bayes adjustment to increase the sensitivity of detecting differentially expressed genes in microarray experiments. Bioinformatics (Oxford, England). 2004;20(2):235–242.
- Wettenhall JM, Smyth GK. limmaGUI: a graphical user interface for linear modeling of microarray data. Bioinformatics (Oxford, England). 2004;20(18):3705–3706.
- Ting L, Cowley MJ, Hoon SL, et al. Normalization and statistical analysis of quantitative proteomics data generated by metabolic labeling. Molecular & cellular proteomics: MCP. 2009;8(10):2227–2242.
- Ritchie ME, Phipson B, Wu D, et al. limma powers differential expression analyses for RNA-sequencing and microarray studies. Nucleic Acids Res. 2015;43(7):e47.
- Boja ES, Rodriguez H. Proteogenomic convergence for understanding cancer pathways and networks. Clin Proteomics. 2014;11(1):22.
- Alfaro JA, Sinha A, Kislinger T, et al. Onco-proteogenomics: cancer proteomics joins forces with genomics. Nature methods. 2014;11(11):1107–1113.
- Schwamborn K, Caprioli RM. Molecular imaging by mass spectrometry–looking beyond classical histology. Nat Rev Cancer. 2010;10(9):639–646.
- Domanski D, Murphy LC, Borchers CH. Assay development for the determination of phosphorylation stoichiometry using multiple reaction monitoring methods with and without phosphatase treatment: application to breast cancer signaling pathways. Anal Chem. 2010;82(13):5610–5620.
- The M, Tasnim A, Kall L. How to talk about protein-level false discovery rates in shotgun proteomics. Proteomics. 2016;16(18):2461–2469.
- Zahedi RP. Joining forces: studying multiple post-translational modifications to understand dynamic disease mechanisms. Expert Rev Proteomics. 2016;13(12):1055–1057.
- Diehl HC, Beine B, Elm J, et al. The challenge of on-tissue digestion for MALDI MSI- a comparison of different protocols to improve imaging experiments. Anal Bioanal Chem. 2015;407(8):2223–2243.
- Kopczynski D, Coman C, Zahedi RP, et al. Multi-OMICS: a critical technical perspective on integrative lipidomics approaches. Biochim Biophys Acta. 2017;1862(8):808–811.
- Conrads TP, Petricoin EF 3rd. The Obama Administration’s Cancer Moonshot: a Call for Proteomics. Clinical cancer research: an official journal of the American Association for Cancer Research. 2016;22(18):4556–4558.
- Aelion CM, Airhihenbuwa CO, Alemagno S, et al. The US Cancer Moonshot initiative. Lancet. Oncol. 2016;17(5):e178–180.