
ABSTRACT
This study investigates children’s explicit and implicit language attitudes in a highly diverse primary education. Set in the bilingual province of Fryslân, the Netherlands, the current research was carried out in the scope of the 3M-project (‘More opportunities with multilingualism’: Duarte & Günther-van der Meij, 2018a. A holistic model for multilingualism in education. EuroAmerican Journal of Applied Linguistics and Languages, 5(2), 24–43. https://doi.org/10.21283/2376905X.9.153), wherein pupils’ home languages are used as a resource to promote multilingualism and thereby facilitate learning. We examined socially significant language attitudes and children’s stereotypes towards prevalent minority and migrant languages. Participants consisted of 93 pupils (aged 7–12). They completed questionnaires to assess their explicit attitudes towards majority, migrant and minority languages. Additionally, 137 pupils performed an Implicit Association Test (IAT) to measure the relative attitudes of standard Dutch versus (1) the regional minority language (Frisian) and versus (2) a salient migrant language (Moroccan Arabic). Questionnaire results show significantly lower ratings for Moroccan Arabic and ‘other languages’ compared to Dutch, English and Frisian. Implicit results revealed a larger and significant preference for Dutch over Moroccan-Dutch accents and a smaller, non-significant, preference for Dutch over Frisian accents. Our results suggest a need for primary schools to explicitly address issues related to children’s attitudes towards different languages and accents.
1. Introduction
Attitudes play a central role in pupil achievement and in the development of their language proficiency (Cummins, Citation2000; Fürstenau, Citation2016; Hélot, Citation2012). Language attitudes can be defined as ‘socially and culturally embedded metalinguistic conceptualizations of language and its forms of usage’ (Blommaert, Citation2006, p. 241). They are embedded in socialization processes and explain the relationship between linguistic and social phenomena (Dragojevic et al., Citation2013). While the presence of strong monolingual beliefs is shown to have detrimental effects on linguistically diverse pupils’ achievement (Wheeler, Citation2008), positive attitudes towards language(s) may positively contribute towards their acquisition of the school language (Gardner, Citation1985). Research has shown that positive attitudes towards home languages of multilingual pupils are important for the successful development of their second and/or third languages (Cummins, Citation2000). For monolingual pupils, increased language awareness and positive attitudes have also been linked to higher school attainment (Candelier, Citation2004; Hélot, Citation2012). The current article looks at language attitudes of young children within the complex language ecology of the Province of Fryslân, in the north-western part of the Netherlands.
Primary school education in Fryslân is a complex multilingual situation. Traditionally, Frisian, the regional minority language, is used as a medium of instruction alongside Dutch and English in a trilingual school system (Gorter & van der Meer, Citation2008). However, the population of Fryslân is gradually becoming more diverse (Duarte & van der Meij, Citation2018b). Recent data show that population growth in the province is mostly due to increasing numbers of migrants arriving in Fryslân (Centraal Bureau voor de Statistiek, Citation2019). As a result of this change, primary schools are tasked with educating increasing amounts of multilingual pupils from various linguistic backgrounds, a feature typical of super-diverse settings (Vertovec, Citation2007). There is, however, a gap between the academic achievement of children whose home language is also the school language, and children who speak different languages at home (de Boer, Citation2009; OECD, Citation2018). In Fryslân, many newly arrived migrant pupils will encounter three languages of schooling: Dutch, Frisian and English. This result in two distinct types of multilingualism: pupils who are schooled in prestigious, visible and socially acceptable languages; and (migrant) pupils with diverse linguistic backgrounds whose languages are often undervalued and associated with poverty and backwardness (cf. Cenoz & Gorter, Citation2017; Hélot & De Mejía, Citation2008).
Furthermore, many teachers hold negative explicit attitudes towards the Frisian language and its use in class (Ruijven & Ytsma, Citation2008). For instance, Arocena and Gorter (Citation2013) point out that even in trilingual schools, teachers consider Dutch and English more important for pupils’ development. More recently, Duarte and van der Meij (Citation2018b) reported slightly positive teacher attitudes towards the use of Frisian, but negative attitudes towards and a lack of knowledge of migrant languages. These studies, however, have predominantly focussed on teachers and not on pupils’ attitudes. Moreover, most studies have exclusively used explicit measures to capture language attitudes. For more holistic insight into language attitudes, additional means of exploring attitudes are necessary. This is especially important because research has shown that implicit and explicit attitudes are independent reactions; a negative implicit attitude toward a group and a positive explicit attitude toward that same group (or vice versa) can coexist (e.g. Pantos & Perkins, Citation2013). Secondly, while implicit attitudes predict behaviour under conditions of high cognitive load, explicit attitudes are suited to predict behaviour under conditions in which respondents can inhibit the automatically activated stereotypes and intentionally trigger their nonprejudiced attitudes. The present study will therefore incorporate measures to assess implicit attitudes towards two salient minority accents (Frisian-Dutch and Moroccan-Dutch) and compare these to explicit attitudes towards various languages of the pupils.
The current research was conducted as part of the 3M-project ‘Meer kansen Met Meertaligheid’ (More opportunities with Multilingualism; henceforth referred to as 3M) in which teachers from Frisian primary schools co-design and implement an intervention programme to improve education of multilingual pupils (Duarte & van der Meij, Citation2018a). The intervention aimed at valuing pupils’ multilingual repertoires, using languages in the classroom, and developing positive attitudes towards multilingualism and multilingual education. The aim of this paper is to further examine language attitudes of young children, and more specifically attitudes towards multilingualism and multilingual education by looking at existing implicit and explicit attitudes that pupils in the 3M-project hold towards migrant and minority languages. It aims to answer the following research questions:
What are pupils’ implicit and explicit language attitudes towards migrant and minority languages in primary education in a highly diverse setting?
What factors explain variation in children’s implicit and/or explicit language attitudes?
2. Explicit and implicit language attitudes in young children
Language attitudes are intrinsically linked to and can predict behaviour (Baker, Citation1992). They consist of cognitive, affective and conative elements. The cognitive element of an attitude covers the thoughts and beliefs about the attitude object, the affective component reflects the feelings towards an attitude object, and the conative element concerns the behavioural intentions (Ajzen, Citation1989; Baker, Citation1992). Explicitly self-reported attitudes have been associated with countless performance-related variables. Positive attitudes towards the language and culture of a group, for example, result in a higher performance in the acquisition of that language (Baker, Citation1992; Gardner, Citation1985; Garrett et al., Citation2003; Lasagabaster, Citation2003). For multilingual pupils, positive attitudes also significantly contribute to the acquisition of majority languages in new host countries (Cummins, Citation2000; Krashen, Citation1982). Additionally, monolingual pupils attain better school results with positive attitudes towards additional languages (Candelier, Citation2004; Hélot, Citation2012).
In officially bilingual regions, such as Fryslân, a situation of implicit language hierarchies arises. Pupils who do not speak the minority language often hold negative attitudes towards those minority languages (Ibarraran et al., Citation2008). Bernaus et al. (Citation2004) in Catalonia report that pupils with an immigrant background were more motivated to learn the majority language Spanish and the foreign language English than to learn the minority language Catalan. A study by Septien (Citation2006) also found that immigrant pupils held more negative attitudes towards Basque, as Spanish was seen to be the language they had to learn to live successfully in the new country. In addition, pupils in general often hold negative attitudes towards migrant languages (Caruana et al., Citation2013).
Knowledge about pupils’ attitudes can thus provide an indication of their academic achievement and give teachers essential insights that help them adjust teaching practices in order to strengthen positive attitudes towards different languages. However, due to children’s lower development levels and reduced attention spans, it is often difficult to measure their attitudes (Oliver & Purdie, Citation1998; Wiegand, Citation1992). Therefore, this study made use of questionnaires to measure the explicit attitudes and an implicit measurement of language attitudes of primary pupils in Fryslân.
Both explicit and implicit attitudes can be represented in a dual process model of social cognition (Gawronski & Bodenhausen, Citation2006). This model divides attitudes in two modes of mental processing: associative (or automatic, implicit) and propositional (thoughtful, explicit) processing (Pantos & Perkins, Citation2013). Implicit attitudes are by nature inaccessible to the individual and cannot be self-reported (Pantos & Perkins, Citation2013). It is therefore important to examine implicit attitudes via experiments that do not facilitate socially desirable answers as much as self-reported evaluations or, to a certain degree, verbal guise experiments.
One useful method is the Implicit Association Test (IAT; Banaji, Citation2013; Greenwald et al., Citation1998). The IAT measures relative reaction times between pairings of concepts and attributes. The difference in reaction times indicates the relative strength of the association: subjects respond more rapidly to concepts that are already strongly associated to them than when they are weakly associated. Much has been learned about adults’ implicit attitudes using the IAT (Banaji, Citation2001; Greenwald et al., Citation1998, Citation2003), and some IATs have successfully been adapted to be used with children as young as three years old (Thomas et al., Citation2007) or to measure race attitudes in White American children aged 6 and 10 (Baron & Banaji, Citation2006, Citation2009).
In linguistic attitude research, Rosseel et al. (Citation2018) investigated potential differences in attitudes towards Standard Belgian Dutch and two regional varieties of Dutch (Antwerp regiolect and West/Flemish regiolect) among university students who were also speakers of these language varieties. Although both groups preferred Standard Belgian Dutch over both regional dialects, the strength of the preference differed depending on the participant’s relation to the regiolect: a weak preference towards Standard Belgian Dutch was found when compared to the group’s ‘own’ regiolect; a strong preference for the standard variety was found when compared to the ‘other’ regiolect (Rosseel et al., Citation2018, pp. 3–4).
Other studies show that auditory cues can activate different social categories (i.e. stereotypes; Hosoda et al., Citation2007; Kim et al., Citation2011). Overall, research suggests that standard-accented speakers are rated more favourably on features related to competence, intelligence, and social status than nonstandard-accented speakers. Nevertheless, nonstandard-accented speakers are sometimes rated as comparable or more favourable on dimensions of kindness and solidarity (e.g. Cargile et al., Citation1994; Nesdale & Rooney, Citation1990). Finally, Pantos and Perkins (Citation2013) show that, in adults, implicit attitudes towards accented speech as measured via IATs are different from explicit attitudes, but no less important. There is therefore a need to not only measure children’s explicit attitudes towards multilingualism in education, but also to investigate both their explicit as well as their implicit attitudes towards language varieties in the form of accented speech.
In sum, while most studies of accent-based prejudice mostly apply self-report questionnaires, which measure explicit attitudes, the current investigation will combine an explicit survey on language attitudes with an IAT measurement to examine pupils’ implicit attitudes towards Standard Dutch as compared to accented speakers. Moreover, the measurements aim to assess attitudes towards minority, majority, and migrant languages while focusing on a group of children that have thus far not often been studied: pupils aged 7–12.
3. Method
In order to measure children’s language attitudes and identify their predictors, the current study made use of a mixed methods approach (Creswell, Citation2013), consisting of two distinct methods: (1) a questionnaire to assess explicit attitudes and potential factors affecting children’s attitudes and (2) an Implicit Association Test (IAT: Greenwald et al., Citation1998) to assess pupils’ implicit reactions to one particular foreign and one regional accent (see below for details). The data were collected from primary schools participating in the 3M project (Duarte & van der Meij, Citation2018a). Data collection took place in 2018-2019. Parental permission for participation in the research was obtained via informed consent forms distributed via the schools, and all data were fully anonymized.
3.1. Materials
3.1.1. Questionnaire
The contents of the questionnaire were based on previous research into language attitudes by Lee and Oxelson (Citation2006), Pulinx et al. (Citation2015), and Fürstenau (Citation2016) and altered to fit a younger population (between ages 7;0 and 12;11) with a limited proficiency in Dutch. The questionnaire consisted of two sections: section one for sociolinguistic background, and section two for 5-point Likert scale statements regarding various languages present in Frisian primary schools. Dutch, Frisian and English were added as they concern compulsory courses; Moroccan Arabic was added as a salient non-official language; and ‘languages I don’t know’ was included to measure attitudes towards new languages. Every language category contained three Likert items to measure attitudes towards these languages and their speakers as a whole: one for speaker status (smart), one for language status (important) and one for speaker solidarity (nice). Questions were pseudo-randomized with no more than two subsequent questions regarding the same question group or dimension.
3.1.2. Implicit Association Test
For measuring implicit attitudes towards accented speech, an auditory Implicit Association Task (IAT) was created. This task measures the relative strength of associations between a concept (e.g. flowers or insects) and an evaluative attribute (e.g. good or bad) (Greenwald et al., Citation1998) via response latencies. The underlying assumption is that strongly associated items (e.g. flowers and good; insects and bad) are paired together faster and more accurately than incongruously paired items (e.g. flowers and bad; insects and good). The current study adapted a version of the IAT based on the work of Greenwald et al. (Citation1998), Baron and Banaji (Citation2006, Citation2009), Greenwald et al. (Citation2009), Pantos and Perkins (Citation2013) and Rosseel et al. (Citation2018). IATs involve binary classification tasks and hence one auditory IAT only allows a comparison between participants’ implicit attitudes toward two accents. Considering this limitation as well as the limited concentration span, we created two IATs to compare Standard Dutch to two important and salient minority accents: One focussing on (1) the differences in reaction times between Standard Dutch (SD) and Moroccan Arabic Accented Dutch (MD; a salient foreign accent) and one on (2) the differences between Standard Dutch (SD) and Frisian Accented Dutch (FD, the regional minority language).
During the IAT, subjects listened to one SD speaker, and one MD/FD speaker. All audio clips were processed in Soundforge (CitationPro, S.F. 10, 2003-2015) to have similar duration and volume. Each IAT consisted of a total of 144 trials (80 baseline trials and 64 critical trials) in which pupils heard standard/accented sentence fragments or saw positive/negative images. The process of the IAT is described in . Items marked with an asterisk (*) indicate the critical trials; all other blocks are baseline rounds.
Table 1. Overview of the Trial Blocks in the Implicit Association Test.
Participants began by categorizing speech fragments as the target concepts of Standard Dutch or Accented Dutch (see for an overview). In block B1 they categorized audio stimuli into two accent categories by pressing a left-side (SD) or a right-side (accented FD or MD) key on a laptop computer. Audio fragments were presented one at a time. A representation of the different screens that participants were shown is given in (concept labels appeared at the top of the screen, and the plus sign appeared in between items to centre the gaze).
Figure 1. Representation of IAT Blocks.
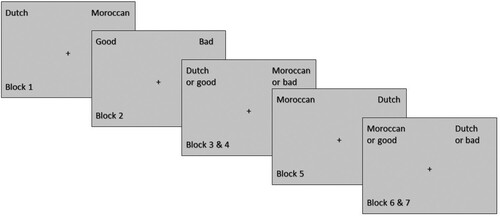
In the second round, participants practiced classifying stimuli images as either Good or Bad (B2). Positive images included a brightly shining sun, a thumbs up, a green check mark and a smiling emoji. Negative images included a raincloud, a thumbs down, a red cross and a sad emoji. After the warm-up rounds, two combined rounds (B3 and B4) started, wherein both audio and visual types were presented; B3 was a trial round to familiarize pupils with the combinations, and B4 is the actual test round. In these rounds, both a concept and an attribute were mapped to each response button, e.g. Standard Dutch and Good mapped to the left-key response. From B5 on, the combinations shifted: accented Dutch (FD or MD) and positive words were on the left-hand side; and Standard Dutch plus negative words on the right-hand side.
A pilot experiment was run using spoken stimuli from pupils’ same-aged peers, and written words for the evaluative dimension (e.g. ‘good’, ‘bad’). However, pupils often exceeded the allotted time for the trials (10.000 milliseconds) due to comprehension difficulties with both the audio files and the written words. Recordings were therefore changed to female adult native speakers of the target accent; and the written stimuli were replaced with visual stimuli, namely pictures (e.g. a thumbs up versus a thumbs down image). In a second pilot using these new stimuli, children were successfully able to categorize the accents and images and complete the trials in the allotted time.
IATs were programmed in E-Prime and run using E-Basic (Schneider et al., Citation2002) with items presented in random order. To counteract the effects of practice and fatigue, the order of the IATs was counterbalanced between subjects (Rosseel et al., Citation2018). Within each IAT, half of the participants started with SD on the left and FD or MD on the right, and the other half were presented with the opposite order.
3.2. Sample and sampling strategy
The questionnaires were conducted with 93 children aged between 7;0 and 12;11. A typical convenience sampling strategy was used by recruiting participants from schools within the 3M project (Duarte & van der Meij, Citation2018a). provides an overview of the age ranges and gender of the pupils in the study.
Table 2. Background Information for Questionnaire Participants.
Pupils listed their home languages in various contexts. 31 pupils listed only one language, and were considered monolingual. 48 students claimed mastery of two home languages and were considered bilingual, while 20 spoke 3 or more languages in various contexts and were classified as multilingual.
The IATs were conducted with 137 children aged between 7;0 and 11;11 from the same schools (see for details). Due to the tests being administered on different days, and ever-changing classroom compositions, not all children that participated in the IAT tasks also completed questionnaires and vice versa.
Table 3. Background Information for IAT Participants.
3.3. Procedures
Surveys were conducted in-class and lasted approximately 25 min. Pupils were instructed on how to answer Likert scale questions before the start. IATs were conducted on-site on laptops equipped with E-Prime and headphones (SennheiserTM). Each pupil received instructions for the IAT prior to start. They were asked to only use the ‘q’ and ‘p’ keys to indicate whether an item belongs on the left-most side (q) or the right-most side (p). The experimenter offered further clarification after the first trial rounds (B1 and B2: see ) if necessary.
3.4. Data analysis
Questionnaire data consisted of ratings on a 5-point Likert scale ranging from 1 (‘disagree’), to 5 (‘agree‘). After data collection and cleaning, composite scores were computed for each language category. A Kruskal–Wallis H test was conducted to examine the differences between the language groups. Next, data were analysed using mixed-effects regression analyses to examine the potential effect of independent background variables on the overall attitudes. These variables included gender (male/female), age (range 7-12), language background (monolingual/bilingual/multilingual), and language category (Dutch/Frisian/Moroccan/English/Other).
IAT data take the form of reaction times in milliseconds (msec). These data were cleaned according to instructions from the IAT scoring procedure by Lane et al. (Citation2007): response latencies above 10,000msec were considered too high and hence removed. Additionally, nine subjects (6.6%) with response latencies below 300msec in more than ten per cent (10%) of the trials were excluded, as this is not enough time to listen to the stimuli before responding. Finally, pupils who did not want to finish either test were removed from the dataset. This resulted in the exclusion of 23 pupils in total (16.8%), out of which 14 (10.2%) quit prematurely.
With the remaining data, the IAT response times for blocks B3, B4, B6, and B7 were used to calculate D-scores per pupil per IAT. Following Greenwald et al. (Citation2003), the latency for each incorrect item was replaced with the mean of the correct trials plus a penalty of 600msec. Afterwards, the difference in mean latency for block 3 and 6 was divided by the standard deviation of latencies in these blocks, as was the mean latency for block 4 and 7. The average of these two resulted in the D-score, ranging from −2 to 2 with positive values reflecting a relative bias for Standard Dutch (SD) and negative scores reflecting a preference for accented Dutch (FD/MD).
The D-scores for each IAT were first subjected to a one-sample t-test to assess any overall preference for Standard Dutch or Accented Dutch (i.e. a D-score that is significantly different from 0). In subsequent mixed-effects regression analyses, the potential impact of various independent variables on D-scores was assessed. These independent variables included gender (male/female), age (range 7-12), language background (monolingual/bilingual/multilingual), IAT version (SD-FD and SD-MD), and test version (congruent first/incongruent first). The significance of these variables was evaluated using t-tests for coefficients (using Satterthwaite's adjustment to compute degrees of freedom) and variables that did not significantly contribute to the model were removed. Analyses were performed in R (version 4.0.3: R Core Team, Citation2020) and the ‘lmer’ function from the ‘lme4’ package was used to fit the linear mixed-effects model (Bates et al., Citation2015). The ‘lmerTest’ package (Kuznetsova et al., Citation2017) was used to obtain p-values.
4. Results
4.1. Explicit and implicit attitudes
Our first research question – ‘What are pupils’ explicit and implicit language attitudes towards migrant and minority languages in a highly diverse setting?’ – was examined by assessing explicit attitudes towards minority, majority, and migrant languages by means of questionnaires and implicit language attitudes and potential bias towards Standard Dutch as compared to Accented Dutch (Frisian-Dutch or Moroccan-Dutch) by means of IATs.
4.1.1. Explicit attitudes (Questionnaires)
Results from the questionnaire on explicit attitudes are summarized in .
Table 4. Explicit Language Attitudes of Pupils in Composite Scores.
A Kruskal–Wallis H test on the composite scores revealed significant differences between the languages (H(4) = 68.079, p < .001) as visualized in the boxplots in .
Figure 2. Boxplot showing the spread in composite scores per language.
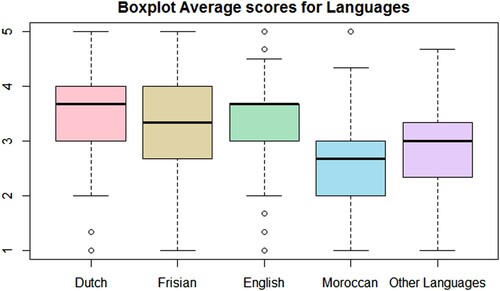
Subsequent pairwise comparisons with Tukey adjustment (see ) confirmed significant differences between the language groups: positive estimates reflect a higher score for the first language group in the comparison and negative reflect a relatively lower score for the first language group. The estimates in reveal that English, Frisian, and Dutch are rated significantly higher than Moroccan Arabic and Other Languages (English – Other Languages p = .002; all other ps < .001).
Table 5. Contrasts Between Attitudes towards the Languages.
4.1.2. Implicit attitudes (IATs)
The data revealed a slight implicit bias in favour of Dutch over Frisian accents with a mean D-score of 0.08 (SD = 0.44). A one sample t-test revealed that this D-score was not significantly different from 0 (t(112) = 1.93, p = 0.056, 95% CI [−0.002, 0.162], d = 0.182). The pupils showed a relatively larger implicit bias in favour of Dutch over Moroccan Arabic with a mean D-score of 0.204 (SD = 0.35). This bias was significantly different from 0 (t(112) = 6.21, p < .001, 95% CI [0.139, 0.270]) and constitutes an effect of medium size (d = 0.584). Additionally, verbal reactions to the IAT included surprise at hearing Moroccan Arabic accents: pupils often made remarks on the ‘silly language’, or commented ‘who really speaks like that?’ to indicate lack of familiarity with the pronunciation.
4.2. Factors influencing explicit and implicit attitudes
The second research question – ‘What factors explain variation in children’s implicit and/or explicit language attitudes?’ – assessed the factors impacting the implicit and explicit attitudes by using a mixed-effects models with random intercepts for pupils.
4.2.1. Factors impacting explicit attitudes
In order to examine the factors explaining the variation in explicit attitudes between language groups (also see ), we fitted a linear mixed-effects model to predict the average score with random intercepts for pupil. The independent variables examined were language category (Dutch, English, Frisian, Moroccan Arabic and Other Languages), linguistic background (monolingual-bilingual-trilingual), gender (male-female), school (1-4), and age (range 7-12). Independent variables that did not significantly contribute to model fit were removed during model comparisons. The independent variables in the best fitting linear mixed-effects model are shown in . The numbers in the table show that the grand mean rating, the intercept, is estimated to be −0.007. The estimates or coefficients for the subsequent predictors in the table tell us whether the ratings are more positive or more negative when the variable levels mentioned in the table are present.
Table 6. Fixed-effect factors in the model fitted to the average ratings.
The model confirmed the difference in explicit bias per language category with Dutch and English receiving significantly higher ratings (B = 0.410, t = 5.54 p <.001; and B = 0.282, t = 3.815, p <.001 respectively), while Moroccan received significantly lower ratings (B = −0.521, t = −7.402, p <.001) than the grand mean rating. A post-hoc pairwise comparison with Benjamini Hochberg false discovery rate adjustments was administered using the ‘emmeans’ package in R (Lenth, Citation2020). This revealed how the differences between languages were mitigated by linguistic background. Effects are visualized in (using ‘ggplot2’; Wickham, Citation2016).
Figure 3. Boxplots showing the effect of linguistic background per language category.
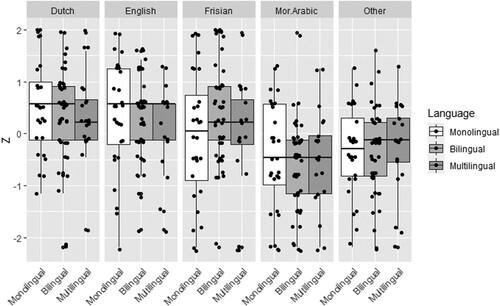
shows the contrasts between languages per linguistic background. The contrasts show positive estimates when the group scored higher and negative estimates when the group in the comparison scored lower than the grand mean ratings.
Table 7. Contrasts in the Model fitted to the Average Likert Ratings.
The contrasts in show how mono- and bilingual students rate Dutch significantly higher than average (B = 0.535, t = 3.295, p = .008; and B=0.346, t = 0.256, p = .027). Additionally, monolingual students rate English higher (B = 0.375, t = 2.311, p = .040) but not bi- or multilingual students, while bilingual students rate Frisian higher than average (B = 0.412, t = 3.096, p = 0.011). For Moroccan Arabic, there is no distinction: all three groups rate the language significantly lower than average (B = −0.448, t = −2.760, p = .023 for monolingual; B = −0.636, t = −4.701, p < .001 for bilingual; and B = −0.478, t = −2.557, p = .027 for multilingual). Finally, bilingual students rate Other languages lower (B = −0.323, t = −2.385 p = .038).
4.2.2. Factors impacting implicit attitudes
As pupils performed two IATs and we were thus dealing with paired data, ‘pupil’ was added as a random effect variable to account for the correlation between the pupils’ D-scores on the IATs. Significant effects of IAT version and gender are plotted in and , respectively (created using ‘ggplot2’; Wickham, Citation2016).
Figure 4. Boxplots showing the effect of IAT version.
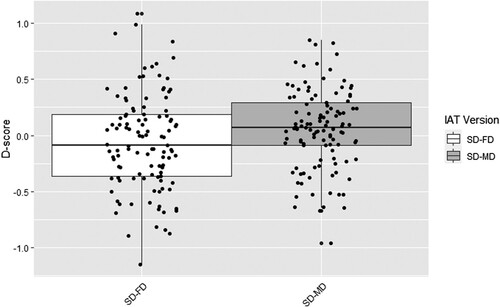
Figure 5. Boxplots showing the interaction effect between Gender and Test Version.
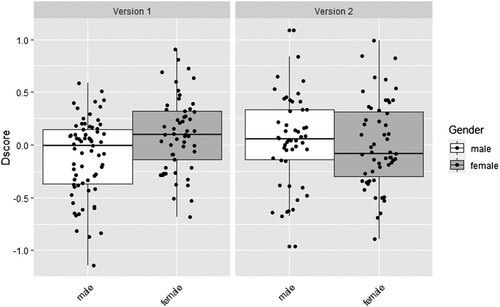
The independent variables in the best fitting random intercept model are shown in . The base D-score, the intercept, is estimated to be 0.008 and the estimates or coefficients for the subsequent predictors in the table tell us whether this D-score goes up or down when the variable levels mentioned in the table are present.
Table 8. Fixed-effect factors in the model fitted to the D-scores.
The model confirmed the difference in relative bias for the two IAT versions with the SD-FD version eliciting significantly lower D-scores than the SD-MD version (B = −0.057, t = 2.239, p = 0.027). So, pupils on average showed a D-score that was approximately 0.057 lower, and hence closer to 0, in the SD-FD version than in the SD-MD version (after centring the scores). This effect is also visualized in . The negative coefficient for male as compared to female pupils indicated a slightly higher D-score for female pupils, but this difference was not significant (B = −0.044 t = 1.706, p = 0.091).
There was no significant difference between test versions (B = −0.057, t = −0.500, p = 0.618), but a significant interaction term showed that the difference between genders differed for the two test versions, with relatively higher D-scores for females in the first version and no difference or a slightly reversed difference in the second version (B = −0.2538, t = −2.446, p = 0.016). This effect is visualized in . Age (range 7-12) and language background (monolingual, bilingual or trilingual) did not affect D-score nor were any interactions with these variables found to improve model fit.
5. Discussion
In order to further examine language attitudes in children, this study explored implicit and explicit language attitudes of primary school pupils towards several languages. The first research question focussed on mapping implicit and explicit language attitudes towards migrant and minority languages in primary education. Comparing explicit attitudes between languages showed that Moroccan Arabic and Other Languages were rated significantly lower than Dutch, Frisian and English (see also ). These results are in line with Caruana et al. (Citation2013), who show that pupils in general hold negative attitudes towards migrant languages. These effects were mitigated by linguistic background. Overall, the relatively more negative attitudes towards Moroccan and Other Languages were significantly present in mono- and bilingual pupils, but not in multilingual students, confirming previous results by Ruijven and Ytsma (Citation2008) and Duarte and Günther-van der Meij (Citation2018b) which revealed that bi- or multilingual pupils hold more positive language attitudes in general and towards their home languages, in particular. For gender and age, no significant differences were found.
Next, this study’s IAT found that pupils’ implicit attitudes favour the Standard Dutch accent over the migrant language-accented Moroccan Dutch. Additionally, a small, but non-significant, preference for standard Dutch over the salient minority language Frisian was found. The analyses suggested a relatively larger bias for Dutch over Moroccan as compared to Dutch over Frisian. These results are mostly in line with and add to findings on explicit attitudes by Ibarran et al. (Citation2008) and Bernaus et al. (Citation2004) who report more negative attitudes towards minority than majority languages in officially bilingual regions.
The second research question aimed at identifying factors that explain variation in children’s implicit/explicit language attitudes. For both implicit and explicit data, gender was a significant predictor. Young children differ in their implicit and explicit attitudes with young boys showing a stronger explicit attitude while young girls show a stronger negative implicit attitude towards accented Dutch. The IAT counterbalancing was also found to have a significant effect on the outcome. D scores on the incongruous condition first (FD/MD plus Good images left, and SD plus Good images left after the switch) version were higher, and this effect was mostly visible in male pupils. This might imply that children had more difficulty getting used to a task in which they were asked to categorize the incongruous target item and attribute that were presented first than a task in which they were presented with the congruous pairs first. Future studies should take this potential difficulty of IATs administered with children into account.
A further point for discussion is the relatively high drop-out rate of children participating in the IAT task (23 children, 16.8%). Out of these 23, 9 children failed to meet the response threshold (10,000 msec) often enough; 14 children only participated in one of the two IAT tasks and decided not to continue after a short break. Due to the way the IATs were programmed, this meant that the data from the completed IAT task could not be extracted from the output file either, leading to a complete removal of these children from the dataset. This raises the total elimination rate, which could also have implications for the findings: either children who ended participation early did not show strong enough attitudes towards the accent varieties to complete the tasks, which would be visible in low D-scores if they had been included; or children with less patience were not represented in the experiments. Suggestions for future IAT studies with children therefore also include separate testing moments for each task.
The overall IAT results of the present study are in line with previous IAT studies, mostly conducted with adults, showing an implicit preference for standard varieties over regional varieties (Rosseel et al., Citation2018) and for standard varieties over foreign accents (Pantos and Perkins, Citation2013). Interestingly, these studies often also revealed inconsistencies between explicit and implicit attitudes. Explicit attitudes are claimed to be cognitively controllable, but the present study suggests that children do not exert this control to give socially desirable answers: both implicit and explicit show a negative bias towards Moroccan-Arabic and/ or Moroccan-accented Dutch and a, albeit less pronounced, negative bias towards the salient minority language, Frisian.
Findings from both attitude constructs imply that in the complex multilingual ecology of Fryslân, the distinct types of multilingualism are present in children. While the multilingualism of children speaking the regional minority language is explicitly valued and implicitly not significantly different from the standard language, speakers of Moroccan Arabic or any ‘other language’ at home are valued negatively. Children are implicitly and explicitly more negative towards the salient migrant language. The effect for negative explicit attitudes seems to be mitigated by children speaking more than one home language, but linguistic background had no significant effect on the implicit task. These results are consistent with research showing negative language attitudes towards migrant languages and non-native accents (Caruana et al., Citation2013; Hélot, Citation2012). In young children, standard accents are judged more favourably than Moroccan-accented Dutch. For education institutions, there is thus a need to specifically address accentism in children so as to avoid more salient negative attitudes towards accented varieties later on.
Due to the binary nature of the IAT, no solid conclusions can be drawn on the relation between Frisian-accented Dutch (FD) and Moroccan-accented Dutch (MD). Both accents were directly compared to Standard Dutch (SD) in the IAT. The bias in favour of Standard Dutch was, however, significantly more pronounced when paired with Moroccan Dutch as compared to Frisian Dutch, suggesting a relatively more negative attitude towards Moroccan. Further studies are required to examine the relationship between migrant and minority languages in more detail, and to see how these rankings relate to the explicit language attitudes. Furthermore, the IAT has been criticized for its lack of context (Dasgupta & Greenwald, Citation2001). As there is no situational context, merely the classification of items, we do not know how pupil attitudes might change in a classroom context, or any context outside of the school, when they would potentially encounter the languages in use; we can only indicate that an implicit bias exists. Further research is required in order to examine these attitudes in educational contexts. These findings have clear implications for educational policy makers. As attitudes towards the salient minority language, and towards ‘languages I don’t know’ on the questionnaire were also significantly lower than attitudes towards the standard language, the implication of young children undervaluing diverse linguistic backgrounds stands (Hélot, Citation2012). While educational policy in schools is mostly aimed at implementing multilingual teaching methods that value multilingualism and various linguistic backgrounds (Duarte & Günther-van der Meij, Citation2018a), there is still a way to go before these effects are visible in children’s attitudes. Currently, the languages that are considered positive are mostly those offered in the curriculum, thus not reflecting the linguistic diversity occurrent in society at large. Essential insights for teachers, then, are that strengthening positive attitudes towards different languages and multilingualism in general requires pupils to be familiarized with more linguistic diversity than their immediate surroundings offer.
Disclosure statement
No potential conflict of interest was reported by the author(s).
Additional information
Funding
References
- Ajzen, I. (1989). Attitude structure and behavior. In A. R. Pratkanis, S. J. Breckler, & A. G. Greenwald (Eds.), The third Ohio State University Vol. on attitudes and persuasion. Attitude structure and function (pp. 241–274). Lawrence Erlbaum Associates, Inc.
- Arocena, E., & Gorter, D. (2013). The multilingual classroom in primary education in the Basque Country and in Friesland: Beliefs of teachers and their language practices. Leeuwarden/ Ljouwert: Mercator European Research Centre on Multilingualism and Language Learning.
- Baker, C. (1992). Attitudes and languages (Ser. Multilingual matters, 83). Multilingual Matters.
- Banaji, M. R. (2013). The Implicit Association Test at age 7: A methodological and conceptual review. Social psychology and the unconscious: The automaticity of higher mental processes, 265.
- Banaji, M. R. (2001). Implicit attitudes can be measured. In H. L. Roediger III, J. S. Nairne, I. Neath, & A. M. Surprenant (Eds.), Science conference series. The nature of remembering: Essays in honor of Robert G. Crowder (pp. 117–150). American Psychological Association. https://doi.org/10.1037/10394-007
- Baron, A., & Banaji, M. (2009). Evidence of system justification in young children. Social and Personality Psychology Compass, 3(6), 918–926. https://doi.org/https://doi.org/10.1111/j.1751-9004.2009.00214.x
- Baron, A. S., & Banaji, M. R. (2006). The development of implicit attitudes: Evidence of race evaluations from ages 6 and 10 and adulthood. Psychological Science, 17(1), 53–58. https://doi.org/https://doi.org/10.1111/j.1467-9280.2005.01664.x
- Bates, D., Mächler, M., Bolker, B., & Walker, S. (2015). Fitting linear mixed-effects models using lme4. Journal of Statistical Software, 67(1), 1–48. https://doi.org/10.18637/jss.v067.i01
- Bernaus, M., Masgoret, A. M., Gardner, R. C., & Reyes, E. (2004). Motivation and attitudes towards learning languages in multicultural classrooms. International Journal of Multilingualism, 1(2), 75–89. https://doi.org/https://doi.org/10.1080/14790710408668180
- Blommaert, J. (2006). Language policy and national identity. In T. Ricento (Ed.), An introduction to language policy: Theory and method (pp. 238–254). Blackwell Publishing.
- Candelier, M. (ed.). (2004). Janua Linguarum – The gateway to languages. The Introduction of language awareness into the curriculum: Awakening to languages. European Centre for Modern Languages/Council of Europe Publishing.
- Cargile, A. C., Giles, H., Ryan, E. B., & Bradac, J. J. (1994). Language attitudes as a social process: A conceptual model and new directions. Language & Communication, 14(3), 211–236. https://doi.org/https://doi.org/10.1016/0271-5309(94)90001-9
- Caruana, S., Coposescu, L., & Scaglione, S. (Eds.). (2013). Migration, multilingualism and schooling in Southern Europe. Cambridge Scholars Publishing.
- Cenoz, J., & Gorter, D. (2017). Minority languages and sustainable translanguaging: Threat or opportunity? Journal of Multilingual and Multicultural Development, 38(10), 901–912. https://doi.org/https://doi.org/10.1080/01434632.2017.1284855
- Centraal Bureau voor de Statistiek. (2019, 30 juli). Immi- en emigratie naar diverse kenmerken; regio [Dataset].
- Creswell, J. (2013). Research design: Qualitative, quantitative, and mixed methods approaches. Sage.
- Cummins, J. (2000). Language, power, and pedagogy: Bilingual children in the crossfire. Multilingual Matters.
- Dasgupta, N., & Greenwald, A. G. (2001). On the malleability of automatic attitudes: Combating automatic prejudice with images of admired and disliked individuals. Journal of Personality and Social Psychology, 81(5), 800–814. https://doi.org/https://doi.org/10.1037/0022-3514.81.5.800
- de Boer, H. (2009). Schoolsucces van Friese leerlingen in het voortgezet onderwijs. University of Groningen.
- Dragojevic, M., Giles, H., & Watson, B. (2013). Language ideologies and language attitudes: A foundational framework. In H. Giles & B. Watson (Eds.), The social meanings of language, dialect and accent: International perspectives on speech styles (pp. 1–25). Peter Lang.
- Duarte, J., & Günther-van der Meij, M. (2018a). A holistic model for multilingualism in education. EuroAmerican Journal of Applied Linguistics and Languages, 5(2), 24–43. https://doi.org/https://doi.org/10.21283/2376905X.9.153
- Duarte, J., & van der Meij, M. (2018b). Drietalige basisscholen in Friesland: een gouden greep in tijden van toenemende diversiteit? In O. Agirdag & E.-R. Kembel (Eds.), Meertaligheid en onderwijs: Nederlands plus (pp. 90–102). Boom.
- Fürstenau, S. (2016). Multilingualism and school development in transnational educational spaces. Insights from an intervention study at German elementary schools. In A. Küppers, B. Pusch, & P. U. Semerci (Eds.), Bildung in transnationalen räumen (pp. 71–90). Springer Fachmedien Wiesbaden.
- Gardner, R. C. (1985). Social Psychology and Second Language learning: The role of attitudes and motivation. Edward Arnold.
- Garrett, P., Coupland, N., & Williams, A. (2003). Investigating language attitudes: Social meanings of dialect, ethnicity and performance. University of Wales Press.
- Gawronski, B., & Bodenhausen, G. V. (2006). Associative and propositional processes in evaluation: An integrative review of implicit and explicit attitude change. Psychological Bulletin, 132(5), 692–731. https://doi.org/https://doi.org/10.1037/0033-2909.132.5.692
- Gorter, D., & Van der Meer, C. (2008). Developments in bilingual Frisian-Dutch education in Friesland. Aila Review, 21(1), 87–103. https://doi.org/10.1075/aila.21.07gor
- Greenwald, A. G., McGhee, D. E., & Schwartz, J. L. (1998). Measuring individual differences in implicit cognition: The implicit association test. Journal of Personality and Social Psychology, 74(6), 1464–1480. https://doi.org/https://doi.org/10.1037/0022-3514.74.6.1464
- Greenwald, A. G., Nosek, B. A., & Banaji, M. R. (2003). Understanding and using the implicit association test: I. An improved scoring algorithm. Journal of Personality and Social Psychology, 85(2), 197–216. https://doi.org/https://doi.org/10.1037/0022-3514.85.2.197
- Greenwald, A. G., Poehlman, T. A., Uhlmann, E. L., & Banaji, M. R. (2009). Understanding and using the Implicit Association Test: III. Meta-analysis of predictive validity. Journal of Personality and Social Psychology, 97(1), 17–41. https://doi.org/https://doi.org/10.1037/a0015575
- Hélot, C. (2012). Multilingual education and language awareness. In C. A. Chapelle (Ed.), The encyclopaedia of Applied linguistics (pp. 258–300). Wiley Blackwell.
- Hélot, C., & De Mejía, A. M. (eds.). (2008). Forging multilingual spaces: Integrated perspectives on majority and minority bilingual education. Multilingual Matters.
- Hosoda, M., Stone-Romero, E. F., & Walter, J. N. (2007). Listeners’ cognitive and affective reactions to English speakers with standard American English and Asian accents. Perceptual and Motor Skills, 104(1), 307–326. https://doi.org/https://doi.org/10.2466/pms.104.1.307-326
- Ibarraran, A., Lasagabaster, D., & Sierra, J. M. (2008). Multilingualism and language attitudes: Local versus immigrant students’ perceptions. Language Awareness, 17(4), 326–341. https://doi.org/https://doi.org/10.1080/09658410802147311
- Kim, S. Y., Wang, Y., Deng, S., Alvarez, R., & Li, J. (2011). Accent, perpetual foreigner stereotype, and perceived discrimination as indirect links between English proficiency and depressive symptoms in Chinese American adolescents. Developmental Psychology, 47(1), 289–301. https://doi.org/https://doi.org/10.1037/a0020712
- Krashen, S. D. (1982). Principles and practices of Second Language acquisition. Pergamon Press.
- Kuznetsova, A., Brockhoff, P. B., & Christensen, R. H. B. (2017). lmerTest package: Tests in linear mixed effects models. Journal of Statistical Software, 82(13), 1–26. https://doi.org/10.18637/jss.v082.i13
- Lane, K. A., Banaji, M. R., Nosek, B. A., & Greenwald, A. G. (2007). Understanding and using the implicit association test: What we know (so far) about the method. In B. Wittenbrink & N. Schwarz (Eds.), Implicit measures of attitudes (pp. 59–102). The Guilford Press.
- Lasagabaster, D. (2003). Attitudes towards English in the Basque autonomous community. World Englishes, 22(4), 585–597. https://doi.org/https://doi.org/10.1111/j.1467-971X.2003.00325.x
- Lee, J. S., & Oxelson, E. (2006). “It’s Not My Job”: K–12 teacher attitudes toward students’ heritage language maintenance. Bilingual Research Journal, 30(2), 453–477. https://doi.org/https://doi.org/10.1080/15235882.2006.10162885
- Lenth, R. (2020). Emmeans: Estimated marginal means, aka least-squares means. 2018. R package version 1.4.4. https://CRAN.Rproject.org/package=emmeans
- Nesdale, A. R., & Rooney, R. (1990). Effect of children's ethnic accents on adults’ evaluations and stereotyping. Australian Journal of Psychology, 42(3), 309–319. https://doi.org/https://doi.org/10.1080/00049539008260128
- OECD. (2018). Education at a glance 2018: OECD indicators. OECD Publishing. https://doi.org/10.1787/eag-2018-en
- Oliver, R., & Purdie, N. (1998). The attitudes of bilingual children to their languages. Journal of Multilingual and Multicultural Development, 19(3), 199–211. https://doi.org/https://doi.org/10.1080/01434639808666352
- Pantos, A. J., & Perkins, A. W. (2013). Measuring implicit and explicit attitudes toward foreign accented speech. Journal of Language and Social Psychology, 32(1), 3–20. https://doi.org/https://doi.org/10.1177/0261927X12463005
- Pro, S. F. 10 (2003–2015). Sony Creative Software.
- Pulinx, R., Van Avermaet, P., & Agirdag, O. (2015). Silencing linguistic diversity: The extent, the determinants and consequences of the monolingual beliefs of Flemish teachers. International Journal of Bilingual Education and Bilingualism, 20(5), 542–556. https://doi.org/10.1080/13670050.2015.1102860
- R Core Team. (2020). R: A language and environment for statistical computing. R Foundation for Statistical Computing.
- Rosseel, L., Speelman, D., & Geeraerts, D. (2018). Measuring language attitudes using the Personalized Implicit Association Test: A case study on regional varieties of Dutch in Belgium. Journal of Linguistic Geography, 6(1), 20–39. https://doi.org/10.1017/jlg.2018.3
- Ruijven, B. v., & Ytsma, J. (2008). Trijetalige Skoalle yn Fryslân: Onderzoek naar de opbrengsten van het drietalig onderwijsmodel in Fryslân. Fryske Akademy.
- Schneider, W., Eschman, A., & Zuccolotto, A. (2002). E-Prime (Ver-sion 2.0). [Computer software and manual]. Psychology Software Tools Inc.
- Septien, J. M. (2006). Una Escuela Sin Fronteras. La Ensenanza Del Alumnado Inmigrante en Alava. Vitoria-Gasteiz: Coleccion Derechos Humanos ‘Juan San Martın’, Basque Ombudsman.
- Thomas, S. R., Burton Smith, R., & Ball, P. J. (2007). Implicit attitudes in very young children: An adaptation of the IAT. Current Research in Social Psychology, 13(7), 75–85.
- Vertovec, S. (2007). Super-diversity and its implications. Ethnic and Racial Studies, 30(6), 1024–1054. https://doi.org/https://doi.org/10.1080/01419870701599465
- Wheeler, R. S. (2008). Becoming adept at code-switching. Educational Leadership, 65(7), 54–58.
- Wickham, H. (2016). Ggplot2: Elegant graphics for data analysis. Springer-Verlag. https://ggplot2.tidyverse.org
- Wiegand, P. (1992). Places in the primary school. Palmer Press.