
 ?Mathematical formulae have been encoded as MathML and are displayed in this HTML version using MathJax in order to improve their display. Uncheck the box to turn MathJax off. This feature requires Javascript. Click on a formula to zoom.
ABSTRACT
Prompting learners to generate examples has been proposed as an effective way of developing understanding of a new concept. However, empirical support for this approach is lacking. This article presents two empirical studies on the use of example-generation tasks in an online course in introductory university mathematics. The first study compares the effectiveness of a task prompting learners to generate examples of increasing and decreasing sequences, with a task inviting them to classify given examples; it also investigates the effectiveness of different sequences of generation and classification tasks. The second study replicates the investigation of interactions between generation and classification tasks. The findings suggest that there is little difference between the two types of task, in terms of students' ability to answer later questions about the concept.
1. Introduction
Developing learners' understanding of mathematical concepts is a longstanding concern in mathematics education (Rittle-Johnson et al., Citation2015; Skemp, Citation1987). Prompting learners to generate examples has been suggested as an effective way of developing understanding of a new concept (Watson & Mason, Citation2005; Watson & Shipman, Citation2008). However, empirical support for this approach is lacking. Iannone et al. (Citation2011) noted that “empirical support for the hypothesis that example generation aids in concept understanding appears to come from just seven students” (p. 10), and their own experiment (with 53 students) found no difference in performance on a proof production task for students who were prompted to generate examples compared with students who simply read worked examples.
Classification tasks have also been closely associated with concept formation. For instance, Alcock and Simpson (Citation2017) studied students' conceptions of increasing and decreasing sequences by asking them to classify a range of examples. It should be noted that while Watson and Mason (Citation2005) were promoting the value of example-generation tasks, they recognised that such tasks would not provide “everything needed to learn” (p. 141). Thus the question is: how might example-generation tasks be used most effectively alongside other types of task?
This article presents two empirical studies on the use of example-generation tasks in an online course in introductory university mathematics. The first study compares the effectiveness of a task prompting learners to generate examples of increasing and decreasing sequences, with a task inviting them to classify given examples. The classification task was previously used by Alcock and Simpson (Citation2017) to investigate interactions between tasks of different types; inspired by this, the study also investigates the effectiveness of different sequences of generation and classification tasks. The second study replicates the investigation of interactions between generation and classification tasks.
The approach extends the previous experimental work by Iannone et al. (Citation2011) to a larger sample of students, and makes use of an active control condition (i.e. classification rather than simply reading provided examples) since it is embedded in an authentic educational context. It also uses a novel approach of examining students' responses to example generation tasks in an online setting, where computer-aided assessment is used to give automatic feedback on the generated examples (Sangwin, Citation2003).
Following a review of relevant literature, the two studies are presented in turn. The key result from the first study is that there is no difference in subsequent performance between the groups of students based on whether they were given example generation or classification tasks during initial learning. However, there does appear to be evidence of an effect on learning based on the ordering of later generation and classification tasks. This does not replicate in the second study; overall, the results suggest that the effect of varying the order of tasks is small. The article concludes with suggested implications of these results for teaching and for future research.
2. Literature review
Prompting students to generate examples of mathematical objects has been described as “an important and effective pedagogical strategy whose potential is rarely exploited yet which promotes active engagement in mathematics” (Watson & Mason, Citation2005, p. x). Focusing on university mathematics, there is evidence from various studies that example generation tasks are indeed rare. For instance, Paoletti et al. (Citation2018) analysed the content of 11 mathematics lectures at three institutions in the United States, and found that only “two lecturers asked questions that solicited a total of five examples” (p. 10). Analysis of exam questions paints a similar picture; Pointon and Sangwin (Citation2003, Table 5) analysed a total of 486 exam questions from two courses at a UK university, and found only 2.4% of questions asked students to construct examples. More recently, Kinnear et al. (Citation2020) analysed all the assessment tasks in a first-year linear algebra course and found that in the online assessments, up to 11% of the marks were for the “Group C” category which has the construction of examples as one type of task. This shows the promise of computer-aided assessment as a way to evaluate and give feedback on students' examples, even with large groups of students (Sangwin, Citation2003).
There has been substantial interest in example-use in recent research, including a Research Forum at the 30th PME conference (Bills et al., Citation2006) and special issues in leading mathematics education journals (Antonini et al., Citation2011; Bills & Watson, Citation2008; Zaslavsky et al., Citation2019). In an overview of research on this topic, Zaslavsky (Citation2019) distinguished between three settings in which example-use has been studied: spontaneous (i.e. students generate examples unprompted), evoked (i.e. students generate examples in response to a prompt to “give an example”) and responsive (where students react to an example that has been provided). Further, the focus can be on “examples in the process of concept formation” or “examples in proving” (p. 248). For instance, Sandefur et al. (Citation2013) studied students' spontaneous example use in proving, while Watson and Shipman (Citation2008) focussed on the use of evoked examples during concept formation (as in the present work).
The strategies used by students to generate examples have also been a focus for research. Antonini (Citation2006) identified three strategies used by PhD students to generate examples: trial and error, transformation, and analysis, summarised in . Antonini (Citation2011) expands on the strategies by discussing evidence of different “control” processes that participants use to adjust their strategy. This framework has been applied in further research; for instance, Edwards and Alcock (Citation2010a) analysed students' approaches to generating examples of sequences. While the trial and error strategy was most common, some students did use the transformation strategy (albeit sometimes incorrectly).
Table 1. Summary of the three example-generation strategies identified by Antonini (Citation2006).
Other research has focussed on students' affective response to example-generation tasks. Breen et al. (Citation2016) interviewed 10 students about their experience of solving example generation tasks as part of their coursework in a calculus course; the students readily identified these as unfamiliar tasks, but recognised the benefits of engaging with them. Similarly, through a series of case studies, Wagner et al. (Citation2017) illustrated how students in a calculus course “expressed positive changes in their views of productively generating examples for learning and doing mathematics” (p. 230).
However, empirical support for the effectiveness of example generation, whether for concept formation or proving, is lacking. In the largest experimental work to date, Iannone et al. (Citation2011) investigated 53 students' ability to prove claims about a novel concept (“fine function”) after either reading examples or being prompted to generate examples. They found “no significant difference between the proof production success of students who generated examples compared to those who studied worked examples” (p. 9). They suggest a number of reasons which may explain this finding, and Sandefur et al. (Citation2013) offer the further critique that “the use of examples was imposed on the participants without an apparent purpose” (p. 324).
The work of Alcock and Simpson (Citation2017) also touches on this debate. Their study investigated interactions between two different kinds of task – defining and classifying – by varying the order in which these two tasks were presented to different groups of students. A key finding was that the ordering of these tasks led to differences in student performance (with students performing better in the classification task if they were first prompted to state the definition). In their conclusion, Alcock and Simpson suggested it would be useful to investigate “whether co-dependencies between task responses are also present in situations where students are asked to think about meanings of terms before or after completing tasks other than classifying” and specifically note the “debate on the value of example generation” (p. 18) as a possible fruitful direction for further research on interactions between tasks.
2.1. Research focus
In summary, several authors have argued that example generation tasks can help with concept formation (e.g. Bills et al., Citation2006; Dahlberg & Housman, Citation1997; Watson & Shipman, Citation2008; Zaslavsky, Citation1995). However, the findings of Iannone et al. (Citation2011) suggest that generation tasks may not have any particular advantage over other task types, and the authors called for further empirical research to “determine whether and how example generation tasks can lead to significant learning gains” (p. 11).
When considering example generation tasks used alongside other task types, the ordering of tasks may be important (cf. Alcock & Simpson, Citation2017). For instance, it could be that engaging with a classification task before being prompted to generate examples provides scaffolding for learners. On the other hand, starting with a possibly more challenging generation task could present a “desirable difficulty” (Bjork & Bjork, Citation2014) that leads to deeper learning.
The remainder of this article reports on two studies of students' evoked example use in the process of concept formation (Zaslavsky, Citation2019), addressing the following research questions:
| (1) | Does asking students to generate examples help them to learn about the concept? | ||||
| (2) | What effect does generating examples have on subsequent classification, and vice versa? | ||||
3. Study 1
The goal of this study was to address both research questions, with an experiment comparing the outcomes for students based on (1) the initial learning task presented immediately after the definitions (either generation or classification), and (2) the ordering of generation and classification tasks among the sequence of subsequent tasks. The concepts of increasing/decreasing sequences and boundedness of sequences were the targets of the intervention, so that the classification task used by Alcock and Simpson (Citation2017) could be used as one of the initial learning tasks.
The experiment took place in an authentic teaching context: an online course offered to incoming undergraduate students (Kinnear et al., Citation2022), the majority of whom are taking mathematics courses as a compulsory part of their degree (e.g. in mathematics or computer science). In this course, there are no lectures or other scheduled sessions. Instead, students work through a series of online quizzes that combine exposition with exercises (Sangwin & Kinnear, Citation2021). Since the course is one of three that students take during the semester, students are expected to spend around 12 h of independent study time on the course. This independent study includes reading course materials, working on practice problems, and completing an assessed quiz that contributes to their final grade for the course. The experimental tasks were embedded in the existing course materials, during week 9 of 10, when the topic of sequences is covered in the course. Ethical approval for this study was granted through the School of Mathematics at the University of Edinburgh.
3.1. Method
3.1.1. Participants and procedure
All 185 students enrolled on the course were invited to participate in the study, which was described as investigating the “effectiveness of different ways of designing the course materials”. While this group of students was a convenience sample, the expected number of participants compares favourably to previous studies.Footnote1
Students who consented to take part in the study (N = 143) were randomly allocated to one of four groups. The groups covered all possible combinations of two initial learning tasks (classification or generation) and two orders of subsequent tasks (classification-first or generation-first). Students were then shown different versions of the course materials, according to their assigned group.Footnote2 All students were given access to the full set of tasks in the final week of the course, after the experimental results had been gathered. In line with usual practice in the course, students could make multiple attempts at the tasks and received feedback after each attempt. The feedback consisted of a score for the student's response together with a model solution. For the generation questions, some tailored feedback was provided to indicate which of the required properties were satisfied; for instance, “Your example does not appear to be increasing”. The results reported here are based on students' first attempts only.
3.1.2. Materials
The experimental tasks were embedded in the existing course materials, as summarised in . The week of course materials is organised in four sections, with the definitions of increasing/decreasing sequences and boundedness introduced in Section 1.Footnote3 Details of the various tasks are given below, and a copy of the full set of materials (including the feedback shown to students) is available at https://osf.io/6r5cm/.
Figure 1. Overview of the course content (left) with the experimental tasks and their ordering for the four experimental groups (right). Task names include G where the task involves generation, and C where it involves classifying.
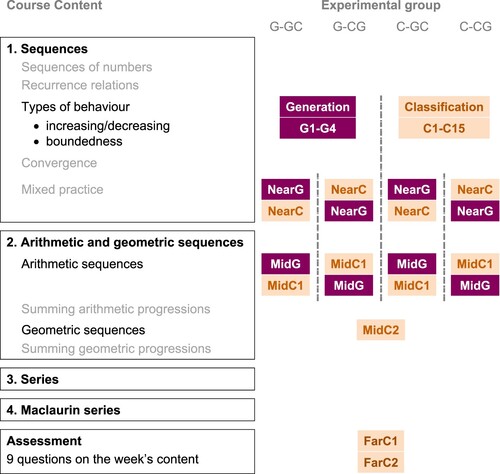
Initial learning tasks. The main experimental manipulation was the nature of the task that immediately followed the definition of increasing/decreasing and bounded sequences: this was either a set of examples to classify, or a sequence of example generation prompts.
The classification task was based on the set of examples used in the classification task by Alcock and Simpson (Citation2017). The 15 examples were presented in 3 groups: 10 lists of terms, 3 sequences defined by formulae, and 2 graphical representations. Within each group, the examples were presented in a random order. Some minor modifications were made to suit the constraints of the online quiz system.Footnote4 For the sequences defined by formulae, students were also asked to classify them as “bounded” or “unbounded” since these terms had been introduced alongside increasing and decreasing, and also featured in the example generation task.
The example generation task was developed in line with the guidance given by Watson and Mason (Citation2005), with the aim of prompting students to generate a similar set of examples to those in the classification task. To this end, different items asked for students to provide examples as formulae, as lists of terms, or as a visual representation of the terms. The tasks are shown in .
Table 2. Content of the initial learning tasks in Study 1.
Subsequent tasks. The existing course materials already included a mix of generation and classification tasks on the target concepts (increasing/decreasing sequences and boundedness properties) after their introduction in Section 1. These are shown in , with names based on Near/Mid/Far to indicate the proximity to the initial learning task (in terms of their location in the course materials).
Figure 2. Distribution of first responses to the classification task. Raw numbers are available in in the appendix.
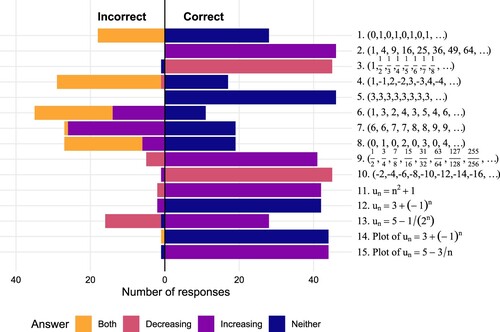
Table 3. Content of the subsequent tasks in Study 1, and the points awarded to each (based on one point for each distinct response).
The final part of Section 1 consisted of “mixed practice” questions on the various ideas introduced in that section, including two questions on the target concepts (NearG and NearC in ).
In Section 2, students were introduced to arithmetic and geometric sequences. Some of the tasks about these concepts also referred to the target concepts (MidG, MidC1, MidC2 in ).
Finally, there were two classification tasks on the target concepts in the final assessment of the week (FarC1 and FarC2). Students' scores in the final assessment contributed to their overall grade for the course (as detailed in Kinnear et al., Citation2022).
As shown in , the order of the Near and Mid tasks was varied based on whether students were in classification-first or generation-first groups.
3.1.3. Bayesian analysis
The main experimental comparison can be thought of as a two-way analysis of variance, based on the types of initial learning tasks (classification or generation) and subsequent tasks (classification-first or generation-first). The approach used here is based on a Bayesian general linear model, which brings many classical tests (including ANOVA) into a common framework (for details, see Kruschke, Citation2015, Chapter 15). While there are other examples of Bayesian analyses in mathematics education (e.g. Foster, Citation2021; Kinnear, Citation2021; Panse et al., Citation2018), this approach is still relatively uncommon, so the remainder of this section gives a brief overview.
In the Bayesian approach, each parameter of interest has an assumed prior distribution of probable values, which is updated in light of the data to produce a posterior distribution. The resulting posterior distributions can be summarised using the median and 95% highest density interval (HDI). The HDI is the range of values around the median value which contain 95% of the mass of the posterior distribution, and has the property that no value outside the HDI is more credible than a value inside the HDI (Kruschke, Citation2018).
For this analysis, the parameters to be estimated are the mean scores for each group of students. The effect of the initial learning tasks can be judged by the difference in mean scores between the classification and generation groups. Computing the contrast between these groups produces another posterior distribution, which can be summarised by its HDI. If the HDI is either entirely positive or entirely negative, that would provide clear evidence in favour of one task type over the other – particularly if the HDI is narrow, suggesting the most likely estimates are all very similar. If the HDI spans 0, with most of the mass of the posterior distribution concentrated around 0, that would suggest there is little or no difference between the two conditions.
In summary, the Bayesian posterior distributions show which parameter values are most probable in light of the experimental data. These distributions, summarised by their HDIs, are more readily interpretable than frequentist confidence intervals, which have a certain probability of including the true parameter value if the same experiment were run many times. A further advantage of the Bayesian approach, particularly in this case, is that it can provide “positive evidence of no difference, not merely lack of evidence of a difference” (Foster, Citation2021, p. 10). A non-significant result in a frequentist hypothesis test cannot be used to conclude that there is no true effect, since there are many other possible explanations (Dienes, Citation2014). The Bayesian posterior distribution can help to distinguish between these possible explanations, since it shows how credible different estimates are. In particular, if all the most credible values are very close to zero, that would represent strong evidence for there being no true effect.
3.2. Results
The main experimental questions are addressed at the end of this section, following details of how students performed in the various tasks. All data and analysis code is available at https://doi.org/10.17605/osf.io/gry6v.
3.2.1. Classification tasks
Students tended to do reasonably well on this task, with a mean score of 10.8/15 (72%). This is broadly in line with the performance of students in the earlier study by Alcock and Simpson (Citation2017, Table 6).
The most common incorrect answers were to classify a sequence as both increasing and decreasing, in cases where the sequence has alternating behaviour (sequences 1, 4, 6, 8; see ). This is despite the expository text preceding the task explicitly addressing sequences of this type:
Note that a sequence can be neither increasing nor decreasing – for example is alternating between
and
so is not consistently increasing or decreasing.
This replicates the findings of Alcock and Simpson (Citation2011): even when students were presented with the definition before classifying, the pattern of errors was very similar to that observed here (see their Table 2).
3.2.2. Generation tasks
In contrast with the classification tasks, few students were successful at the example generation tasks on their first attempt. The mean score across the tasks was 6.9/12 (57%), but with substantial variation across the 12 tasks. shows that students were more likely to answer later questions correctly.
Figure 3. Distribution of correct and incorrect first responses to the generation task.
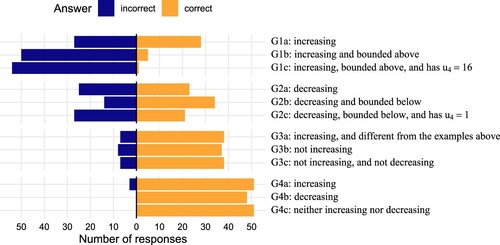
Performance on G1 was very low. The single most common incorrect answer for each part was an integer (typically “1”). This is consistent with student reports of “gaming the system” that emerged in interviews with students about the course (Kinnear et al., Citation2022, Section 4.2.2), suggesting that students were not sure how to answer and were submitting a trivial response in order to see the solution. Only one student gave a correct answer to G1c on their first attempt: . This answer is suggestive of a transformation strategy (Antonini, Citation2011), as it was a modification of the student's example for G1b,
. Two other students gave examples for G1c that were increasing and bounded above, but failed to have
. In each case, these appeared to be failed attempts at transformation of the student's example for G1b (
and
).
Performance on G2 was somewhat better. For G2a, the most common correct response was (7 students) with others of the form a−bn also common (8 students). The most common incorrect responses were of the form n−a (21 students). The improved performance on G2b and G2c could be partly explained by students having had the benefit of seeing a worked solution for G1. The solution given for G1b was
and many students successfully used
to construct examples for G2b (25 students) and G2c (14 students). Again, there was evidence of students adopting a transformation strategy. For instance, several students answered
for G2b and transformed their answers to
or
for G2c. And the most common correct answer for G2c,
(8 students), appeared in all cases to be a transformation of the student's answer to G2b.
For G3, students were asked to give a list of the first 8 terms of a sequence with the given properties. Almost all students who made a genuine attempt at these questions were able to give correct examples. This is interesting, as it suggests students' success in G1 and G2 may have been limited by the requirement to express their response as a formula. Most of the incorrect answers were lists of only one or two terms, suggesting students were simply giving a trivial response in order to see the model solution. For G3b, almost all students gave examples which were decreasing, with 8, 7, 6, 5, 4, 3, 2, 1 the most common (9 students). The exceptions were constant examples like 1, 1, 1, 1, 1, 1, 1, 1 (8 students). For G3c, the most common correct answer was 1, 1, 1, 1, 1, 1, 1, 1 (18 students), with 5 other students using constant sequences. Alternating sequences, such as , were also common (13 students in total).
For G4, almost all responses were correct. This could be because of the graphical nature of the input, which both removes the barrier of having to enter formulae as in G1 and G2, and also provides immediate visual feedback. For G4a and G4b, most students gave examples that appeared to be arithmetic sequences, i.e. with a consistent increment/decrement between terms (as far as was possible given that students were dragging points and could not place them exactly). For G4c, it was common for students to give examples where the terms had alternating signs (13 students). Another group of common answers were constant sequences (6 students).
3.2.3. Subsequent tasks
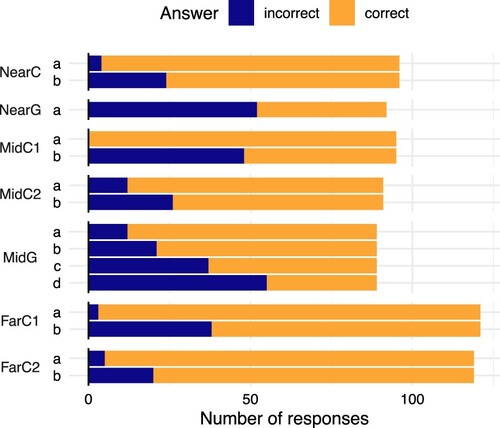
There are three features of note in the students' performance on the subsequent tasks, shown in . First, they confirm the pattern observed in the initial learning tasks: that performance tends to be lower on generation tasks than on classification tasks. Second, within the classification tasks, students are better able to identify whether sequences are increasing/decreasing (part a) than whether they are bounded (part b). Third, the response rate is higher for the Far tasks, which are part of the assessment for the course.
Figure 4. Distribution of correct and incorrect first responses to the subsequent tasks.
3.2.4. Experimental comparison
The main experimental comparison is based on the outcomes for groups with different initial learning tasks (“C- vs G-”). The raw results in suggest that there is a very similar pattern of performance for the groups whose initial learning task was classification (C-CG and C-GC) and whose initial learning task was generation (G-CG and G-GC).
Figure 5. Marks attained in the subsequent tasks by each student in Study 1 (pale dots) together with the estimated mean for each group (solid dots with error bars), represented by the median and 95% HDI of the posterior distribution.
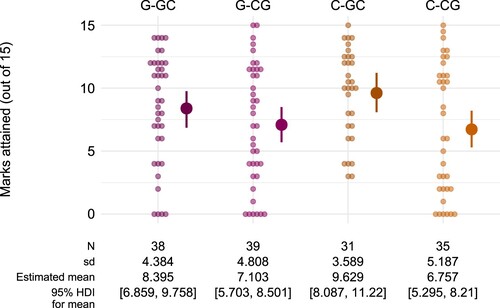
A Bayesian general linear model was used to estimate the mean score on the subsequent tasks for each experimental group, out of a maximum possible score of 15. For this analysis, the priors used were the defaultsFootnote5 provided by the stan_glm function of the rstanarm package (Goodrich et al., Citation2020). The resulting posterior estimates, with 95% HDIs, are shown alongside the raw data in .
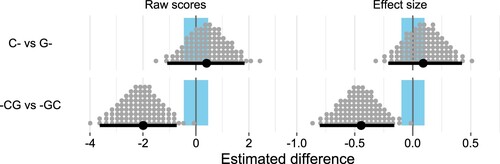
The posterior distribution can also be used to examine differences between the groups, by computing contrasts. The contrast between the C- and G- groups is shown in the top row of . This shows that in the subsequent tasks, students who were assigned the classification task had raw scores that were 0.477 (out of 15) higher than those students assigned the generation task. As an effect size this estimate is 0.104 with 95% HDI . The relatively wide HDI means that we cannot rule out a small effect (in either direction) with any certainty.
Figure 6. Estimates for the contrasts between different groups, as both raw scores and effect sizes (Cohen's d). The horizontal lines show the median and 95% HDI for the estimates, with the posterior distribution illustrated by 100 grey dots. The highlighted region around 0 is the region of practical equivalence, corresponding to a standardised effect size smaller than 0.1.
3.2.5. Interactions between classifying and generating
A striking feature of the results is the difference between the generate-first (-GC) and classify-first (-CG) groups. The contrast between these groups (shown in the bottom row of ) shows that students in the classify-first groups attained about 2.2 fewer marks than the generate-first groups on average. The estimated contrast is with 95% HDI
, and the fact that the HDI is entirely negative indicates a credible difference between the groups. The estimated effect size is
(95% HDI
) which suggests there is a credible medium-sized effect.
This analysis is based on the marks attained across all subsequent tasks, but similar results were obtained when restricting to tasks in the Far test only and when considering marks for questions about boundedness and increasing/decreasing sequences separately (see the supplementary materials at https://osf.io/nzq93/).
The reason for splitting students into the classify-first and generate-first groups was to investigate possible interactions between the classification and generation tasks, just as Alcock and Simpson (Citation2017) did for interactions between defining and classifying. This investigation is postponed to Section 4.2.3, where data from Study 1 is combined with data from Study 2 rather than repeating the analysis for both studies.
3.3. Discussion
This study compared the outcomes for students who were exposed to either example-classification or -generation tasks following the introduction of a new concept. The main experimental result was that there was no difference in students' subsequent performance, based on the type of initial learning tasks. In the initial learning tasks themselves, students tended to find generation more difficult than classification, though neither task was trivial. A surprising finding was that students' subsequent performance did seem to be influenced by the ordering of generation/classification tasks within the subsequent tasks (i.e. there was a difference between -CG and -GC groups).
The main experimental result of no difference between the initial learning tasks is based on an estimated effect size in favour of classification over generation of d = 0.104 (95% HDI ). While this relatively wide HDI does not rule out the possibility of a small effect with any certainty, it should be noted for comparison that in Study 1 of Iannone et al. (Citation2011), the estimated effect size for generation (relative to reading worked examples) was d = −0.13 with 95% confidence interval
.
The limitations of the present study should be noted, many of which stem from the constraints of embedding this study in an authentic teaching context. First, the outcome measures are limited in their extent (e.g. the Far test included only two questions, both of which were based on classifying), since the assessment materials had to maintain an appropriate balance across all the topics in the week. Nevertheless, the measure was suitably discriminating, with students attaining a wide range of scores.
Second, there is a lack of control over the conditions in which the students completed the tasks; for instance, there is no control over time on task, the use of reference materials, or interactions with other students. However, this is true across experimental groups so there is no reason to suppose that this will have biased the results rather than merely adding noise.
Third, in accordance with the usual practice in the course, students were allowed multiple attempts at the tasks. The analyses presented here were restricted to students' first attempts. However, students were provided with feedback after attempting the tasks (except the Far items placed in the weekly assessment, where feedback was withheld until after the deadline). The feedback means that the generation/classification tasks might instead have been operating as “given examples”, with students simply reading and learning from the worked solutions. As noted earlier, there is some evidence of this in (i) several students giving trivial answers in order to access the worked solutions, and (ii) the pattern of students' responses to the generation tasks, e.g. responses to G2 based on which appeared in the model solution to G1. However, such behaviour did not appear to be very prevalent, suggesting that students were genuinely engaging in generation/classification to answer the tasks. In any case, the pattern of experimental results was the same when using only the Far measure, for which feedback was not provided.
A further limitation comes from the fact that the online quizzes only capture students' final responses, unlike previous work (e.g. Iannone et al., Citation2011) where students' written work could be analysed or they could be asked to explain their thinking in task-based interviews. Indeed, Antonini (Citation2011, 216) noted that “examples are generated after intense semiotic activities and argumentations”. Students in the course were encouraged to work on paper before inputting their answers to the e-assessment system, and while there is anecdotal evidence of students following this advice it is unlikely to be universally true. In any case, these workings are not available for analysis.
Despite this limitation of the present study, the responses themselves were in some cases suggestive of strategies such as transformation (as discussed in Section 3.2.2). Further work using qualitative approaches would help to shed light on students' strategies for generating examples. In particular, it would be worthwhile to investigate the possible impact of the online format; as noted in Section 3.2.2, students seemed to find the earlier tasks more difficult and these were the ones that required algebraic input. It could be that some of the students were able to think of an example, but could not readily express it in the required form.
The main finding of this study is the lack of difference between the classification and generation tasks. The implications of this finding, both for teaching and research, will be discussed further in Section 5. A secondary finding was that varying the order of the subsequent tasks did have an effect, with students in the generate-first groups performing better overall. One way of interpreting this result is that these students were benefiting from a “desirable difficulty” (Bjork & Bjork, Citation2014) from the generation task, compared with the more scaffolded path in the classify-first condition. However, the relatively large effect of such a small change is surprising, so Study 2 set out to replicate it.
4. Study 2
The main goals of Study 2 were (i) to replicate the finding in Study 1 about the ordering of tasks, and (ii) to gather further data to address RQ2 on interactions between the generating and classifying tasks. Since Study 1 had found the two initial learning tasks led to similar outcomes, these were consolidated into a single task that combined elements of classifying and generating. This allowed for a simpler experimental design, with students allocated at random to one of two groups: classify-first or generate-first.
4.1. Method
Participants were students on the same course as in Study 1, but in the following academic year. Note that this was the 2020/21 academic year, which was affected by the COVID-19 pandemic. However, the impact on the delivery of this course was minimal as it was always designed to be studied online; students' overall outcomes in the course were also very similar to previous years (Kinnear et al., Citation2022).
As before, students were invited to participate in the study and out of 180 in the class, N = 121 consented. The participating students were divided into the two groups (classify-first and generate-first) at random. As in Study 1, the different groups were shown the materials in different orders.
The only change made to the materials from Study 1 was to replace the initial learning task with a single set of tasks for all students. This was made up of the previous tasks G2, C1-10, and C14-15, to give a mix of generation and classification. Recall that G2 is made up of three sub-parts, so the overall mix is about 20% generation. This choice of tasks fit with the style of the rest of the course materials, and allowed for students to work with a variety of representations (algebraic, lists of terms, and graphical). While all students saw this set of tasks, the position of G2 was different between groups: it was shown first for the generate-first group, while for the classify-first group it was shown last.
The analysis follows the Bayesian approach of Study 1. A further advantage of the Bayesian approach in this case is that data from both studies can be combined to obtain more precise estimates of the effect size. Conceptually, the posterior estimates from Study 1 become prior estimates for Study 2, and the new data will help to further refine these estimates. Such an approach would not be possible with traditional null hypothesis significance testing, since p-values depend on the “intended sampling and testing procedures” (Kruschke, Citation2015, p. 298) and these are difficult to specify in situations where there are multiple rounds of data collection.
4.2. Results
4.2.1. Task performance
Student performance on the initial learning tasks and the subsequent tasks was generally very similar to Study 1; full details can be seen in the supplementary materials (https://osf.io/3p2uk/ and https://osf.io/s5tah/).
One notable difference was in the responses to G2. While 54% of responses in Study 1 were correct, only 23% were correct in Study 2. In Study 1, the most common correct responses for G2b and G2c were based on , which had appeared in the model answer for G1 (see Section 3.2.2). Such responses did not appear at all in Study 2, where G1 had been omitted. Instead, the most common correct response pattern was
for G2b and
for G2c, which is again suggestive of students adopting a transformation strategy (by modifying the example
to obtain a new example with all the desired properties).
4.2.2. Replication of study 1
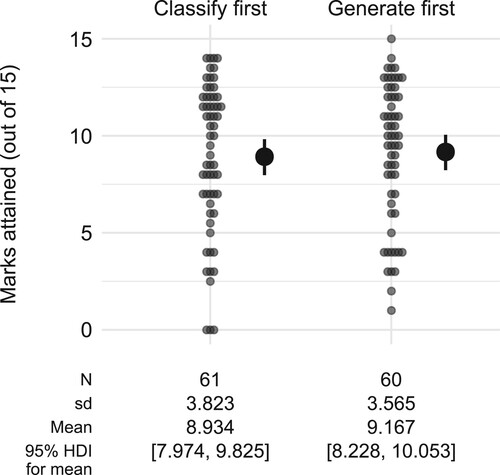
The scores for the two groups are shown in . This shows that (unlike in Study 1) both groups had a very similar level of performance, with mean scores for both groups around 9 out of the maximum possible 15 points from all the subsequent tasks (as shown in ). This impression is confirmed by examining the contrast between the two groups. The difference in raw scores is estimated as , i.e. the classify-first group scored slightly lower than the generate-first group. As an effect size, the estimate is
with 95% HDI
, suggesting there is no difference between the groups, although we cannot rule out a small effect (in either direction) with any certainty.
Figure 7. Marks attained in the subsequent tasks by each student in Study 2 (pale dots) together with the estimated mean for each group (solid dots with error bars), represented by the median and 95% HDI of the posterior distribution.
To estimate the effect size with more precision, data from both studies can be combined. This is similar in spirit to the idea of a meta-analysis that synthesises the findings from multiple studies. As noted above, this could be achieved in the Bayesian approach by using posterior estimates from one study as the priors for the next. In practice, since both data sets here are analysed with the same Bayesian model, the analysis can simply be repeated once on the combined data set, to estimate the effect size using all the available data (for full details, see https://osf.io/fxzeh). There are N = 264 students in the combined sample (135 in the classify-first groups and 129 in the generate-first groups). The overall estimated effect size is (95% HDI
), which suggests that, across the two studies, the generate-first groups benefited from a small positive effect relative to the classify-first groups.
4.2.3. Interactions between classifying and generating
To investigate possible interactions between the classification and generation tasks, data from both studies were combined for a joint analysis. This is possible since, in both studies, the content of the Near and Mid tasks was identical, and the tasks were presented in different orders for the classify-first and generate-first groups. In total, there were N = 207 students who attempted at least one of the Near or Mid tasks. Two different approaches were used to analyse the responses from these students.
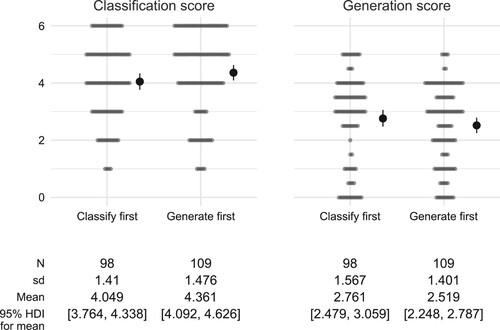
Scores: The first approach is based on comparing scores for different groups, and parallels the analysis of interactions between tasks by Alcock and Simpson (Citation2017, Sections 4.3 and 4.4). For each of the students, the sum of their scores on the NearC and MidC tasks gives a classification score (out of 6), while the NearG and MidG tasks give a generation score (out of 5). The pattern of results is shown in . It appears that students gain a slight advantage at whichever task is second: for classification, the mean score is higher for the generate-first group, while for generation, the mean score appears higher for the classify-first group. However, this is not supported by analysis of the contrasts between the groups in each case: the estimated difference in classification scores is with 95% HDI
, while the estimated difference in generation scores is 0.237 with 95% HDI
. Since both these HDIs span 0, differences between the group means cannot be claimed with any certainty.
Figure 8. Scores on the Near and Mid classification and generation tasks across both studies, with students grouped according to the order the tasks were presented in, together with the estimated mean for each group (solid dots with error bars), represented by the median and 95% HDI of the posterior distribution.
Content: The second approach is to analyse the content of the students' answers for evidence of interactions between the tasks. In particular, it might be expected that examples presented in classification tasks (or in model solutions to earlier tasks) will be available to students in later generation tasks.
For the NearG task, students are asked to give an example of a sequence that is increasing and bounded above. The student responses were classified based on the type of expressions used, as shown in . A relevant example based on was given in the model solution to initial learning task G1, which was only made available to students in the G- groups in Study 1. These students were more likely than other students to give an example for NearG that was based on
(17/48 is far greater than the proportions for other groups shown in ). Another source of relevant examples is the NearC task, which presents an example of the form
; while this is decreasing and bounded below, it could prompt students to think of suitable examples based on
. However, there is no clear difference in the prevalence of
-based answers between students in the classify-first and generate-first groups (24/61 and 23/73 respectively).
Table 4. Types of examples given by students in answer to NearG, broken down by group.
For the MidG task, students are asked to give examples of arithmetic sequences with various properties. Relevant examples are included in the MidC1 task; depending on the random parameters used in the question, this was either increasing and bounded below (hence relevant for MidGa) or decreasing and bounded above (hence relevant for MidGb and MidGc). However, students' answers to MidG only very rarely coincided with the example from MidC1. Out of 176 responses, the example from MidC1 was used verbatim in only 2 examples for MidGa, and only 6 examples across MidGb and MidGc. There were several more cases where students appeared to use slightly modified versions (e.g. using 2−3n when 5−3n had appeared in MidC1); but given the limited range of possible variation in responses to MidG, it is hard to be definitive in concluding that students were influenced by the earlier task.
4.3. Discussion
In contrast with Study 1, there was little evidence for a difference in performance between the classify-first and generate-first groups. However, the combined data from both studies did show evidence of a small effect in favour of the generate-first condition. As noted previously, this could be because students completing the generation task first are benefiting from a “desirable difficulty” that is lessened by first engaging with a classification task.
In terms of interactions between the two task-types, the analysis revealed limited evidence of this across the two studies. There is a suggestion in the pattern of results () that students tended to perform better on the second of the two tasks; however, the analysis of these contrasts was inconclusive. In the content of students' answers, there was no indication that students were influenced by the examples presented in classification tasks preceding the generation tasks. One possible explanation is that students were looking ahead (i.e. the generate-first students were still able to see a relevant example in the subsequent classification question), however the prevalence of generated examples that bore resemblance to examples in the classification tasks was low overall.
There was, however, some evidence of students' generated examples being influenced by examples that had been presented previously in worked solutions. This could be explained by the students drawing on their “accessible example space”, a term used by Goldenberg and Mason (Citation2008, p. 188) to stress that “what comes to mind in the moment is situated: it is dependent on many factors including the context, the cue or trigger, and the state of the individual”. Examples presented recently in instructional text are part of the relevant context; Watson and Mason (Citation2005) note that when learners are presented with reference examples, they are likely to “use the same examples for exploring and expressing their understanding” (p. 57).
Since this study replicated Study 1 with largely the same procedure and materials, it shares the same limitations that stem from the approach of embedding this study in a natural teaching context (as discussed in Section 3.3). It should also be noted that, while Study 2 was intended to replicate one aspect of Study 1, it was not an exact replication since the initial learning tasks were modified. Thus, the results of the combined analysis of the two studies should be regarded as tentative, and further work to replicate these findings would be welcome.
5. General discussion
There are two main findings from these experiments. First, Study 1 established that there was little difference between the classification and generation tasks in terms of students' subsequent performance. Second, the combined analysis of results from both studies found that students' overall performance was higher when generation and classification tasks were presented with the generation tasks first. The remainder of this section discusses the implications of each of these findings in turn.
5.1. Learning from example generation
Despite the positive case made for the value of example generation tasks in concept formation (e.g. Watson & Shipman, Citation2008), the findings from Study 1 suggest that example generation is not any more effective than classification in developing understanding of a new concept. This adds to Iannone et al.'s (Citation2011) finding that example generation tasks were no more effective than reading worked examples. It also rules out one of the possible explanations for their result: “that example generation does indeed facilitate understanding of a new concept but does not facilitate proof production” (p. 9).
How might this lack of advantage for example generation be explained? One possibility is that the example generation tasks used here were inadequate in some way. However, they were designed with great care, following advice set out by Watson and Mason (Citation2005, Chapter 6), so this would suggest that more widespread development of effective example generation tasks for use in teaching would be difficult.
Another possibility is that the target concepts (increasing/decreasing sequences and boundedness) were not suitable, since the terms have a common meaning which may have hindered students' learning. Edwards and Alcock (Citation2010b) report on students' responses to similar example-generation prompts (e.g. “give an example of an increasing sequence that is not strictly increasing”), and note how some students may have been using the everyday sense of the word “increasing” rather than the mathematical definition. Of course, this limitation applies to both the generation and classification tasks so it seems unlikely that this would entirely explain the results. Still, future research should investigate whether example generation can be fruitful in a wider range of topics, and in particular whether it makes a difference if concept names do not coincide with everyday terms.
A further possibility is that students' exposure to example generation tasks in the course was too limited. Moreover, the course materials did not provide students with any “explicit instruction in how to generate examples using strategies that are likely to develop their concept images” (Iannone et al., Citation2011, p. 10). Perhaps in a course where example generation tasks were more common, students would have better-developed example generation strategies and would therefore derive more benefit from the tasks. Wagner et al. (Citation2017) provide an example of a more sustained intervention to encourage and support students to generate examples. There is a need for further empirical work to investigate the outcomes of such approaches, particularly in light of findings in general educational psychology that “enhancing the quality of examples during practice did not yield a concomitant improvement in final test performance” (Rawson & Dunlosky, Citation2016, p. 660).
Finally, as noted in Section 3.3, the requirements of the e-assessment system may have hindered students' example generation. There was some indication that students performed better in the generation tasks that did not require algebraic input (though this is confounded with them being the later tasks). Antonini et al. (Citation2007, p. 2242) noted that
generating examples is linked to activities such as visualisation, exploration, use of informal language […] through the activation of concept images that rely on different representations in different semiotic registers,
whereas the generation tasks required students to produce examples in a given register. It could be that students who found it too difficult to formulate a response in the required form disengaged from the generation task at an early stage, and therefore failed to benefit from the task. However the pattern of results show that, in fact, participation across G1–G4 was relatively stable (see ). Nevertheless, the particular constraints and affordances of setting example generation tasks in e-assessment systems warrants further study (see Section 3.5.3 of Kinnear et al., Citation2022). In particular, it would be valuable for future work to explore the detail of how students approach e-assessment tasks that prompt example generation, and whether there are any differences with findings from previous work that employed paper-based tasks (e.g. Iannone et al., Citation2011).
5.2. Interactions between tasks
Both studies investigated whether students' performance on generation and classification tasks was affected by the order in which they were presented. Study 1 found a medium-sized effect in favour of the -GC groups, who were given a generation task before a classification one, while in Study 2 there was no clear difference between the classify-first and generate-first groups. Analysis of the combined results gives tentative evidence of a small effect in favour of generation-first (d = 0.284 with 95% HDI ).
These results illustrate two methodological points. First, the pattern of results shows the importance of replication in establishing reliable results, particularly as replication efforts have often found substantially smaller effect sizes (Open Science Collaboration, Citation2015). Second, the analysis demonstrates one of the strengths of the Bayesian parameter estimation approach: since this approach “yields an explicit posterior distribution over parameters unaffected by sampling intentions” (Kruschke, Citation2013, p. 593), the data from both studies could be combined to obtain a more precise estimate of the effect size.
5.3. Conclusion
One interpretation of the results is that generation was no worse than classification. That is, students still learned from engaging with the generation tasks; these results simply show that their subsequent performance was not greater than the students who classified examples. This is similar to the recent finding that mathematical etudes (a particular kind of rich task) were “comparable to traditional exercises in their effects on procedural fluency” (Foster, Citation2018). However, as with etudes, generation tasks may have other benefits. In particular, they may help to develop student attitudes toward mathematics (Watson & Mason, Citation2005), with some recent studies lending support to this view (Breen et al., Citation2016; Wagner et al., Citation2017). Further empirical work to investigate possible wider benefits of example-generation would be welcome (Alcock et al., Citation2013).
Two other directions for future work were also suggested. First, it would be valuable to know whether the findings replicate in different contexts, and with tasks on different topics. The importance of such replication work is beginning to be acknowledged in the field (Melhuish & Thanheiser, Citation2018). Second, a qualitative approach involving task-based interviews could help to shed light on the strategies that students use to generate examples, and how these strategies might be influenced by the sequencing of different task types.
Disclosure statement
No potential conflict of interest was reported by the author.
Data availability statement
All data and analysis code is available at https://doi.org/10.17605/osf.io/gry6v.
Notes
1 There were 53 students in Study 1 of Iannone et al. (Citation2011) and 132 in the experiment of Alcock and Simpson (Citation2017).
2 Students who declined to participate (N = 38) were given access to a version of the course materials that was unchanged from the previous year.
3 The definition given was of strictly increasing/decreasing: “The sequence is said to be increasing if
for all n, and decreasing if
for all n”.
4 The sequence of terms beginning was changed to
since it is not straightforward to represent mixed numbers in the online system. Similarly, the sequence defined by
was instead presented as
. Finally, for the graphical representation of an increasing sequence, the vertical axis was dilated to accentuate the pattern.
5 These priors are weakly informative normal distributions, with the scale determined by the observed standard deviation; see http://mc-stan.org/rstanarm/articles/priors.html.
References
- Alcock, L., Gilmore, C., & Inglis, M. (2013). Experimental methods in mathematics education research. Research in Mathematics Education, 15(2), 97–99. https://doi.org/10.1080/14794802.2013.797731
- Alcock, L., & Simpson, A. (2011). Classification and concept consistency. Canadian Journal of Science, Mathematics and Technology Education, 11(2), 91–106. https://doi.org/10.1080/14926156.2011.570476
- Alcock, L., & Simpson, A. (2017). Interactions between defining, explaining and classifying: The case of increasing and decreasing sequences. Educational Studies in Mathematics, 94(1), 5–19. https://doi.org/10.1007/s10649-016-9709-4
- Antonini, S. (2006). Graduate students' processes in generating examples of mathematical objects. In J. Novotná, H. Moraová, M. Krátká, & N. Stehlíková (Eds.), Proceedings of the 30th conference of the international group for the psychology of mathematics education (pp. 57–64). Charles University.
- Antonini, S. (2011). Generating examples: Focus on processes. ZDM, 43(2), 205–217. https://doi.org/10.1007/s11858-011-0317-6
- Antonini, S., Furinghetti, F., Morselli, F., & Tosetto, E. (2007). University students generating examples in real analysis: Where is the definition? In D. Pitta-Pantazi & G. Philippou (Eds.), Proceedings of CERME 5: Fifth conference of the European society for research in mathematics education (pp. 2241–2249). University of Cyprus.
- Antonini, S., Presmeg, N., Mariotti, M. A., & Zaslavsky, O. (2011). On examples in mathematical thinking and learning. ZDM, 43(2), 191–194. https://doi.org/10.1007/s11858-011-0334-5
- Bills, L., Dreyfus, T., Mason, J., Tsamir, P., Watson, A., & Zaslavsky, O. (2006). Exemplification in mathematics education. In J. Novotná, H. Moraová, M. Krátká, & N. Stehlíková (Eds.), Psychology of mathematics education (Vol. 1, pp. 126–154). Charles University.
- Bills, L., & Watson, A. (2008). Editorial introduction. Educational Studies in Mathematics, 69(2), 77–79. https://doi.org/10.1007/s10649-008-9147-z
- Bjork, E. L., & Bjork, R. A. (2014). Making things hard on yourself, but in a good way: Creating desirable difficulties to enhance learning. In M. A. Gernsbacher & J. Pomerantz (Eds.), Psychology and the real world (2nd ed., Chap. 5, pp. 59–68). Worth Publishers.
- Breen, S., O'Shea, A., & Pfeiffer, K. (2016). Students' views of example generation tasks. Teaching Mathematics and Its Applications, 35(1), 27–40. https://doi.org/10.1093/teamat/hrv017
- Dahlberg, R. P., & Housman, D. L. (1997). Facilitating learning events through example generation. Educational Studies in Mathematics, 33(3), 283–299. https://doi.org/10.1023/A:1002999415887
- Dienes, Z. (2014). Using Bayes to get the most out of non-significant results. Frontiers in Psychology, 5, 781. https://doi.org/10.3389/fpsyg.2014.00781
- Edwards, A., & Alcock, L. (2010a). How do undergraduate students navigate their example spaces? In Proceedings of the 13th conference on research in undergraduate mathematics education. MAA.
- Edwards, A., & Alcock, L. (2010b). Using Rasch analysis to identify uncharacteristic responses to undergraduate assessments. Teaching Mathematics and Its Applications: An International Journal of the IMA, 29(4), 165–175. https://doi.org/10.1093/teamat/hrq008
- Foster, C. (2018). Developing mathematical fluency: Comparing exercises and rich tasks. Educational Studies in Mathematics, 97(2), 121–141. https://doi.org/10.1007/s10649-017-9788-x
- Foster, C. (2021). Implementing confidence assessment in low-stakes, formative mathematics assessments. International Journal of Science and Mathematics Education, 2021(7), 1–19. https://doi.org/10.1007/S10763-021-10207-9
- Goldenberg, P., & Mason, J. (2008). Shedding light on and with example spaces. Educational Studies in Mathematics, 69(2), 183–194. https://doi.org/10.1007/s10649-008-9143-3
- Goodrich, B., Gabry, J., Ali, I., & Brilleman, S. (2020). Rstanarm: Bayesian applied regression modeling via Stan. R package version 2.21.1.
- Iannone, P., Inglis, M., Mejía-Ramos, J. P., Simpson, A., & Weber, K. (2011). Does generating examples aid proof production? Educational Studies in Mathematics, 77(1), 1–14. https://doi.org/10.1007/s10649-011-9299-0
- Kinnear, G. (2021). Two-stage collaborative exams have little impact on subsequent exam performance in undergraduate mathematics. International Journal of Research in Undergraduate Mathematics Education, 7(1), 33–60. https://doi.org/10.1007/s40753-020-00121-w
- Kinnear, G., Bennett, M., Binnie, R., Bolt, R., & Zheng, Y. (2020). Reliable application of the MATH taxonomy sheds light on assessment practices. Teaching Mathematics and Its Applications: An International Journal of the IMA, 39(4), 281–295. https://doi.org/10.1093/teamat/hrz017
- Kinnear, G., Jones, I., Sangwin, C., Alarfaj, M., Davies, B., Fearn, S., Foster, C., Heck, A., Henderson, K., Hunt, T., Iannone, P., Kontorovich, I., Larson, N., Lowe, T., Meyer, J. C., O'Shea, A., Rowlett, P., Sikurajapathi, I., & Wong, T. (2022). A collaboratively-derived research agenda for e-assessment in undergraduate mathematics. International Journal of Research in Undergraduate Mathematics Education, 1–31. https://doi.org/10.1007/s40753-022-00189-6
- Kinnear, G., Wood, A. K., & Gratwick, R. (2022). Designing and evaluating an online course to support transition to university mathematics. International Journal of Mathematical Education in Science and Technology, 53(1), 11–34. https://doi.org/10.1080/0020739X.2021.1962554
- Kruschke, J. K. (2013). Bayesian estimation supersedes the t test. Journal of Experimental Psychology: General, 142(2), 573–603. https://doi.org/10.1037/a0029146
- Kruschke, J. K. (2015). Doing bayesian data analysis: A tutorial with R, JAGS, and stan (2nd ed.). Academic Press.
- Kruschke, J. K. (2018). Rejecting or accepting parameter values in Bayesian estimation. Advances in Methods and Practices in Psychological Science, 1(2), 270–280. https://doi.org/10.1177/2515245918771304
- Melhuish, K., & Thanheiser, E. (2018). Reframing replication studies as studies of generalizability: A response to critiques of the nature and necessity of replication. Journal for Research in Mathematics Education, 49(1), 104–110. https://doi.org/10.5951/jresematheduc.49.1.0104
- Open Science Collaboration (2015). Estimating the reproducibility of psychological science. Science, 349(6251), aac4716. https://doi.org/10.1126/science.aac4716
- Panse, A., Alcock, L., & Inglis, M. (2018). Reading proofs for validation and comprehension: An expert-novice eye-movement study. International Journal of Research in Undergraduate Mathematics Education, 4(3), 357–375. https://doi.org/10.1007/s40753-018-0077-6
- Paoletti, T., Krupnik, V., Papadopoulos, D., Olsen, J., Fukawa-Connelly, T., & Weber, K. (2018). Teacher questioning and invitations to participate in advanced mathematics lectures. Educational Studies in Mathematics, 98(1), 1–17. https://doi.org/10.1007/s10649-018-9807-6
- Pointon, A., & Sangwin, C. J. (2003). An analysis of undergraduate core material in the light of hand-held computer algebra systems. International Journal of Mathematical Education in Science and Technology, 34(5), 671–686. https://doi.org/10.1080/0020739031000148930
- Rawson, K. A., & Dunlosky, J. (2016). How effective is example generation for learning declarative concepts? Educational Psychology Review, 28(3), 649–672. https://doi.org/10.1007/s10648-016-9377-z
- Rittle-Johnson, B., Schneider, M., & Star, J. R. (2015). Not a one-way street: Bidirectional relations between procedural and conceptual knowledge of mathematics. Educational Psychology Review, 27(4), 587–597. https://doi.org/10.1007/s10648-015-9302-x
- Sandefur, J., Mason, J., Stylianides, G. J., & Watson, A. (2013). Generating and using examples in the proving process. Educational Studies in Mathematics, 83(3), 323–340. https://doi.org/10.1007/s10649-012-9459-x
- Sangwin, C. J. (2003). New opportunities for encouraging higher level mathematical learning by creative use of emerging computer aided assessment. International Journal of Mathematical Education in Science and Technology, 34(6), 813–829. https://doi.org/10.1080/00207390310001595474
- Sangwin, C. J., & Kinnear, G. (2021). Coherently organised digital exercises and expositions. PRIMUS, 32(8), 927–938. https://doi.org/10.1080/10511970.2021.1999352
- Skemp, R. R. (1987). The psychology of learning mathematics: Expanded american edition (1st ed.). Routledge.
- Wagner, E. R., Orme, S. M., Turner, H. J., & Yopp, D. (2017). Encouraging example generation: A teaching experiment in first-semester calculus. PRIMUS, 27(2), 212–234. https://doi.org/10.1080/10511970.2016.1194340
- Watson, A., & Mason, J. (2005). Mathematics as a constructive activity. Routledge.
- Watson, A., & Shipman, S. (2008). Using learner generated examples to introduce new concepts. Educational Studies in Mathematics, 69(2), 97–109. https://doi.org/10.1007/s10649-008-9142-4
- Zaslavsky, O. (1995). Open-ended tasks as a trigger for mathematics teachers' professional development. For the Learning of Mathematics, 15(3), 15–20.
- Zaslavsky, O. (2019). There is more to examples than meets the eye: Thinking with and through mathematical examples in different settings. The Journal of Mathematical Behavior, 53, 245–255. https://doi.org/10.1016/j.jmathb.2017.10.001
- Zaslavsky, O., Knuth, E., & Ellis, A. (2019). The roles and uses of examples in conjecturing and proving [Special section]. The Journal of Mathematical Behavior, 53, 256–262. https://doi.org/10.1016/j.jmathb.2018.10.001
Appendix
Table A1. Distribution of first responses to the classification task in Study 1.