
ABSTRACT
Operators of mobile machines within forestry work long hours in seated postures while being exposed to whole-body vibration (WBV) that is associated with pain in the lower back and neck. Still, little is known about the contribution from postural loads. In this study postural loads and shock-type WBV exposure on drivers operating a forwarder during terrain-like conditions was measured and quantified using inertial measurement units (IMUs). Five male drivers drove a forwarder repeatedly over standardized steel obstacles using a predefined speed and posture followed by driving over natural obstacles along a terrain course using a self-selected speed and posture. IMUs were affixed along the spine, on the back of the head of the driver and on the seat to detect orientation, velocity, and acceleration. The result shows that the methodology for measuring WBV and postural load with IMUs is feasible. Postural loads, expressed as range of motions (ROMs), when driving over a single standardized obstacle at a speed of 3.3 km/h were up to 21° in the neck segments. Increasing vehicle speed and size of obstacles increased postural loads. The terrain course resulted in higher ROMs in all body segments compared to a standardized obstacle, a difference in sideway seat acceleration but no differences regarding angular velocities of the head. Mechanical shocks at the seat were prevalent but the action limit value was exceeded only for one driver. Postural loads remained small during all conditions indicating that the spine can remain stable during exposure to shock-type WBV of this nature.
Introduction
Operators of mobile machines within forestry work long hours in seated postures while being exposed to whole-body vibration (WBV). Such working conditions have been found to put the operators at increased risk for musculoskeletal disorders (Phairah et al. Citation2016) but also cause decreased productivity (Jack and Oliver Citation2008). Within forestry, the amplitude of WBV exposure often surpasses proposed exposure limits, e.g. the International Standard ISO 2631–1:1997 to reduce potential risk to the driver’s health (Rehn et al. Citation2005; Cation et al. Citation2008; Poje et al. Citation2019). Even though WBV can be caused by, for instance, crane work, it is especially the traveling activities that are causing high magnitudes of WBV exposure (Rehn et al. Citation2005; Jack and Oliver Citation2008; Rottensteiner et al. Citation2013; Haggstrom et al. Citation2016; Poje et al. Citation2019). The exposure levels are increased with increased driving speed and roughness of terrain as seen in skidders (Cation et al. Citation2008) and forwarders (Rehn et al. Citation2005; Poje et al. Citation2019). However, since low speed results in low extraction productivity, there are incentives to tolerate excessive WBV for greater productivity and the related direct economic gains. However, since WBV can result in occupational illness, there is also a need for long-term considerations.
Exposure to whole-body vibration (WBV) has been associated with lower back pain (LBP) (Waters et al. Citation2007; Burstrom et al. Citation2015; Johanning Citation2015) and neck pain (Rehn et al. Citation2004; Johanning et al. Citation2006; Hagberg et al. Citation2007; Mayton et al. Citation2008; Milosavljevic et al. Citation2012). Special consideration should be given to WBV, including mechanical shocks, since it has been proposed to be especially hazardous to the spine (Sandover Citation1998; Waters et al. Citation2007) and is common when driving on irregular terrain e.g. within forestry (Rehn et al. Citation2005; Poje et al. Citation2019). Still, any pathological mechanism between exposure to WBV and back and neck pain are not clear (Bovenzi Citation2009; Griffin Citation2015). Occupational drivers are also exposed, in addition to WBV, to long-term sitting and awkward postures that are individual risk factors that could cause spinal pain and are therefore difficult to differentiate from effects caused by WBV (Jack and Oliver Citation2008; Burstrom et al. Citation2015). The number of occupational drivers driving all-terrain vehicles or tractors and exposed to shock-type WBV is not well known, but approximately 1 million such vehicles have been estimated to be in service in Spain, France, and Germany (Donati et al. Citation2008). Within forestry, the number of operators of forest machines are not well known, but in regions with the highly mechanized operations, much of the work force is exposed to WBV.
The assessment of exposure to WBV is based on the calculation of daily exposure A[8] expressed as equivalent continuous acceleration over an eight-hour period, calculated as the highest root mean square (RMS) value, or the highest vibration dose value (VDV) of the frequency-weighted accelerations, determined on three orthogonal axes (ISO2631-1:1997). Legislation within the European Union (Directive2002/44/EC), based on the International Standard ISO 2631–1:1997, restricts worker exposure to WBV in order to reduce adverse health effects (Griffin Citation2004). The Directive includes exposure action values and exposure limit values for A[8]; 0.5 m/s2, 1.15 m/s2 and VDV; 9.1 and 21 m/s1.75. The exposure action value is a daily amount of VBW exposure above which employers are required to take action to control exposure. The exposure limit value is the maximum amount of VBW an employee may be exposed to on any single day. Neither the exposure action values, nor the exposure limit values in the Directive define safe exposures to WBV (Griffin Citation2004) and do not take into consideration the contribution of postural loads on driver health. Biomechanically, any deviation from an anatomically neutral spinal posture increases the load on the spine. The postural load (physical load on musculoskeletal tissues) is a consequence of worker posture but also depends on external forces (Burdorf Citation1992), e.g. muscle activity and movement reactions of the body. A sudden mechanical shock may cause local deformation in the spine that causes large loads on the intrinsic structures of the body (Dieen Citation2013).
There is an interaction between muscles (active), spinal structures (passive) and neural control (Panjabi Citation1992) for maintaining a stabilized sitting posture. Spinal stability (ability to maintain posture) can be challenged by forces (mechanical shocks) that may strain and sprain surrounding bodily structures giving rise to pain sensations (Panjabi Citation2003). Postural reactions due to mechanical shocks in horizontal directions have recently been studied in laboratory settings (Stenlund et al. Citation2015, Citation2018). These studies show that forceful mechanical shocks (14 m/s2) in purely sideway directions do not cause high muscle activities nor large range of motions (ROMs) along the spine and therefore do not result in a force that would represent a risk for direct musculoskeletal overload (Stenlund et al. Citation2015, Citation2018). However, such results from experimental settings must be verified during actual driving conditions.
Field measurements of driver postures and movement reactions have previously been difficult to measure directly. Inertial measurement units (IMUs), common in navigation and now common in fitness trackers, may provide new information about postural loads and can be used synchronously to also measure acceleration in the seat of the vehicle as well as the body. Similar systems have been used to measure the posture of drivers in different types of vehicles (Hermanns et al. Citation2008; Raffler et al. Citation2017). However, neither of these studies presented postural loads as a result of mechanical shocks or within forestry. Since operators within forestry often surpass WBV exposure limits, especially during transports that include mechanical shocks (Rehn et al. Citation2005; Poje et al. Citation2019) the possibility to measure postural load with IMUs seems of great importance. If the IMUs can be proven to work within a forestry environment this may bring new knowledge about the actual postural load on the operator that previously has not been possible. Thus, the purpose of our study was to use IMUs to measure and quantify seated postural loads during shock-type WBV exposure on drivers operating a forwarder on terrain-like conditions.
Materials and methods
Participants
Five male drivers (mean 23 years, 173 cm, 68 kg) with varied experience of driving forest machines participated. Three of the drivers were vocational education students training to become forest machinery drivers. The other two drivers were experienced drivers (more than five years) and teachers of the students. Written informed consent was obtained from each driver prior to participation. The study was approved by the Regional Ethical Review Board in Umeå, Sweden (Dnr. 2016-109-32M).
Design
This study used a repeated-measurement design in which the drivers drove an eight wheeled forwarder, Valmet 840.2 (2003) (), on two different courses. Course A was a gravel track along which three standardized obstacles were placed 17 meters apart in a straight line. The three standardized obstacles, previously used in another study and setting (Ismoilov et al. Citation2015), were made of iron and were placed out in the following order according to their heights: Small, 15 cm; Medium, 25 cm; Large, 35 cm (). Course B was circular (50 meters in circumference) and consisted of natural obstacles, mainly stones and tree roots. The forwarder, used within forestry to load and transport timber from logging to a roadside landing, was adjusted to be capable of 3 km/h at maximum speed, which is similar to the average speed (loaded 2.9 and unloaded 3.4 km/h) registered during real conditions (Manner et al. Citation2016). The drivers’ posture was not restrained by any external fixation i.e. no seatbelt. The driver was instructed to face forward while seated in their self-selected posture and drive over the obstacles with all four wheels (two front and two rear wheels) on the right side of the machine. The driver was also instructed to avoid voluntary bending and twisting of the upper body. The instructions were intended to keep the drivers’ head and torso in a neutral position and be able to quantify the movement reaction caused by the mechanical shock and not voluntary movements. After the whole vehicle had passed all three obstacles, the driver stopped the forwarder before returning to the start. Course A was completed first six times with a short break between each trial. Course B was then completed three times at self-selected speeds with a short break between each trial and no restrictions were imposed regarding sitting posture.
Figure 1. Forwarder Valmet 840.2. driving over a large obstacle
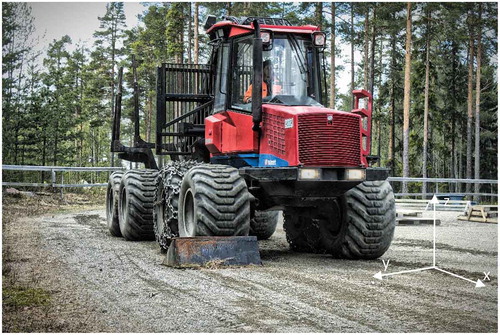
Figure 2. Dimensions of the steel obstacles for Course A: small, medium and large
Measurements
Kinematics were measured by an analysis system (MoLabTM, AnyMo AB, Sweden) consisting of five inertial measurement units (IMUs) sampled at a rate of 128 Hz. Data from the IMUs were low pass filtered at 64 Hz to avoid aliasing effects. Each IMU (MPU-9150TM, InvenSense Inc., USA) included three axis gyros (16 bits, full-scale range set at ± 2000 °/s) and three axis accelerometers (16 bits, full-scale range set at ±16 g), which together detected the three-dimensional postural angles and motions of the object. The precision and accuracy of this system have been evaluated before for movements between different human body segments (Ohberg et al. Citation2013). The IMUs were placed on the left side of the seat of the vehicle, the back of the head and level with the spinal processes of C4, Th2 and S2 on the drivers. The seat and spinal IMUs were affixed with adhesive tape. The head IMU was affixed on an elastic and adjustable headband which was worn on the back of the head of the driver. The seat IMU measured seat acceleration (m/s2), which was used to calculate WBV. The head IMU measured acceleration and angular velocity (°/s) of the head, since transmissibility of WBV from seat to head has been shown to be maintained or even enhanced (Paddan and Griffin Citation1988, Citation1994). Movements within the spine were described as relative angles between two adjacent IMUs and analyzed in the sagittal, frontal and horizontal plane. Four spinal segments were defined: 1. Upper Neck (Head to C4), 2. Lower Neck (C4 to Th2), 3. Trunk (Th2 to S2), and 4. Pelvis (S2 to seat). Time intervals for data extractions were defined for Course A using visual inspection of the accelerations from the IMU at the seat. The first time interval started when distinct accelerations were generated due to contact of the first front wheel with each respective steel obstacle, using baseline accelerations from driving on gravel, and stopped when baseline accelerations were reestablished after the second front wheel had left the respective obstacle. The second time interval was defined similarly using the first and second rear wheel. In total, six time intervals were defined. Kinematics are presented as range of motion (ROM) using peak angle displacements, positive and negative, for each segment, in each plane and for each time interval of Course A and for the whole of Course B. ROM was chosen to represent postural load since the drivers seated posture equilibrium is challenged by mechanical shocks that the driver must counteract to avoid excessive movements.
Data processing
WBV and shock measurements were performed along three orthogonal axes (x-forward/backward, y-sideway and z-vertical) during the duration (T) for driving one complete terrain course. The vibration was registered on the seat with a sampling rate of 128 Hz, weighted according to Iso2631-1:Citation1997(1997) and averaged to a frequency weighted RMS acceleration value for each direction, i.e. awx (t), awy(t) and awz(t). The vibration total value (av) of all three axes was also calculated (EquationEq. 1(1)
![]() $${{\rm{a}}_{{\rm{v1}}}}{\rm{ = }}{\left({{\rm{1}}{\rm{.}}{{\rm{4}}^{\rm{2}}}{{\rm{a}}_{{\rm{wx}}}}^{\rm{2}}{\rm{ + 1}}{\rm{.}}{{\rm{4}}^{\rm{2}}}{{\rm{a}}_{{\rm{wy}}}}^{\rm{2}}{\rm{ + }}{{\rm{a}}_{{\rm{wz}}}}^{\rm{2}}} \right)^{{\rm{1/2}}}}\,\,\,\,\,\left({{\rm{m/}}{{\rm{s}}^{\rm{2}}}} \right){\rm{, a= acceleration}}$$)
$${{\rm{a}}_{{\rm{v1}}}}{\rm{ = }}{\left({{\rm{1}}{\rm{.}}{{\rm{4}}^{\rm{2}}}{{\rm{a}}_{{\rm{wx}}}}^{\rm{2}}{\rm{ + 1}}{\rm{.}}{{\rm{4}}^{\rm{2}}}{{\rm{a}}_{{\rm{wy}}}}^{\rm{2}}{\rm{ + }}{{\rm{a}}_{{\rm{wz}}}}^{\rm{2}}} \right)^{{\rm{1/2}}}}\,\,\,\,\,\left({{\rm{m/}}{{\rm{s}}^{\rm{2}}}} \right){\rm{, a= acceleration}}$$)
The crest factor (CF), defined as the ratio of the maximum instantaneous peak value of the frequency-weighted acceleration signal to its RMS value, may be used when WBV contains occasional shocks. A value above 9 indicates that e.g. the vibration dose value VDV, which is more sensitive to peaks, preferably should be used for describing the vibration in relation to the health effects among human beings. VDV is calculated according to ISO 2631–1: 1997 EquationEq (2)(2)
 $${\rm{VDV = }}{\left\{ {\left. {\int\limits_{\rm{0}}^{\rm{T}} {{{{\rm{[}}{{\rm{a}}_{\rm{w}}}{\rm{(t)]}}}^{\rm{4}}}{\rm{dt}}} } \right\}} \right.^{{\rm{(1/4)}}}}{\rm{(m/s1}}{\rm{.75),0 = starting\ time, \!\!\!\!\!\!\!\!\!\!\!\!\!\!\!\!\!\!\!\!\!\!\!\!\!\!\!\!\!\!\!\!\!\!\!\rm T = ending\ time,a = acceleration}}$$.
$${\rm{VDV = }}{\left\{ {\left. {\int\limits_{\rm{0}}^{\rm{T}} {{{{\rm{[}}{{\rm{a}}_{\rm{w}}}{\rm{(t)]}}}^{\rm{4}}}{\rm{dt}}} } \right\}} \right.^{{\rm{(1/4)}}}}{\rm{(m/s1}}{\rm{.75),0 = starting\ time, \!\!\!\!\!\!\!\!\!\!\!\!\!\!\!\!\!\!\!\!\!\!\!\!\!\!\!\!\!\!\!\!\!\!\!\rm T = ending\ time,a = acceleration}}$$The daily exposure limit value for the VDV according to the EU Directive 2002/44/EC is 21 m/s1.75 and for the action limit value is 9.1 m/s1.75 compared with the Standard´s 17 m/s1.75 and 8.5 m/s1.75 respectively. Although the directive is based on ISO 2631–1: 1997, it deviates from the guidance in the Standard. Still, the exposure limit value restricts the maximum permissible daily exposures to WBV while the exposure action value is one indication of the need for health surveillance. Neither the exposure action values nor the exposure limit values in the Directive or the Standard define safe exposures to WBV (Griffin Citation2004). WBV data was calculated using the Continuous Sound and Vibration Analysis toolbox (version 1.1) for MATLAB, (version R2017b, The MathWorks, Inc., USA) developed by Edward Zechmann.
Statistics
To compare between factors when driving Course A, a linear mixed model (LMM) for ROM (°) was built. The fixed factors considered in the model were: Obstacle (Small, Medium and Large), Wheels (Front and Rear) and Segment (Upper neck, Lower neck, Trunk and Pelvis). Driver id was set as a random effect. Two-way interactions between fixed factors were tested but not included in the model since none of them had a significant effect. The covariate tested within the model was speed. The baseline was set to Obstacle (Large), Wheels (Rear) and Segment (Upper neck). For comparison between courses, ROM (°), peak acceleration of the seat (m/s2) and angular velocity of the head (°/s) were analyzed using an LMM. The fixed factor considered in the model was Course: A included data from the large obstacle and the front wheels, and B included data from the whole course. The first three repetitions from Course A were used to create equally sized groups when courses where compared. Driver id was set as random effect. The covariate tested within the model was speed. The alpha value was set to 0.05 for all analyzes and a Bonferroni correction was implemented when multiple comparisons were made for the type of shock. To assess the normality assumption, scatter plots of residuals were examined to assess homoscedasticity and normality. Analyses were performed using IBM SPSS version 24 (IBM Corp. IBM SPSS Statistics for Windows, Armonk, NY).
Results
Kinematics were successfully measured on the operator and the seat by an analysis system using five IMUs. An LMM was built for the ROM during Course A for each direction (). Driving over the medium and large obstacles compared to the small obstacle significantly increased all ROMs in all directions. All ROMs also increased with increasing speed and when driving over the obstacle with the front wheels compared with the rear wheels. The ROMs in the upper segments were significantly larger compared to those of the pelvis in all directions. Driving at the medium speed of 3.3 km/h over a large obstacle with the front wheels caused ROMs up to 11° in the pelvis and up to 21° in the neck segments.
Table 1. Linear mixed model (LMM) for Range of Motion (ROM [°]) divided for each direction when driving Course A (standardized obstacles). Number of observations = 720. The factors in this model are Obstacle, Wheels, Segment and Speed. Baseline is set to Obstacle (Large), Wheels on the forwarder (Rear) and Segment (Upper neck). Two-way interactions are not included. The covariate included was Speed. The mean speed during Course A was 3.3 km/h
The output of the sensor located on the driver’s seat for one driver when driving along Course A is illustrated in and for Course B in . The mean speed during Course A was 3.3 ± 0.5 km/h while the mean speed during Course B was 2.9 ± 0.6 km/h for all repetitions and drivers. The peak accelerations of the seat and head were greatest in the vertical direction, 3.8–18.3 m/s2 and 3.2–24.2 m/s2 respectively, depending on the size of obstacle and course (). An LMM showed that there was no difference between Course B and the largest obstacle in Course A regarding peak acceleration of the seat in forward/backward and vertical direction (). Accelerations in sideway direction were significantly reduced (p < 0.01) by 6.1 m/s2 for Course A compared to Course B. Speed had a significant impact on acceleration in all directions. Angular velocity of the head was similar for both courses. Course B produced significantly larger ROMs compared to the large obstacle in Course A in all segments regarding segment and direction (). No noticeable trend between the residuals and the fixed factors was detected in the LMMs.
Table 2. Mean Peak Acceleration [m/s2] for all drivers and repetitions measured at the seat and the head for x (sagittal), y (frontal) and z (vertical) directions provided separately for each obstacle of Course A and the whole course for Course B (terrain)
Table 3. Linear mixed model (LMM) for Angular Velocity Head (AngVel [°]) and Peak Acceleration (Acc [m/s2]) of the seat divided for each direction. Number of observations = 45. The factors in this model are Course and Speed. The baseline is set to driving on Course B (terrain). Deviations from baseline are presented for Course A (standardized obstacles) driving over the large obstacle with the front wheels. The covariate included was Speed
Table 4. Linear mixed model (LMM) for Range of Motion (ROM [°]) divided for each segment and direction. The factors in this model are Course and Speed. Number of observations = 45.The baseline is set to driving on Course B (the terrain course). Deviations from baseline are presented for Course A driving over the large obstacle with the front wheels. The covariate included was Speed
Figure 3. Illustrates the output of the sensor located on the driver’s seat when driving along Course A with 3 standardized obstacles, small, medium and large. The different directions are; X-Forward/Backward, Y-Sideways and Z-Vertical. The acceleration is measured in m/s2 and the time is presented in seconds
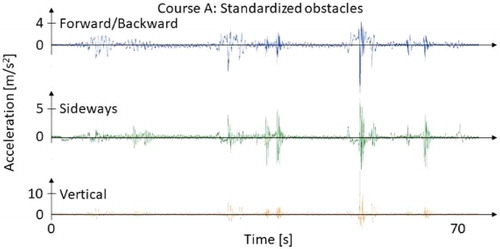
Figure 4. Illustrates the output of the sensor located on the driver’s seat when driving along Course B with natural obstacles. The different directions are; X-Forward/Backward, Y-Sideways and Z-Vertical. The acceleration is measured in m/s2 and the time is presented in seconds
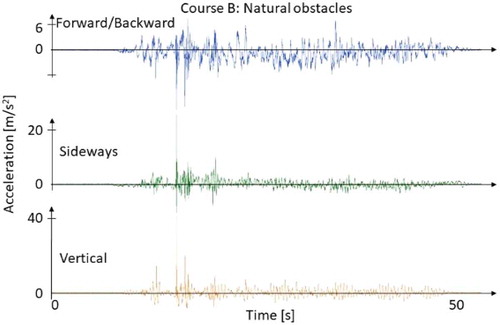
The calculated WBV varied between 0.6–1.5 m/s2 depending on driver and direction and the vibration total value varied between 1.2–2.2 m/s2 (). The CF exceeded nine for all drivers except one. The summarized VDV exceeded the action limit value for one driver.
Table 5. The calculated Whole-body vibration values in each direction and the combined total sum for each driver. The values are presented as mean and standard deviation for the 3 repetitions on the terrain course. Bold values for Crest factor indicate that VDV values should preferably be used. Bold VDV values indicate that the action limit (9.1 m/s1.75) was exceeded
Discussion
This study shows that the methodology using IMUs for measuring shock type WBV and postural load for operators within forestry is feasible. The results exemplify new variables i.e. ROM or angle velocity in different body segments that may be used to understand more about the postural load that operators within forestry are exposed to. The technique using IMUs can be used to measure WBV, posture, reactions and postural load in a way that previously was not possible. The results may be seen in the light of one example on how to use this technique with exemplified outcomes that can be used to understand potential risks factors for operators within forestry.
Vehicle speed and size of obstacle affected postural loads of forwarder drivers but were still regarded as small during the tested conditions. Speed is suggested to increase during stress to maintain high productivity, e.g. during long distances (Berg et al. Citation2019). High productivity demands in rough terrain may therefore cause high postural loads and may be something to consider when setting productivity norms, so the operational productivity goals are balanced to the operators’ risk for occupational health problems.
In this study, postural loads were up to 21° in the neck segments despite driving over the largest steel obstacle with the front wheels at 3.3 km/h. A ROM of approximately 20° or less in each segment conforms to laboratory studies that exposed drivers to single or complex mechanical shocks in sideway directions (Stenlund et al. Citation2015, Citation2018). Even if all ROMs would take place in one direction instead of being evenly distributed, the results in, e.g. neck segments, would be well below the normal capacity (Ferrario et al. Citation2002), indicating that the neck region in this case should be of limited risk for strain injuries from this type of exposure.
Two prior studies have measured posture among drivers with direct methods (Hermanns et al. Citation2008; Raffler et al. Citation2017). However, none of these studies presented ROMs as a direct result of driving over obstacles. Despite the low ROMs seen in our study, the transmission of the mechanical shocks from the seat to the head seem to cause larger ROMs and thereby postural loads in the neck segments compared to the pelvis, which is closer to the origin of exposure. Transmissibility of WBV from seat to head has been shown earlier (Paddan and Griffin Citation1988, Citation1994), which together with the aforementioned result indicates that measuring WBV exposure only at the seat provides inadequate information. Consequently, using IMUs for additional measurements at the head and neck seems appropriate.
The LMM from Course A shows that a smaller obstacle reduced the ROM in all cases except in y-direction, where there was no significant difference (Bonferroni correction p = 0.128) between a large and a medium obstacle. That the size of the obstacle affects the ROM seems logical and the lack of result in y-direction could be due to the large variation among this sample. The model also revealed that there was a larger ROM (1.2–1.7° depending on direction) when driving over the obstacle with the front wheels compared to the rear wheels. This is probably caused by the higher peak accelerations generated at the seat when driving over the obstacle with the front wheels compared to the rear wheels. Therefore, to avoid excessively high levels of postural loads, extra caution should be recommended when driving the front wheels over obstacles.
Course B, including only natural obstacles, caused larger ROMs in all segments and directions compared to driving over the largest steel obstacle of Course A. Whereas Course A caused primarily movement reactions when driving over single obstacles, Course B caused several movement reactions and voluntary movements to improve visual view or orientation of the body when driving over multiple obstacles. Therefore, the angular velocity at the head and not ROMs in the neck may be a better predictor of postural loads due to the sudden movements when driving on irregular terrain and exposure to shock-type vibration. This applies if the highest angular velocities occur as a direct result of mechanical shocks and not voluntary movements, which still has to be proven. The results from this study show that there was no difference regarding angular velocity at the head between the two courses. This may be interpreted as similar impacts on the driver when driving over the largest steel obstacle of Course A compared to Course B. Consequently, the eventual risk for injury should be comparable between the two courses.
The drivers of this study reported that Course A was a greater challenge than driving Course B. The rocks of Course B were considered smaller compared to the largest steel obstacle. However, this did not seem to affect recorded acceleration on the seat since there were no significant differences between courses in the forward/backward or vertical direction. On the other hand, larger accelerations were observed in the sideway direction when driving Course B compared to Course A. Multiple obstacles arising from both sides of the vehicle causing more complex shocks driving Course B may explain this result. The highest peak acceleration was in the vertical direction, with 2–4 times higher peaks compared to the other directions, but according to calculated RMS accelerations, the levels were more evenly distributed between directions. The obtained high CF was a consequence of at least one considerable mechanical shock, despite the fact that the terrain was not considered by the drivers to be particularly difficult. That the terrain used for this analysis was not so rough is shown by the VDV value since only one driver has a summarized VDV that exceeds the action limit value. More rough terrain would probably increase the VDV value and further affect seated postural loads. Still, the measured VDVs in this study are similar to those measured in forwarders during actual work (Rehn et al. Citation2005).
It should be noted that no timber was loaded on the forwarder, so the results might need to be adjusted with a fully loaded carriage. However, driving unloaded is the most vibration generating part of the work cycle for this type of vehicle (Rehn et al. Citation2005). The forwarder was adjusted to deliver a constant 3 km/h during Course A which was registered to be 3.3 ± 0.5 km/h and similar to normal average speed for an unloaded forwarder (Manner et al. Citation2016). However, the standard error shows that there was variation despite the speed controller being set to deliver a certain speed. To compensate for this variability, speed was included in the model as a covariate and proved to affect the model, which conforms with an earlier report of increased WBV at a higher speed (Tiemessen et al. Citation2007). The registered mean speed for Course B (2.9 ± 0.6 km/h) was closer to the normal speed for a loaded forwarder (Manner et al. Citation2016). This indicates that the drivers may have adapted their speed to avoid increased postural loads. Decreasing speed and developing driver skill has earlier been suggested to reduce WBV (Tiemessen et al. Citation2007) and was now also found to decrease postural loads in our study. However, there was large variability among the drivers since the speed was almost double when comparing the quickest with the slowest single repetition.
One limitation in this study was the limited experience of driving a forwarder for three of the five drivers. This may explain the variability that was found regarding speed and thereby possibly affected movement reactions. The driver’s experience may have adapted the movement reaction since e.g. decreased neck muscle activity due to repeated external perturbations have been proven. (Blouin et al. Citation2003; Siegmund et al. Citation2003; Stenlund et al. Citation2016) On the other hand, an experienced driver could as a consequence of exposure to WBV suffer from e.g. LBP that may alter the muscle recruitment (Hodges and Richardson Citation1999) and consequently the movement reaction. All drivers, except one experienced, were light which could have affected the reactions since more bodyweight may dampen bodily reactions (Tiemessen et al. Citation2007). The WBV was assessed with a sensor on the side of the seat and not at the seat/operator interface recommended by (ISO2631-1:1997), so the result should be interpreted with caution. Still, the levels of WBV seem reasonable and adequate to put perspective on the other measurements. The placement of the IMU and sampling frequency from the IMUs should be adjusted in future measurements. The frequency was set to 128 Hz which reduces the possibility to include WBV at higher frequencies. However, a frequency of 128 Hz is sufficient to detect low frequency vibration, weighted to be more harmful to the body compared to high frequency (ISO2631-1:1997) and of most importance during this analysis.
To conclude, it can be stated that the result showed that the methodology using IMUs for measuring shock type WBV and postural load for operators within forestry is feasible and something that could be recommended in order to advance the work of understanding and preventing the occupational health problems caused by WBV. Speed adaptions and suspension systems are well-known ways to minimize WBV, but the new info on postural load might require revisions of acceptable levels of WBV.
The size of postural loads during the tested conditions were modest, but the mechanical shocks caused higher ROMs in the neck segments compared to the pelvis. However, in this specific case, no direct action was needed to comply with occupational health and safety regulations. Since speed and obstacles affect the postural load, there might be a need for action in other cases. When being further developed, IMU systems might be able to give operator feedback in real time, informing about needs for actions to reduce risk for extreme postures or high postural loads while driving.
Acknowledgements
Personnel and students at a college in Northern Sweden and Mattias Tegern, Community medicine and rehabilitation Umeå University are acknowledged. Financial support was provided through AFA Insurance, Sweden and a regional agreement between Umeå University and Västerbotten County Council (ALF).
Disclosure statement
This study was made possible through the foundation of AFA Insurance, Sweden. There is no conflict of interest from any of the authors.
Additional information
Funding
References
- Berg S, Ersson BT, Manner J. 2019. Distance driven and driving speed when forwarding during final felling in central sweden. J For Sci. 65(5):183–194. doi:10.17221/23/2019-JFS
- Blouin JS, Descarreaux M, Belanger-Gravel A, Simoneau M, Teasdale N. 2003. Attenuation of human neck muscle activity following repeated imposed trunk-forward linear acceleration. Exp Brain Res. 150(4):458–464. doi:10.1007/s00221-003-1466-9
- Bovenzi M. 2009. Metrics of whole-body vibration and exposure–response relationship for low back pain in professional drivers: a prospective cohort study. Int Arch Occup Environ Health. 82:893–917. doi:10.1007/s00420-008-0376-3
- Burdorf A, 1992. Assessment of postural load on the back in occupational epidemiology. Ph.D. thesis. Erasmus University Rotterdam.
- Burstrom L, Nilsson T, Wahlstrom J. 2015. Whole-body vibration and the risk of low back pain and sciatica: a systematic review and meta-analysis. Int Arch Occup Environ Health. 88(4):403–418. doi:10.1007/s00420-014-0971-4
- Cation S, Jack R, Oliver M, Dickey JP, Lee-Shee NK. 2008. Six degree of freedom whole-body vibration during forestry skidder operations. Int J Ind Ergon. 38(9):739–757. doi:10.1016/j.ergon.2007.10.003
- Dieen PHJCJV. 2013. Spinal control: the rehabilitation of back pain. 1st ed. Hodges PW, CholewickiJ, Van Dieen J. (Eds.,). Toronto: Churchill Livingstone.
- Donati P, Schust M, Szopa J, Starcket J, Iglesias EG, Senovilla LP, Fischer S, Flaspöler E, Reinert D, Op de Beeck R. 2008. Workplace exposure to vibration in europe: an expert review. Luxembourg: European Agency for Safety and Health at Work (EU-OSHA).
- Ferrario VF, Sforza C, Serrao G, Grassi G, Mossi E. 2002. Active range of motion of the head and cervical spine: a three-dimensional investigation in healthy young adults. J Orthop Res. 20(1):122–129. doi:10.1016/S0736-0266(01)00079-1
- Griffin MJ. 2004. Minimum health and safety requirements for workers exposed to hand-transmitted vibration and whole-body vibration in the european union; a review. Occup Environ Med. 61(5):387–397. doi:10.1136/oem.2002.006304
- Griffin MJ. 2015. Predicting and controlling risks from human exposures to vibration and mechanical shock: flag waving and flag weaving. Ergonomics. 58(7):1063–1070. doi:10.1080/00140139.2014.933887
- Hagberg M, Vilhemsson R, Tornqvist EW, Toomingas A. 2007. Incidence of self-reported reduced productivity owing to musculoskeletal symptoms: association with workplace and individual factors among computer users. Ergonomics. 50:1820–1834. doi:10.1080/00140130701674539
- Haggstrom C, Ohman M, Burstrom L, Nordfjell T, Lindroos O 2016. Vibration exposure in forwarder work: effects of work element and grapple type. Croat J For Eng. 37(1):107–118. https://hrcak.srce.hr/153476
- Hermanns I, Raffler N, Ellegast RP, Fischer S, Göres B. 2008. Simultaneous field measuring method of vibration and body posture for assessment of seated occupational driving tasks. Int J Ind Ergon. 38:255–263. doi:10.1016/j.ergon.2007.05.007
- Hodges PW, Richardson CA. 1999. Altered trunk muscle recruitment in people with low back pain with upper limb movement at different speeds. Arch Phys Med Rehabil. 80(9):1005–1012. doi:10.1016/S0003-9993(99)90052-7
- Ismoilov A, Sellgren U, Andersson K, Löfgren B. 2015. A comparison of novel chassis suspended machines for sustainable forestry. J Terramech. 58:59–68. doi:10.1016/j.jterra.2015.01.002
- Iso2631-1:1997. 1997. Mechanical vibration and shock- evaluation of human exposure to whole-body vibration part1: general requirements. Genève: International Organization for Standardization.
- Jack RJ, Oliver M. 2008. A review of factors influencing whole-body vibration injuries in forestry mobile machine operators. Int J For Eng. 19(1):51–65. doi:10.1080/14942119.2008.10702560
- Johanning E. 2015. Whole-body vibration-related health disorders in occupational medicine–an international comparison. Ergonomics. 58(7):1239–1252. doi:10.1080/00140139.2015.1005170
- Johanning E, Landsbergis P, Fischer S, Christ E, Göres B, Luhrman R. 2006. Whole-body vibration and ergonomic study of us railroad locomotives. J Sound Vib. 298(3):594–600. doi:10.1016/j.jsv.2006.06.030
- Manner J, Palmroth L, Nordfjell T, Lindroos O. 2016. Load level forwarding work element analysis based on automatic follow-up data. Silva Fennica. 50(3). doi:10.14214/sf.1546
- Mayton AG, Kittusamy NK, Ambrose DH, Jobes CC, Legault ML. 2008. Jarring/jolting exposure and musculoskeletal symptoms among farm equipment operators. Int J Ind Ergon. 38(9):758–766. doi:10.1016/j.ergon.2007.10.011
- Milosavljevic S, Bagheri N, Vasiljev RM, McBride DI, Rehn B. 2012. Does daily exposure to whole-body vibration and mechanical shock relate to the prevalence of low back and neck pain in a rural workforce? Ann Occup Hyg. 56:10–17. doi:10.1093/annhyg/mer068
- Ohberg F, Lundstrom R, Grip H. 2013. Comparative analysis of different adaptive filters for tracking lower segments of a human body using inertial motion sensors. Meas Sci Technol. 24(8):085703. doi:10.1088/0957-0233/24/8/085703
- Paddan GS, Griffin MJ. 1988. The transmission of translational seat vibration to the head—ii. Horizontal seat vibration. J Biomech. 21(3):199–206. doi:10.1016/0021-9290(88)90170-4
- Paddan GS, Griffin MJ. 1994. Transmission of roll and pitch seat vibration to the head. Ergonomics. 37(9):1513–1531. doi:10.1080/00140139408964931
- Panjabi MM. 1992. The stabilizing system of the spine. Part I. Function, dysfunction, adaptation, and enhancement. J Spinal Disord. 5(4):383–389. discussion 397. doi:10.1097/00002517-199212000-00001
- Panjabi MM. 2003. Clinical spinal instability and low back pain. J Electromyogr Kinesiol. 13:371–379. doi:10.1016/S1050-6411(03)00044-0
- Phairah K, Brink M, Chirwa P, Todd A. 2016. Operator work-related musculoskeletal disorders during forwarding operations in south africa: an ergonomic assessment. Southern For. 78(1):1–9. doi:10.2989/20702620.2015.1126781
- Poje A, Grigolato S, Potocnik I. 2019. Operator exposure to noise and whole-body vibration in a fully mechanised ctl forest harvesting system in karst terrain. Croat J For Eng. 40(1):139–150. http://www.crojfe.com/site/assets/files/4295/poje.pdf.
- Raffler N, Rissler J, Ellegast R, Schikowsky C, Kraus T, Ochsmann E. 2017. Combined exposures of whole-body vibration and awkward posture: a cross sectional investigation among occupational drivers by means of simultaneous field measurements. Ergonomics. 60(11):1564–1575. doi:10.1080/00140139.2017.1314554
- Rehn B, Lundström R, Nilsson L, Liljelind I, Järvholm B. 2005. Variation in exposure to whole-body vibration for operators of forwarder vehicles—aspects on measurement strategies and prevention. Int J Ind Ergon. 35(9):831–842. doi:10.1016/j.ergon.2005.03.001
- Rehn B, Nilsson T, Jarvholm B. 2004. Neuromusculoskeletal disorders in the neck and upper extremities among drivers of all-terrain vehicles–a case series. BMC Musculoskelet Disord. 5:1. doi:10.1186/1471-2474-5-1
- Rottensteiner C, Tsioras P, Neumayer H, Stampfer K. 2013. Vibration and noise assessment of tractor-trailer and truck-mounted chippers. Silva Fennica. 47(5). doi:10.14214/sf.984
- Sandover J. 1998. High acceleration events: an introduction and review of expert opinion. J Sound Vib. 215(4):927–945. doi:10.1006/jsvi.1998.1604
- Siegmund GP, Sanderson DJ, Myers BS, Timothy Inglis J. 2003. Rapid neck muscle adaptation alters the head kinematics of aware and unaware subjects undergoing multiple whiplash-like perturbations. J Biomech. 36(4):473–482. doi:10.1016/s0021-9290(02)00458-x
- Stenlund T, Öhberg F, Lundström R, Lindroos O, Häger C K, Neely G, Rehn B. 2016. Adaptation of postural reactions in seated positions and influence of head posture when exposed to a single sideway perturbation: relevance for driving on irregular terrain. J Nov Physiother Phys Rehabil. 3(1):022–029. doi:10.17352/2455-5487.000031
- Stenlund TC, Lundstrom R, Lindroos O, Häger CK, Burström L, Neely G, Rehn B. 2015. Seated postural neck and trunk reactions to sideways perturbations with or without a cognitive task. J Electromyogr Kinesiol. 25(3):548–556. doi:10.1016/j.jelekin.2015.03.002
- Stenlund TC, Ohberg F, Lundstrom R, Lindroos O, Häger CK, Neely G, Rehn B. 2018. Double-sided mechanical shocks provoke larger seated postural reactions compared with single-sided mechanical shocks. Spine. 43(8):E482–e487. doi:10.1097/BRS.0000000000002396
- Tiemessen IJ, Hulshof CTJ, Frings-Dresen MHW. 2007. An overview of strategies to reduce whole-body vibration exposure on drivers: a systematic review. Int J Ind Ergon. 37(3):245–256. doi:10.1016/j.ergon.2006.10.021
- Waters T, Rauche C, Genaidy A, Rashed T. 2007. A new framework for evaluating potential risk of back disorders due to whole body vibration and repeated mechanical shock. Ergonomics. 50:379–395. doi:10.1080/00140130601089978