
 ?Mathematical formulae have been encoded as MathML and are displayed in this HTML version using MathJax in order to improve their display. Uncheck the box to turn MathJax off. This feature requires Javascript. Click on a formula to zoom.
ABSTRACT
This paper uses Data Envelopment Analysis (DEA) to evaluate how the technical efficiency of forest harvesting operations is influenced by terrain conditions and forest attributes, in addition to exploring the existence of other influencing factors. To this end, 643 shift-level observations of harvesting operations on 253 distinct harvested sites were used. The aim of this study is to highlight the harvester’s ability to maximize the outputs, represented by the number of assortments for various tree species, given inputs such as harvest volume, harvest time for various tree species, and distance traveled by the harvester. Operational environment variables such as harvest, or decision-making unit (DMU) size, shape, and terrain characteristics were included. We found large variations in efficiency scores, and that inefficient harvest operations could theoretically be improved by reducing input by up to ca. 80%. A second stage regression estimation was applied to identify which factors significantly affected inefficiency. It was found that the inefficiency decreases with increasing stem-volume for pine and broadleaves, increasing stand density, and increasing share of pulpwood and non-marketable timber, while it increases with the number of logs produced per tree (in broadleaves). Inefficiency increases also with an increasing ratio of actual travel distance to minimal travel distance. The study shows how adopting DEA methods in forest operations might be used in combining efficiency analysis and environmental factors, by identifying and measuring inefficiency due to, for example, difficult terrain.
Introduction
Forests represent one of Europe’s most important renewable resources, providing multiple benefits to economies and society. EU priorities in this sector are to promote sustainable and equitable forest management to reduce poverty, increase the use of sustainably produced wood and other forest products, and meet international environmental obligations (European Commission Citation2013). At the same time the sector is expected to ensure access to valuable resources and sustain the competitiveness of the industries that depend on forests and forest products (Piotrowski et al. Citation2016). Efficient forest harvesting is crucial in enabling a sustainable timber value chain. Over the past 50 years, time and motion studies have been carried out with the aim of improving efficiency and competitiveness of mechanized harvesting operations. Opportunities for rationalization are continuously being sought, as modern timber harvesting is an economically marginal process requiring relatively high capital investment (Hiesl and Benjamin Citation2013) in producing low value commodities. These studies have therefore looked into a range of factors that might improve productivity, including technical machine adaptations (Jundén et al. Citation2013; Ortiz Morales et al. Citation2014; Ziesak and Strydom Citation2014; Lindroos et al. Citation2015), the effects of stem volume and stand density (Plamondon and Pitt Citation2013; Spinelli and Magagnotti Citation2013; Strandgard et al. Citation2013), the effect of terrain slope (Stampfer and Steinmüller Citation2001; Alam et al. Citation2013; Visser and Stampfer Citation2015), the selection of assortments and bucking patterns (Räisänen and Nurmi Citation2014; Labelle et al. Citation2017), the sequencing of harvest sites in terms of product availability (Öhman and Lämås Citation2003; Shahi and Pulkki Citation2015), product destination (Bergdahl et al. Citation2003), and seasonality of harvest (Karlsson et al. Citation2004), or simply in minimizing effective work time losses when relocating between work sites (Talbot and Suadicani Citation2015).
The provision of larger datasets and key performance indicators (KPI) for performance analyses in harvesting operations is possible nowadays thanks to technical developments facilitating the transmission or remote collection of standardized forest machine and communications data, StanForD (Arlinger et al. Citation2012). In Scandinavia alone, the high percentage of mechanized cut-to-length (CTL) operations and mean stem volumes of roughly 0.3 m3 at final harvest imply that data from some hundreds of millions of trees are recorded in StanForD files each year. These provide a considerable basis for the in-depth analysis of harvesting operations, providing the forestry sector with the potential for a significant knowledge gain (Baardsen et al. Citation2009). Widespread automated data collection and analysis may not only be useful for improving the understanding of the multi-dimensional aspects of efficiency. Real-time estimation of efficiency scores and feed-back of benchmarking reports to the operator may contribute to increased learning and behavioral change of operators which may feed forward to a further increase in overall performance (Astrup et al. Citation2018). A number of studies have applied StanForD generated data to describe cut-to-length machine productivity (Palander et al. Citation2013; Strandgard et al. Citation2013; Eriksson and Lindroos Citation2014; Walsh and Strandgard Citation2014; Manner et al. Citation2016; Olivera et al. Citation2016; Brewer et al. Citation2018). Productivity is conventionally analyzed using multiple regression techniques.
A more general case including multiple inputs and multiple outputs requires the use of simultaneous equations which are fitted to the input-output data. This may be a rather complex process, assigning weights to aggregate the outputs or to aggregate the inputs (Thanassoulis Citation1993). Furthermore, regression analysis may impose strong functional form restrictions. An example of such an assumption is that the input and output can be scaled proportionally (i.e. constant returns-to-scale). Non-parametric approaches such as Data Envelopment Analysis (DEA) allows for various scale assumption, whether input–output relations are constant, increasing, decreasing, or variable to scale. Another problem with traditional KPIs is that they do not capture relationships related to the substitution of inputs and outputs. This means that it is often impossible to perform well on multiple KPIs. Thus, these partial benchmarks may create misleading comparisons by ignoring the interaction between production factors (Bogetoft Citation2012).
Benchmarking methods such as DEA and Stochastic Frontier Analysis (SFA) have been applied to study how multiple factors may influence machine and systems productivity and efficiency (Lebel Citation1996), both in terms of technical and allocative efficiency (Farrell Citation1957). Despite the popularity of these methods within management literature (Lebel et al. Citation1999), they have been less frequently applied in forest operations research. A search for relevant DEA and SFA studies in Web of Science (October 2018) using “dea,” “sfa,” “efficiency,” and ”benchmarking” as keywords, revealed 48 references. Excluding conference proceedings, reviews, methods papers without case applications, and papers mentioning DEA or SFA studies but not implementing an efficiency analysis, the search resulted in 18 studies. DEA and SFA have generally been used to assess the efficiency of forestry organizations or wood and paper industries as a whole (Lebel and Stuart Citation1998; Baardsen et al. Citation2009). Only a few studies have applied DEA to assess the efficiency of harvest operations (Aalmo and Baardsen Citation2015; Obi and Visser Citation2017a, Citation2017b).
The current study applied DEA to quantify the efficiency of harvesting operations. We applied data from 253 distinct physical harvested sites in Norway, constituting 643 shift-level observations to quantify how inefficiency is influenced by forest attributes (tree species and species mixes, stocking density, tree sizes, defects), harvest site topography (terrain ruggedness, mean slope, and stand shape) and operational parameters (driving distances within the stand, number of assortments produced, manual overriding in bucking). Previous studies (Obi and Visser Citation2017b) quantify the efficiency of harvest operations from various environmental conditions (e.g. topography). The current study modifies the DEA model to estimate the efficiency scores of harvest operations on comparable sites. The aim of this study is to illustrate a non-parametric performance analysis of harvest operations which are assumed to be comparable according to working conditions of the harvester. Another aim was to apply second-stage regression of efficiency to discuss how inefficiency is influenced by forest attributes, harvest site topography, and operational parameters. We also discuss how the application of DEA may not only provide information on efficiency but also on possibilities for improvement.
Materials and methods
Efficiency
Productivity, e, of forest harvesting operations is traditionally expressed as the total volume of harvested wood divided by total harvesting time(Eq. 1).
The higher the ratio Y/X, the more efficient the harvesting operation. However, there are other inputs (e.g. fuel consumption) and outputs (e.g. production of certain assortments) which affect the profitability of the business and need to be incorporated into (Equation 1) while retaining an intuitive representation.
Let N inputs produce M outputs
. An obvious candidate is to aggregate both the inputs and outputs using some weights
for the outputs and
for the inputs (Eq. 2):
The interpretation of this ratio is the same as above but in this case, appropriate weights must be chosen. When comparing different decision-making units (DMU) e.g. harvesting operations, each of them might show different preferences in the weights they assign to the different inputs and outputs. In fact, they will assign a lot of weight to inputs of which they use very low quantities and a lot of weight to the outputs they produce a lot of such that Equation 2 becomes as large as possible.
Similarly, they will assign littleweight to high use inputs and to outputs that can only be producedin a small quantity. As DMUs differ a lot in their use of inputs and outputs, it is difficult to reach a consensus on the choice of weights. Charnes et al. (Citation1978) proposed to solve this dilemma by letting every DMU choose their weights such that its value of (2) is maximized. In mathematical terms their solution to the nonlinear programming problem was as follows (Eq. 3):
Here the subscript 0 refers to the DMU under evaluation. The program picks weights u0, v0 for DMU 0 such that DMU 0 appears as best as possible. By construction, (2) cannot be larger than 1. This program is nonlinear because of the unknowns v0 in the denominator. In order to operationalize this, Charnes et al. (Citation1978) normalize the denominator by imposing the extra normalizing constraint v0X0 = 1. This turns the program into a linear programming problem. From duality results of convex analysis, this linear program has an equivalent dual linear program whose objective has the same value (Rockafellar Citation1970). This dual linear program has a useful connection to the production theory.
Data envelopment analysis
The above-mentioned contribution by Charnes et al. (Citation1978) came to be known as Data Envelopment Analysis (DEA). The technology set is defined as follows (Eq. 4):
It is also assumed that this technology set satisfies the following axioms (Färe and Primont Citation1995):
Axiom 1 (Closedness). T is closed.
Axiom 2 (Free disposability of inputs and outputs). if
then .
Axiom 3 (Convexity). T is a convex set: i.e.
.
The closedness axiom is a mathematical regularity property ensuring that its limit points (i.e. the boundary) are also within the set. The free disposablity of inputs and outputs axiom means that if then more inputs and less outputs are also feasible: i.e. one can always “freely” dispose of additional inputs and additional outputs. Finally, convexity implies that a convex combination of feasible observations is also feasible. Convexity implies the presence of divisibilities in time and space.
Inefficiency is measured by means of the directional distance function (Chambers et al. Citation1996) (Eq. 5):
if for some
and
otherwise. Intuitively, this measure finds the largest contraction of inputs in the direction gx and expansion of outputs in the direction gy by a common factor
while still remaining within the same technology set. Thus, the directional distance function projects an observation (X0, Y0) onto the frontier of the technology for a given direction (gx, gy).
Empirically, we approximate the above by the linear program (Eq. 6):
The last constraint on λ imposes variable returns-to-scale.
The three-stage approach of Ruggiero (Citation1998) was followed to incorporate environmental variables into the above model:
Compute Equation 6;
Regress Z on β obtained from the previous step using Ordinary Least Squares (OLS) and compute the aggregate environmental index
using the regression coefficients α;
Compute (6) with the additional constraint:
The additional constraint applied in the final step ensures that only those peers operating in an equal or worse environment than the benchmarked observation are selected, as measured by the aggregate environmental index (i.e. Zindk ≤ Zind0). We refer the interested reader to Ruggiero (Citation1998) for more details and to Estelle et al. (Citation2010); Muñiz et al. (Citation2006) for simulation analysis of different methods to incorporate environmental variables.
Data
Data were collected between 2014 and 2017 in Stjørdal and Selbu municipalities in the county of Trøndelag, central Norway. This region is characterized by a mix of rugged and relatively accessible terrain. StanForD data (primarily.stm files) was submitted by three participating contractors and parsed to the database using an R-script. The dataset is constituted by four harvesters, including two John Deere and two Komatsu machines.
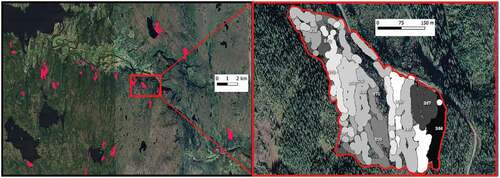
DEA is used to empirically measure the productive efficiency of decision-making units (DMUs). In this study, the DMU was not defined by input and output data at the harvested site level, but rather at a subsite level corresponding to the area harvested during one machine-day. To be able to calculate area, stand density, and location for topographic analysis, perimeters for all DMUs had to be generated from the GPS points. Harvest dates and GPS points automatically registered at the time of felling were used in allocating trees to DMUs. Each GPS point represents the approximate position of the base machine when felling or processing a tree. To generate the perimeter, a buffer with a 10 m radius was created around each GPS point from a given day, and these overlapping buffers were then dissolved to demarcate the outer perimeter of the DMU ().
Figure 1. A scattering of some of the 253 harvested sites seen in the rugged terrain at landscape level (red polygons, left) and a close-up illustrating how one harvested site is made up of multiple DMUs, each shown in a different gray tone (right). Spatially, a DMU represents the area felled by a harvester on any single day. The dataset constituted 643 such DMUs
The dataset originally contained some 299,891 individual stem level observations. The data were cleaned of inconsistencies, and clusters containing less than 30 stems were excluded. The clusters removed mostly represented roadside cleaning, clearings around buildings and homesteads, or the sporadic opening up of trails in providing access to the forest stand. Removing these from the dataset resulted in a final 253 harvested sites, constituting 643 distinct DMUs that were retained for the final analysis.
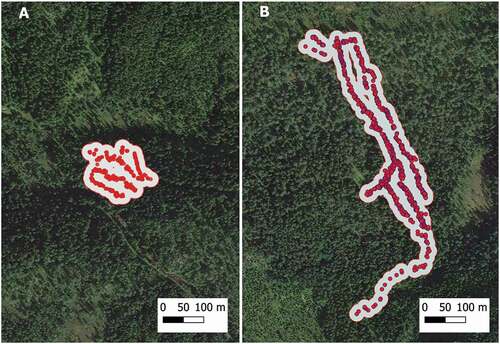
For each of the 643 DMUs, topographic data including the slope, the terrain ruggedness index (TRI), and the isoperimetric quotient (ISOPER) was calculated on the basis of a 10m × 10m aerial laser scanning (ALS) derived digital terrain model (DTM). The TRI represents the sum of differences in elevation between a cell and its surrounding cells and provides an indication of the unevenness of the terrain in the DMU (Riley et al. Citation1999). The ISOPER, defined as the ratio of the DMU area to the area of a circle with equal perimeter (Machl et al. Citation2013), was calculated as an indicator of a DMUs shape, based on the premise that a more convoluted shape would have a negative effect on efficiency (). The metrics Slope and TRI were calculated directly using the tools of the same name available in the QGIS base package (QGIS Citation2019), while ISOPER was derived from the area and perimeter data. The QGIS zonal statistics tool was used to output the mean and standard deviation of the 10 m × 10 m grid cells for Slope and TRI represented within each DMU.
Figure 2. Examples of how stand shape is quantified by the isoperimetric ratio, which is the ratio between stand area and the area of a circle with the same perimeter; (a) a roughly circular stand with isoperimetric ratio = 0.81, and (b) an elongated stand with isoperimetric ratio = 0.13. The points represent the position of the harvester at felling, while the stand polygon is created by buffering these points by 10 m
The dataset is comprised of production data including: harvest volume (HV), stem volume (STEMVOL), harvesting time taken to fell and process each tree (PHTS), the proportion of manual overriding (MANOVR), and the volume distribution to four different assortments (sawlogs, pulpwood, energywood, and reject offcuts). These variables were further distributed to three species groups; pine (S1), spruce (S2), and mixed broadleaves (i.e. birch, willow, alder, and other (S3)). Other data included number of logs (LOGSS), number of stems (STEMS), and the stem share between species in the daily production (SPPshare). An overview of all the variables with their units is given in . Stems with a harvesting time of more than 360 seconds were excluded from the analysis. Descriptive statistics were calculated for all variables related to all the stems on each site. All stem and log volumes are given in m3 solid volume under bark (sub). Summary statistics are provided in .
Table 1. Variables description
Table 2. Summary statistics for the ground conditions (Topography), the machine (Machine related), the site (Site/Forest parameters), and the output produced (Products/Assortments)
Analysis beyond standard efficiency/benchmarking: the harvesting sequence
In order to evaluate the effect of driving distance within the DMU, a theoretical optimal route – disregarding terrain and other influencing factors – was computed. This optimal route provides a lower bound on the actual optimal route and was calculated from the sequential GPS coordinates captured by the harvester at the time of each felling cut. The route was calculated through a two step process: first by creating a distance matrix between every position and then by computing the shortest ”Hamiltonian path” that visits every recorded location only once. The length of this shortest path yields the minimum total travel distance.Footnote1 shows an example of the actual harvesting route (green line) and the computed optimal route (red line) for one of the harvesting sites part of our study. The ratio of the actual travel distance over the computed minimal travel distance measures the worst-case routing inefficiency. shows the distribution of this ratio and indicates that the majority of the observations have a ratio between 1 and 2 with outliers up to 4.
Figure 3. Example of actual route of a harvester vs. the computed minimal route for one harvest site (sparse forest cover, area of DMU is 24.86 ha). The connecting green line shows the order in which trees were cut and the red connecting line shows the order in which the trees should have been cut to minimize the total traveling distance
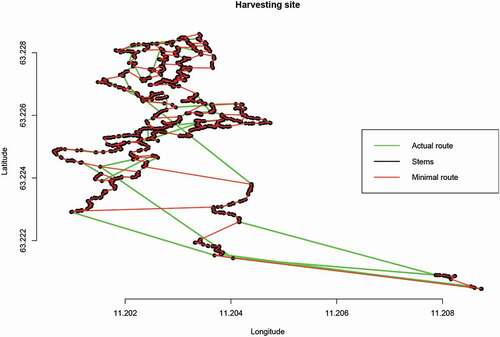
Figure 4. Histogram of actual/minimal travel distance (m)
Model specification
Several productivity functions for timber harvesters are available from the existing literature, but for this specific study, we want to highlight the machines’ ability to maximize the outputs represented in the given case by:
as the given set of inputs. Furthermore, we choose the environmental variables: . Note that we negate these environmental variables such that
satisfies the interpretation “
is an equal or worse operating condition than
”. Finally, we use the direction vectors:
for the inputs and
for the outputs. Thus, our DEA analysis seeks only for improvements in harvest time and travel distance on the DMU while keeping outputs constant and only comparing with operating on other DMUs in equal or worse conditions as measured by the given topography (site area, mean terrain ruggedness and mean slope).
Results
The analysis for measuring the performance of timber production in the area considered indicates that the average β is 0.11, the standard deviation (SD) is 0.17, the maximum β is 0.77 and the minimum is 0. shows the distribution of the inefficiency scores β for all observations. There are many efficient observations (409/643 ≈ 63.61%) and the inefficient ones could be largely improved by input reduction up to 77%, as similarly found in (Lebel and Stuart Citation1998). The distribution of the different input slacks indicates which of the inputs bear inefficiencies (). This gives an idea of the size of the improvements in efficiency that can be achieved by regulating the different inputs. Harvesting time for S2 shows a higher variation (or slack) compared to the other three inputs and this means that by reducing this input the operator would obviously gain higher efficiency. It is important to note that spruce (S2) accounts for approximately 85 of the harvested stems in the dataset (see ). Therefore, it can be expected that the potential improvement is higher for S2 than for the other species as the number of efficient peers are higher.
Figure 5. Histogram of inefficiency scores β.
Figure 6. Boxplot of slacks in inputs (βgx)
Our preliminary analysis in indicates the presence of considerable slack in the travel route of the harvesters. Hence, it is anticipated that the model might pick up this effect by means of higher inefficiency. shows β as a function of the ratio of the actual distance between the machines’ positions in which the felling took place (in this study called “travel distance”) over the computed minimal travel distance. In case of full efficiency, this ratio would be equal to one otherwise this would be higher than one. Although the variation in the data is large, the trend – as measured by a local linear kernel regression – indicates slack in the travel route translates into higher inefficiency. This suggests that slack in travel route has an effect on efficiency: the regression line shows that the inefficiency increases with higher distances.
Figure 7. Nonparametric regression of (actual/minimal) travel distance on inefficiency scores
shows OLS regression results of site characteristics and other variables on β.Footnote2 The other variables included in the analysis are listed in . The relative share of the different species is definitely unbalanced with S2 having a much higher value than S1 and S3, i.e. the stands were spruce dominated. Because of the difference in tree/crown shapes between broadleaves and spruce, manual override would most likely be more often necessary with S3 leading to an artificial increase in efficiency. Efficiency would also be artificially increased and because of the destination of the timber produced, i.e. less processing time would be used for non-marketable and pulpwood increasing the output per effective work hour as is further explained below with the species share. As the data must be set in context we believe our results being valid. The stem volume for the different tree species (SVS2, SVS3) and the share of tree species (SPPshareS1, SPPshareS2, SPPshareS3) are statistically significant and they have a negative effect on inefficiency. The larger the stem volume the higher the efficiency. An unexpected outcome are that a higher share of broadleaves in the species mix positively affected the efficiency. Despite its low share of stems and lower number of assortments, the correlation between efficiency and share of broadleaves may be a result of over measurement. In Norway, there is an undocumented experience that the broadleaves often lead to over measurement as the forking/branchiness compels the operator to open the head (also because it is not necessary to achieve a high debranching quality for this timber). This results in larger measurements, an incorrect assumption of larger tree volume, and therefore a false increase in efficiency. We note that it may be one of several reasons for this unexpected result. For S3, the average number of logs produced per day is also positively correlated with the efficiency. The results show that among the considered environmental conditions, inefficiency is positively affected by the SD of terrain ruggedness, i.e. with increasing variation in terrain ruggedness, inefficiency increases, and therefore efficiency decreases. Finally, actual/minimal travel distance (ADIST/MINDIST) has a statistically significant effect on inefficiency. An increasing gap in ADIST/MINDIST leads to increased inefficiency. This supports our earlier observation in .
Table 3. Regression results with site level variables in Z variables but not in regression
We would expect that inefficiency increased with the share of harvested broadleaves in the stand. We find the opposite that the share of S3 significantly decreases inefficiency. This result may be caused by uncertain and inflated volume estimates of S3 which can be associated with branchiness. However, we have no data to document this is the reason.
Finally, shows that the gap between actual and minimal travel distance decreases somewhat with tree density, as expected.
Figure 8. Nonparametric regression of tree density on (actual/minimal) travel distance (m)
Discussion
Levels of productivity in CTL timber harvesting operations are generally well established in many countries and settings. This study substantiated this knowledge by demonstrating how productivity is affected by stand characteristics and location-specific characteristics. Factors influencing productivity have conventionally been studied with regression analysis. Multiple regression outputs averages as it estimates a level for the dependent variable (whether it is input or output) given the level of the independent variables.
The models allow for random noise which reflects the inefficiency but it doesn’t separate the two components. Several assumptions about the inefficiency distribution of the error term have to be made, in order to disaggregate the inefficiency from the random noise, making this disaggregation somewhat unreliable. This might however be possible with “Stochastic Frontier Analysis” (Kumbhakar and Lovell Citation2003). In the current study, we applied Data Envelopment Analysis which is a frontier or boundary method and has the advantage of being able to identify the sources of inefficiencies by highlighting which resources are used in excess or which outputs are not produced in sufficient volumes. This is done for each inefficient DMU. Additionally, using a two-step analysis (second stage regression), this method, can also identify which of the variables significantly contributes to the inefficiency.
In our study, it was possible to assess how a range of stand characteristics, terrain characteristics, and operational characteristics would affect the technical efficiency of 643 harvesting operations in Norway. We found large variations in efficiency scores, and that the inefficient harvest operation could be theoretically improved by reducing input by up to 50%, which is comparable to results found in Lebel and Stuart (Citation1998). We applied a second stage regression estimation to identify which factors significantly affected inefficiency. In most cases we found that the inefficiency is credible and conforming to the conventional understanding of these effects, though their statistical significance was not always proven.
Inefficiency depends on a range of stand characteristics, e.g. stem size (Spinelli and Magagnotti Citation2013; Strandgard et al. Citation2013). The analysis confirmed that inefficiency decreases (i.e. efficiency increases) with both increasing volume of processed stems and stand density for pine and broadleaves within a DMU. For complicated trees to process, such as broadleaves it seems coherent that inefficiency increases with the mean number of logs produced per tree. Finally, it is also coherent that efficiency increases with an increasing share of non-marketable products timber and timber for the bioindustry as this is the share requiring less processing time. Our second stage regression results also conformed to the expectations. Literature reviews on harvesters’ productivity in relation to topographic parameters such as those considered in this paper are limited and have given mixed results. Aside from the production rate and the operating costs in relation to the sole stand characteristics as in (Eriksson and Lindroos Citation2014), not much research has been done in order to understand the influence of other parameters related to the operating environment.
The majority of the literature addresses the slope factor as in Akay et al. (Citation2004); Eriksson and Lindroos (Citation2014); Visser and Stampfer (Citation2015). Other publications consider the terrain bearing capacity and the impact over the stand Akay et al. (Citation2006) or location-specific factors such as slope of the terrain and terrain ruggedness (Stampfer and Steinmüller Citation2001; Alam et al. Citation2013; Eriksson and Lindroos Citation2014; Visser and Stampfer Citation2015) and trafficability.
We estimated the impact of the slope, terrain ruggedness index, and the isoperimetric quotient (an indicator of the shape of the stand). It was found that the terrain ruggedness and the site shape index, have a statistically significant effect on the efficiency. Inefficiency increases with increasing variation in ruggedness. Large variations in terrain likely reduce trafficability and demand more time and mental effort in maneuvering the machine. As only harvesting was considered in this work, the topographic variables considered did not have as great an effect on efficiency as they might have had if forwarder extraction had been included. A site shape that is convoluted (decreasing isoperimetric ratio) also increases the inefficiency as the operators have to move to a higher extent in order to reach all the points of the harvesting site. These results are in line with the significance of the ratio of actual travel distance to minimal travel distance in the first stage regression (ADIST/MINDIST), meaning that the more a machine deviates from the ideal minimum path the less efficient the operation will be, implicating the relevance of ruggeddness and site shape. In this study, it was found that increasing slope increased the efficiency, which contradicts conventional knowledge (Visser and Stampfer Citation2015). In this data-set the slope was considered as the SD of the slopes of all the polygons within each site and therefore a high SD means that the slope values are more spread around the mean while a low SD will mean the opposite. As the SD was calculated at 3.52% and the significance and the value of the β are so low it could actually be expected such a uncommon result as the slopes’ angle in this specific case study do not represent an hindrance for the machine mobility. Irrespective of that, slope typically affects forwarder extraction to a much greater degree than the harvester.
Human factors may also play an important role in determining the DMU’s technical efficiency. Significant differences have been noted between the productivity levels of operators. Ovaskainen et al. (Citation2004) compared six harvest operators working with the same harvester in similar stands. They found that the most efficient operators were the ones who avoided unnecessary boom movements in the felling phase. Murphy and Vanderberg (Citation2007) documented that the length of shifts and their configuration may have both positive and negative impacts on productivity and revenue. We did not consider the hours worked per day.
Other infrastructural variables, not included in the current study, such as the design and layout of the extraction trails may also impact productivity (Flisberg et al. Citation2007; Hosseini et al. Citation2018). The travel route of the harvester depends on a range of factors, including terrain slope, ruggedness, distance to landing, etc. To estimate the travel route, we applied an estimated ratio between actual distance and minimal distance as a proxy of optimal driving distance and potentially the usage of fuel. We found slack in the travel route translates into higher inefficiency suggesting that slack in travel route has an effect on efficiency. The regressions showed that the inefficiency increases with the higher disparity between actual and minimal distances. We would expect a range of factors could affect the operator’s decision on harvesting sequence, including local terrain conditions affecting access and maneuverability, visibility (i.e. avoiding looking into the sun), wind conditions, and in some cases, avoiding proximity to the forwarding operation. The individual operators may make different navigation choices, which have different outcomes on travel distances. However, although only for six operators, Ovaskainen et al. (Citation2004) found that with similar harvesters and harvesting conditions the average travel distance did not differ significantly. We acknowledge that the difference between actual and minimal distance may depend on terrain and stand characteristics in addition to other parameters linked to operating any machine such as refueling, maintenance repair, shift changes, etc.
We argue that the applications of DEA on harvest operations is limited. Therefore, the current study aims at contributing with an application of non-parametric methods to quantify the efficiency of harvesting operations and the inefficiency due to a range of harvest site characteristics. The results not only provide information on the inefficiency but also on possibilities for improvement. The contractor may apply DEA to systematically identify peers for comparison, or directional estimation of how much input should be reduced or output increased to become efficient. Furthermore, DEA also makes it possible to dis-aggregate efficiency into technical and scale efficiency and potentially to suggest mergers of harvest operations (Bogetoft et al. Citation2003).
Advances in the way that data is being collected and transmitted are facilitating larger-scale benchmarking analyses of forest harvesting operation efficiency Obi and Visser (Citation2017a, Citation2017b). In Norway alone, data from some 30 million trees are recorded in StanForD files each year, making the widespread analysis of such data worthwhile in contributing to an overall lift to the sector (Baardsen et al. Citation2009). Such automatic data collection may not only be useful for understanding the multi-dimensional aspects of efficiency. Real-time estimation of efficiency scores and feed-back of benchmarking reports to the operator may contribute to increased learning and behavioral change of operators which may increase overall performance (Astrup et al. Citation2018). Furthermore, the rapid development of sensors and control systems in other industries is beginning to gain influence in the field of forest operations, and the standardized production data used in this study may be supplemented with a range of qualitative information captured by on-board sensors in the medium term Talbot et al. (Citation2017). Suitable methods for analyzing this broader range of data types and sources will need to be assessed in conjunction with these developments Rossit et al. (Citation2019).
Conclusions
In our study, Norwegian forest sites were used as a background for assessing the technical efficiency of forest harvesting operations in relation to the site characteristics. Overall, this work has contributed to promote the relative merits of DEA (Data Envelopment Analysis) in the assessments of comparative efficiencies of decision-making units in comparison to parametric methods. The originality of this paper lies in the combination of the already developed method with an innovative application related to the environmental parameters linking those to the classic operational research and leaving room for further research in order to assess the change in performance under the influence of external factors.
An indirect and not anticipated outcome of this study, is the relative role that human factors can play in achieving higher efficiency. It can be argued that the decision-making process to harvest specific trees first or how to avoid a certain obstacle and the specific operators’ modus operandi can influence travel distance which has an economic and statistically significant effect on inefficiency. Increased attention to human factors especially in addressing training needs and improved work organization may, therefore, contribute to efficiency improvement. This is left for future studies.
Disclosure statement
No potential conflict of interest was reported by the authors.
Additional information
Funding
Notes
1. This problem is NP-complete and thus very hard to solve. No algorithm exists that guarantees an optimal solution: rather heuristics are used that can guarantee to come close to the optimal solution. In a small minority of cases (i.e. 5/643 0.8% observations), the computed path was worse than the actual path. For these cases, we set the optimal path to the actual path. We use the TSP package in R for the computation (Hahsler and Hornik Citation2007).
2. There was discussion in the literature that OLS yields biased results, because β is truncated at the lower end (Simar and Wilson Citation2007). Instead, the proposed solution was to use truncated regression. However, this has largely been rebuked by Banker and Natarajan (Citation2008), McDonald (Citation2009) and Johnson and Kuosmanen (Citation2012) who showed that OLS yields consistent results after all.
References
- Aalmo GO, Baardsen S. 2015. Environmental factors affecting technical efficiency in Norwegian steep terrain logging crews: a stochastic frontier analysis. J for Res. 20:18–23. doi:https://doi.org/10.1007/s10310-014-0466-x.
- Akay AE, Erdas O, Sessions J. 2004. Determining productivity of mechanized harvesting machines. J Appl Sci. 4:100–105. doi:https://doi.org/10.3923/jas.2004.100.105.
- Akay AE, Yilmaz M, Tonguc F. 2006. Impact of mechanized harvesting machines on forest ecosystem: residual stand damage. J Appl Sci. 6:2414–2419. doi:https://doi.org/10.3923/jas.2006.2414.2419.
- Alam M, Acuna M, Brown M. 2013. Self-levelling feller-buncher productivity based on Lidar-derived slope. Croatian J For Eng. 34:273–281.
- Arlinger J, Nordström M, Möller JJ. 2012. StanForD 2010: modern communication with forest machines. Arbetsrapport (Work report) 785. Uppsala: Skogforsk; p. 18.
- Astrup R, Strange N, Kerstens P-J, Bogetoft P, Dietz H-U, Aalmo G, Talbot B. 2018. The TECH4EFFECT efficiency portal: architecture, challenges, and preliminary outcomes of an ambitious bench-marking system. Proceedings of the 51st International Symposium of Forest Mechanization; Sep 24th–28th; Madrid.
- Baardsen S, Lien G, Størdal S. 2009. Profit efficiency in timber supply: marginalization and other relevant influences. For Sci. 55:524–532.
- Banker RD, Natarajan R. 2008. Evaluating contextual variables affecting productivity using data envelopment analysis. Oper Res. 56:48–58. doi:https://doi.org/10.1287/opre.1070.0460.
- Bergdahl A, Örtendahl A, Fjeld D. 2003. The economic potential for optimal destination of roundwood in North Sweden–effects of planning horizon and delivery precision. Int J For Eng. 14:81–88. doi:https://doi.org/10.1080/14942119.2003.10702472.
- Bogetoft P. 2012. Performance benchmarking. Boston (MA): Springer US.
- Bogetoft P, Thorsen BJ, Strange N. 2003. Efficiency and merger gains in the Danish forestry extension service. For Sci. 49:585–595.
- Brewer J, Talbot B, Belbo H, Ackerman P, Ackerman S. 2018. A comparison of two methods of data collection for modelling productivity of harvesters: manual time study and follow-up study using on-board-computer stem records. Ann For Res. 61:109–124.
- Chambers RG, Färe R, Grosskopf S. 1996. Productivity growth in APEC countries. Pac Econ Rev. 1:181–190. doi:https://doi.org/10.1111/j.1468-0106.1996.tb00184.x.
- Charnes A, Cooper WW, Rhodes E. 1978. Measuring the efficiency of decision making units. Eur J Oper Res. 2:429–444. doi:https://doi.org/10.1016/0377-2217(78)90138-8.
- Eriksson M, Lindroos O. 2014. Productivity of harvesters and forwarders in CTL operations in northern Sweden based on large follow-up datasets. Int J For Eng. 25:179–200. doi:https://doi.org/10.1080/14942119.2014.974309.
- Estelle SM, Johnson AL, Ruggiero J. 2010. Three-stage DEA models for incorporating exogenous inputs. Comput Oper Res. 37:1087–1090. doi:https://doi.org/10.1016/j.cor.2009.09.015.
- European Commission. 2013 A new EU forest strategy: for forests and the forest-based sector. Communication from the Commission to the European Parliament, the Council, the European Economic and Social Committee and the Committee of the Regions, Brussels.
- Färe R, Primont D. 1995. Multi-output production and duality: theory and applications. UK, Springer Science & Business Media.
- Farrell MJ. 1957. The measurement of productive efficiency. J R Stat Soc Ser A (General). 120(3):253–290. doi:https://doi.org/10.2307/2343100.
- Flisberg P, Forsberg M, Rönnqvist M. 2007. Optimization based planning tools for routing of forwarders at harvest areas. Can J For Res. 37:2153–2163. doi:https://doi.org/10.1139/X07-065.
- Hahsler M, Hornik K. 2007. TSP-infrastructure for the traveling salesperson problem. J Stat Softw. 23:1–21. doi:https://doi.org/10.18637/jss.v023.i02.
- Hiesl P, Benjamin JG. 2013. Applicability of international harvesting equipment productivity studies in Maine, USA: a literature review. Forests. 4:898–921. doi:https://doi.org/10.3390/f4040898.
- Hosseini A, Lindroos O, Wadbro E. 2018. A holistic optimization framework for forest machine trail network design accounting for multiple objectives and machines. Can J For Res. 49:111–120. doi:https://doi.org/10.1139/cjfr-2018-0258.
- Johnson AL, Kuosmanen T. 2012. One-stage and two-stage DEA estimation of the effects of contextual variables. Eur J Oper Res. 220:559–570. doi:https://doi.org/10.1016/j.ejor.2012.01.023.
- Jundén L, Bergström D, Servin M, Bergsten U. 2013. Simulation of boom-corridor thinning using a double-crane system and different levels of automation. Int J For Eng. 24:16–23. doi:https://doi.org/10.1080/14942119.2013.798131.
- Karlsson J, Rönnqvist M, Bergström J. 2004. An optimization model for annual harvest planning. Can J For Res. 34:1747–1754. doi:https://doi.org/10.1139/x04-043.
- Kumbhakar SC, Lovell CK. 2003. Stochastic frontier analysis. Germany: Cambridge university press.
- Labelle ER, Bergen M, Windisch J. 2017. The effect of quality bucking and automatic bucking on harvesting productivity and product recovery in a pine-dominated stand. Eur J For Res. 136:639–652. doi:https://doi.org/10.1007/s10342-017-1061-4.
- LebelL. 1996. Performance and efficiency evaluation of logging contractors using data envelopment analysis [PhD thesis]. Virginia Tech.
- LebelL, Stuart W. 1998. Technical efficiency evaluation of logging contractors using a nonparametric model. J for Eng. 9:15–24.
- LebelL, Triantis K, Stuart W. 1999. Evaluation of technical efficiency performance of logging contractors using data envelopment analysis and a stochastic approach. For Sci.
- Lindroos O, Ringdahl O, La Hera P, Hohnloser P, Hellström TH. 2015. Estimating the position of the harvester head–a key step towards the precision forestry of the future? Croatian J For Eng. 36:147–164.
- Machl T, Donaubauer A, Auernhammer H, Kolbe TH. 2013. Shape and ergonomics: methods for analyzing shape and geometric parameters of agricultural parcels. EFITA-WCCA-CIGR Conference “Sustainable Agriculture through ICT Innovation”,Torino, Italy.
- Manner J, Palmroth L, Nordfjell T, Lindroos O. 2016. Load level forwarding work element analysis based on automatic follow-up data. Silva Fennica. 50:19. doi:https://doi.org/10.14214/sf.1546.
- McDonald J. 2009. Using least squares and tobit in second stage DEA efficiency analyses. Eur J Oper Res. 197:792–798. doi:https://doi.org/10.1016/j.ejor.2008.07.039.
- Muñiz M, Paradi J, Ruggiero J, Yang Z. 2006. Evaluating alternative DEA models used to control for non-discretionary inputs. Comput Oper Res. 33:1173–1183. doi:https://doi.org/10.1016/j.cor.2004.09.007.
- Murphy G, Vanderberg M. 2007. Modelling the economics of extended shift and 4/7 forest harvesting. N Z J For. 52:15–17.
- Obi OF, Visser R. 2017a. Influence of the operating environment on the technical efficiency of forest harvesting operations. Int J For Eng. 28:140–147. doi:https://doi.org/10.1080/14942119.2017.1357391.
- Obi OF, Visser R. 2017b. Operational efficiency analysis of New Zealand timber harvesting contractors using data envelopment analysis. Int J for Eng. 28:85–93. doi:https://doi.org/10.1080/14942119.2017.1313489.
- Öhman K, Lämås T. 2003. Clustering of harvest activities in multiobjective long-term forest planning. For Ecol Manage. 176:161–171. doi:https://doi.org/10.1016/S0378-1127(02)00293-1.
- Olivera A, Visser R, Acuna M, Morgenroth J. 2016. Automatic GNSS-enabled harvester data collection as a tool to evaluate factors affecting harvester productivity in a Eucalyptus spp. harvesting operation in Uruguay. Int J for Eng. 27:15–28. doi:https://doi.org/10.1080/14942119.2015.1099775.
- Ortiz Morales D, Westerberg S, La Hera PX, Mettin U, Freidovich L, Shiriaev AS. 2014. Increasing the level of automation in the forestry logging process with crane trajectory planning and control. J Field Rob. 31:343–363. doi:https://doi.org/10.1002/rob.21496.
- Ovaskainen H, Uusitalo J, Väätäinen K. 2004. Characteristics and significance of a harvester operators’ working technique in thinnings. Int J For Eng. 15:67–77. doi:https://doi.org/10.1080/14942119.2004.10702498.
- Palander T, Nuutinen Y, Kariniemi A, Väätäinen K. 2013. Automatic time study method for recording work phase times of timber harvesting. For Sci. 59:472–483. doi:https://doi.org/10.5849/forsci.12-009.
- Piotrowski S, Carus M, Carrez D. 2016. European bioeconomy in figures. Ind Biotechnol. 12:78–82. doi:https://doi.org/10.1089/ind.2016.29030.spi.
- Plamondon J, Pitt DG. 2013. Effects of precommercial thinning on the forest value chain in northwestern New Brunswick: part 2–efficiency gains in cut-to-length harvesting. For Chron. 89:458–463. doi:https://doi.org/10.5558/tfc2013-087.
- QGIS. 2019. QGIS geographic information system. Open source geospatial foundation project. QGIS Development Team. http://qgis.osgeo.org.
- Räisänen T, Nurmi J. 2014. Impacts of bucking and delimbing alternatives on pulpwood and energy wood yields in young thinning stands in Finland. Scand J for Res. 29:243–251.
- Riley SJ, DeGloria S, Elliot R. 1999. Index that quantifies topographic heterogeneity. Intermountain J Sci. 5:23–27.
- Rockafellar R. 1970. Convex Analysis. USA,Princeton Univ. Press.
- Rossit DA, Olivera A, Céspedes VV, Broz D. 2019. A Big Data approach to forestry harvesting productivity. Comput Electron Agric. 161:29–52. doi:https://doi.org/10.1016/j.compag.2019.02.029.
- Ruggiero J. 1998. Non-discretionary inputs in data envelopment analysis. Eur J Oper Res. 111:461–469. doi:https://doi.org/10.1016/S0377-2217(97)00306-8.
- Shahi S, Pulkki R. 2015. A simulation-based optimization approach to integrated inventory management of a sawlog supply chain with demand uncertainty. Can J For Res. 45:1313–1326. doi:https://doi.org/10.1139/cjfr-2014-0373.
- Simar L, Wilson PW. 2007. Estimation and inference in two-stage, semi-parametric models of production processes. J Econom. 136:31–64. doi:https://doi.org/10.1016/j.jeconom.2005.07.009.
- Spinelli R, Magagnotti N. 2013. The effect of harvest tree distribution on harvesting productivity in selection cuts. Scand J for Res. 28:701–709. doi:https://doi.org/10.1080/02827581.2013.821517.
- Stampfer K, Steinmüller T. 2001. A new approach to derive a productivity model for the harvester Valmet 911 Snake. Proc., International mountain logging and 11th Pacific Northwest skyline symposium–a forest engineering odyssey. p. 254–262. Seattle, WA USA.
- Strandgard M, Walsh D, Acuna M. 2013. Estimating harvester productivity in Pinus radiata plantations using StanForD stem files. Scand J for Res. 28:73–80. doi:https://doi.org/10.1080/02827581.2012.706633.
- Talbot B, Pierzchała M, Astrup R. 2017. Applications of remote and proximal sensing for improved precision in forest operations. Croatian J For Eng. 38:327–336.
- Talbot B, Suadicani K. 2015. Quantifying the influence of geo-spatial forest distribution on machinery management. Baltic For. 21:340–348.
- Thanassoulis E. 1993. A comparison of regression analysis and data envelopment analysis as alternative methods for performance assessments. J Oper Res Soc. 44:1129–1144. doi:https://doi.org/10.1057/jors.1993.185.
- Visser R, Stampfer K. 2015. Expanding ground-based harvesting onto steep terrain: a review. Croatian J For Eng. 36:321–331.
- Walsh D, Strandgard M. 2014. Productivity and cost of harvesting a stemwood biomass product from integrated cut-to-length harvest operations in Australian Pinus radiata plantations. Biomass Bioenergy. 66:93–102. doi:https://doi.org/10.1016/j.biombioe.2014.01.017.
- Ziesak M, Strydom S. 2014. Linking of CAN-Bus machine data to forest operations. Stellenbosch, South Africa: 2014 Precision Forestry Symposium.