
 ?Mathematical formulae have been encoded as MathML and are displayed in this HTML version using MathJax in order to improve their display. Uncheck the box to turn MathJax off. This feature requires Javascript. Click on a formula to zoom.
ABSTRACT
Cable yarding is an inherently expensive extraction technology, but the mainstay for mountain forest management. Fuel cost represents a considerable share of total harvesting costs. Energy-recuperating, electrical slack-pulling carriages (EC), which recuperate energy during lateral yarding and store it as electrical energy in super-capacitors for powering slack-pulling during the subsequent yarding cycle have emerged only recently. Fuel consumption of cable yarding is expected to be lower when ECs are employed compared to working with conventional, diesel engine-powered slack-pulling drive (DC) carriages. To determine if reality matched expectations, a time and motion study was conductedduring which fuel consumption was extracted from the engine control systems using custom-made dataloggers for an uphill whole tree yarding operation in Austria. Average productivity was 21.9 m3 per productive system hour excluding delays (m3 PSH0−1) at 0.89 m3 average tree volume and 58.4 m average yarding distance. Productivity was modeled as a function of average tree volume, yarding distance and lateral yarding distance. Average fuel consumption was 1.27 ± 0.97 l m−3 (DC) and 0.88 ± 0.56 l m−3 (EC). In the DC treatment, the carriage engine accounted for 9% of the total fuel consumption. Modeling revealed that fuel consumption depended on average tree volume, yarding distance, lateral yarding distance and carriage type as originally postulated. The latter effect interacted with that of average tree volume and EC’s advantage in fuel consumption was limited by a break-even average tree volume. In conclusion, the EC has the potential to improve profit margins in small-tree operations through lower fuel consumption.
KEYWORDS:
Introduction
Mountain forests provide a wide variety of ecosystem services, which include protection against rockfall, avalanches and torrential flows, wildlife habitat, scenic beauty, high-quality drinking water, timber production and carbon sequestration (Dorren et al. Citation2004; Forest Europe Citation2015; BMLRT Citation2020). Forest management in steep terrain depends on cable yarding as the primary extraction technology, which is usually deployed on difficult sites. Since the complexity of a yarding system requires a large investment to achieve a lower production target, cable yarding is an inherently expensive technology (Spinelli et al. Citation2015). Its productivity depends on stem volume, yarding distance, lateral yarding distance, yarder type, bunching strategy, and learning curve of the crew (Heinimann et al. Citation2001) and interacts with the applied silvicultural treatment (Erber et al. Citation2017). Low productivity can lead to postponement of treatments urgently required from a silvicultural viewpoint to increase their financial sustainability. For example, about one third of the protection forests in Austria are in urgent need of tending and regeneration, but their active management has become increasingly unprofitable due to stagnating timber prices (BMLRT Citation2020).
As the environmental and economic conditions are not likely to change in the short term, increasing efficiency in steep terrain harvesting is crucial to ensure proper tending of mountain forests, so that they can continue providing their many benefits to human society. While increasing the level of mechanization would be the standard solution to cost containment in the face of increasing cost for fuel and labor and decreasing revenues, the further expansion of winch-assisted, fully mechanized technology (Holzfeind et al. Citation2020) is often hindered by the typical access constraints of mountain forests, namely: slope gradient and terrain roughness. Thus, cable yarding remains the mainstay for forest management in steep terrain (Spinelli and Magagnotti Citation2011).
Fuel cost constitutes an important component of total harvesting cost and, along with labor and capital cost, it ranks among the entrepreneur’s top concerns (Spinelli et al. Citation2017a, Harrill et al. Citation2019). The actual fuel consumption of harvesting machinery is difficult to obtain, as it is considered sensitive information and entrepreneurs are reluctant to share their figures. Consequently, there are few studies about the fuel consumption of cable yarding systems, and most are based on long-term records (e.g. Holzleitner et al. Citation2011, Kühmaier et al. Citation2019b), which are not best suited for designing effective fuel-saving strategies. In both the quoted studies, fuel consumption was extracted from the Austrian Federal Forest’s records. In particular, Holzleitner et al. (Citation2011) analyzed records from 28 tower yarders over the period 2004–2008 and established an average fuel consumption of 16.0 ± 4.2 l of diesel per PMH15 (productive machine hour including delays up to 15 min) or 0.06 ± 0.02 l per PMH15 and kW of engine power. However, both parameters varied considerably (5.3 to 24.8 l per PMH15; 0.02 to 0.11 l per PMH15 and kW of engine power). Kühmaier et al. (Citation2019b) analyzed data from 21 tower yarders for the period of 2016–2017 and reported a fuel consumption between 16.4 and 18.2 l per PHM15 or 1.7 to 1.8 l per m3. Proto et al. (Citation2017) report an average consumption of 19.3 l per h for a cable yarding operation in Italy.
Overall, fuel cost represents a significant proportion of the total harvesting cost, which is estimated to be as much as 20% of total system cost by Spinelli et al. (Citation2017b). Fuel supplies the energy required for operating the cable yarding system; therefore, energy recuperation technology would reduce total fuel consumption. In general, the term recuperation refers to processes by which kinetic or thermal energy can be recovered and stored in dedicated media, usually in converted form, such as electrical or hydraulic energy. Recuperation technology was introduced as early as 1900 in railway systems and later in automotive systems (Reif et al. Citation2012). Recently, this technology has also been introduced to cable yarding, both to the base machine (Kühmaier et al. Citation2019a) and to carriages, if the latter are motorized. In the case of carriages, energy can be recuperated during lateral yarding, carriage travel or unloading. In carriages, recuperated energy is used to power “slack-pulling” devices as well as other electrical functions of the carriage. A slack-pulling device is designed to actively pay out a line from the carriage (e.g. dropline, mainline or haulback line), thus sparing workers the taxing effort of pulling it out manually. Such a device may consist of a dedicated slack-pulling line installed in the yarder, or a power device in the carriage. For example, mechanical springs, motors or engines, are all used as a means to pull slack (Studier Citation1993).
As of June 2020, six cable yarding equipment manufacturers offer 13 different types of energy-recuperating carriages (Greifenberg Teleferiche Citation2020; Franz Hochleitner Citation2020; Koller Forsttechnik Citation2020; Konrad Forsttechnik GmbH Citation2020; MM Forsttechnik Citation2020; Schilter Citation2020). Most (11) of these machines recuperate energy during lateral yarding, while three of them do it during inhaul and one during unloading. The energy recuperated for slack-pulling is mainly stored as electrical energy in accumulators (5) or capacitors (6), while two carriages store it in hydraulic accumulators.
When energy is recuperated during lateral yarding and stored as electrical energy, the line to which the load is attached to is run over a sheave, which is connected to an electric motor that also acts as the generator. When the line is pulled in, this device generates electrical energy, which is then stored in accumulators and/or capacitors, and is later released in the reverse process to pay out the same line. Electrochemical double-layer capacitors (ECDLs) are a popular option for storing the recuperated energy; among them, “super-capacitors”, which employ an organic solvate that enables building high nominal voltages (Korthauer Citation2013). Compared to accumulators, super-capacitors offer many advantages, such as the larger number of charge and discharge cycles and the faster charging and discharging (Guetif Citation2006; Huggins Citation2009; Heuck et al. Citation2013; Korthauer Citation2013; Bergholz Citation2015). In the case of carriages that rely solely on accumulators for storing recuperated energy, the accumulators have to be recharged externally after one to two days of use, as they cannot be charged fast enough during the energy recuperation cycles. However, carriages that use ECDLs as the primary means for storing recuperated energy are also equipped with an additional accumulator to recharge the ECDLs to the minimum voltage required for operation in case of accidental discharge.
It is reasonable to expect a lower fuel consumption from a yarder equipped with an energy-recuperating carriage, rather than a standard motorized slack-pulling carriage powered by a combustion engine. Furthermore, replacing the heavy combustion engine and fuel tank with a lighter electrical engine/generator and ECDLs results in a lower carriage weight, and a proportional increase in payload, which may lead to higher productivity. Finally, electrical engines/generators and ECDLs are considered to be less maintenance-intensive and prone to damage than combustion engines.
Therefore, energy-recuperating carriages may present an option to improve cost-efficiency of a comparatively expensive extraction technology. However, these devices are fairly new and their effect on productivity and fuel consumption has not been verified yet.
Hence, a comparative study was carried out under the typical conditions of the forest in the Austrian Alps with the specific goals of: determining if 1) productivity (m3 PSH15−1) 2) fuel consumption (l m−3) and 3) operation costs (€ m−3) differed significantly when the same yarder setup was operated with two different slack-pulling carriages: a conventional one equipped with a diesel-engine and an innovative one equipped with an electrical motor/generator connected to an ECDL.
Materials and methods
Study site and machinery
The study was conducted in a mixed spruce-beech (Picea abies (L.) H. Karst and Fagus sylvatica L.) stand with single individuals of European larch (Larix decidua Mill.) and European ash (Fraxinus excelsior L.) located in the eastern Austrian Alps, near Krumbach (47°30ʹ12”N 16°11ʹ06”E). Average tree height and diameter at breast height (DBH) were 24.9 m and 28 cm, respectively. The stand grew on a north-facing slope, with a gradient between 55% and 65%. On the valley floor, a small river formed the stand’s border and on its opposite side the terrain rose again. Forest roads were located both on the southern border of the stand and on the opposite bank of the river on the valley floor.
A selective thinning treatment was conducted on a total harvesting area of about 3 ha. Trees were directionally felled with chainsaws and extracted uphill to the forest road, where they were delimbed and cut to length with a processor integrated into the yarder.
For yarding, a Konrad Forsttechnik GmbH MOUNTY 4000 truck-mounted (Mercedes Benz Arocs AK3342 6 × 6 truck) tower yarder was employed. This yarder featured a 13 m tower (fully extended) and a 600 m skyline capacity. It was equipped with three hydraulically powered winches for the skyline (22 mm), mainline (12 mm) and haulback line (11 mm), as well as additional drums for the strawline and guylines. The mainline and haulback winches were fitted with a hydraulic interlock and their maximum pulling force was 40 kN. All drums were powered by the truck’s engine through a hydraulic power take-off. The base machine was further equipped with a KFT MT24 crane with a reach of 9.1 m, on which a Konrad Forsttechnik GmbH WOODY 60 processor head was mounted. This head could be used both in a grapple and a processor function and was able to process trees up to a maximum diameter of 65 cm.
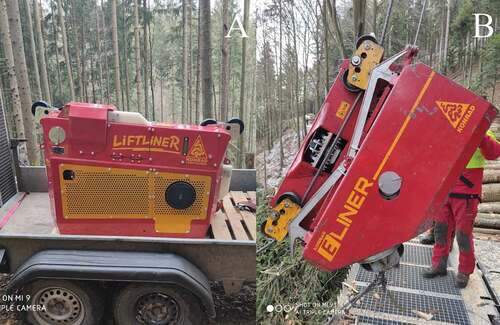
For the study, two different carriages were used, and namely: the LIFTLINER 4000 and ELINER 5000, both manufactured by Konrad Forsttechnik GmbH. The radio-controlled LIFTLINER 4000 carriage (henceforth: DC – diesel carriage; ) was powered by a 74 kW Volkswagen diesel engine, which drove a hydraulic winch with a maximum pulling force of 40 kN and a cable capacity of 85 m (12 mm steel cable). Fuel was supplied from a 24-liter tank and total carriage weight was 1,020 kg. The ELINER 5000 (henceforth: EC – electric carriage; ) did not have a separate dropline but used the yarder mainline to reach and lift the loads. This line is pulled through the carriage and down to the loads using an electrically driven slack-pulling device. The electric motor paid out cable through a sheave, and also served as a generator when the cable was pulled back in through the carriage, during lateral yarding. Electric energy was stored in two sets of super-capacitors and was returned to the electric motor when slack must be pulled again during the next cycle. A transmission ratio of 1:40 ensured full utilization of the generator’s 3 kW charging power even in the worst case of a very short lateral yarding distance followed by an extra-long one. Upon reaching the super-capacitor’s maximum charging voltage (60 V), the driving sheave engaging the mainline was automatically disconnected from the generator by means of a slipping clutch. The super-capacitors solely powered the electric engine, while all other electrical functions of the carriage were powered by an accumulator, which also served as a backup in case of accidental discharge of the super-capacitors. The electrical carriage used the same radio-control system as the diesel carriage, but it was considerably lighter, with a total weight of 690 kg.
Figure 1. Carriages employed in the study: LIFTLINER (a) and ELINER (b)
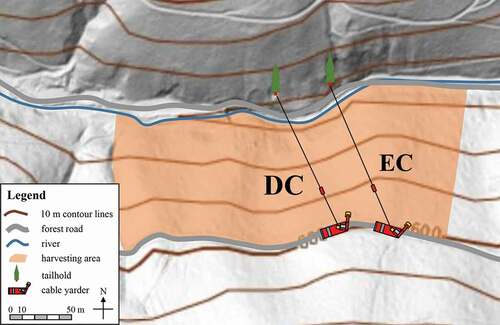
The cable yarding corridors () were four to five meters wide and aligned with slope orientation, and two fir trees with a DBH of 58 cm and 62 cm were selected as tailholds across a river on the opposite slope. Therefore, span lengths (157 m and 185 m) were considerably longer than actual corridor lengths (125 m and 132 m). The uphill position of the tailholds ensured sufficient clearance of the skylines (21 m to 22 m on average) and removed the need for intermediate supports. Rigging was a classic two-cable gravity-return configuration (i.e. sometimes referred to as “shotgun”), with a standing skyline and a mainline to pull the carriage and payload back uphill to the yarder. Each carriage was run on one of two parallel corridors, placed about 20 m apart and with similar average terrain slope (65% and 58%).
Figure 2. Overview of study area and layout
The yarding crew consisted of three members and included a yarder operator, a choker-setter and a chainsaw operator. Radio-controlled chokers allowed quick and easy operation at the unloading site. Both the yarder operator and the choker-setter had remote controls for managing the yarder; thus they could operate it independently when the carriage was in their own work zone. The remote controls were mutually exclusive, so that the yarder operator and the choker-setter did not risk interfering with each other when the carriage was outside their defined work zones. Crew members were between 32 and 34 years old and well experienced.
Study preparation
Before the study, the DBH of all trees in the harvesting area was measured with a caliper and an ID number was applied with spray paint on each tree. ID and DBH were recorded alongside tree species information. Furthermore, lateral yarding distance (the perpendicular distance from the tree to the middle of the corridor) and terrain slope on the corridor were measured with a Nikon Laser 550A-S rangefinder and recorded for each tree. Distances shorter than the rangefinder’s lower range limit (10 m) were established with a tape measure. In addition, the DBH and height of 55 trees were measured to derive a DBH-to-height curve and estimate the standing tree volume of all trees according to Pollanschütz (Citation1974). Finally, standing tree volume was converted to harvested tree volume by applying a 20% harvesting loss deduction (Kaltschmitt et al. Citation2009).
Time study and fuel consumption monitoring
The time study was conducted between January 28th and February 5th2020 under natural light conditions and was carried out manually with the time study software RC5 (version 1.0) run on a handheld computer (Algiz 7). Each yarding cycle was divided into the following seven main work elements: 1) Unloaded carriage trip (outhaul); 2) slack-pulling; 3) connecting the chokers to the load (hook); 4) breaking out the load, pulling it under the skyline and lifting the load under the carriage (lateral yarding); 5) travel loaded (inhaul); 6) unloading and 7) delays (recorded separately as mechanical, operational and personnel delays) (Magagnotti et al. Citation2013). Time consumption was recorded separately for each element and cycle along with the IDs of the trees yarded in the same cycle.
Yarding distance – the distance between the tower and the carriage at the loading point – was measured with a Nikon Laser 550A-S rangefinder by a researcher stationed at the tower. The IDs of all trees within a cycle were recorded during the time study and load volume was obtained by summing individual tree volumes from the records of their respective measurements; average tree volume was calculated by dividing load volume by the number of trees. If more than one tree was yarded per cycle, the lateral yarding distance of the tree farthest from the corridor was looked up in the records from study preparation and assigned to that cycle.
Fuel consumption of the base machine and the DC was retrieved from the base machine’s and the DC’s on-board engine control systems. Small, portable data loggers, custom-made by the yarder manufacturer Konrad Forsttechnik GmbH, were employed for this task. These devices recorded and stored all data provided by the engine control systems. Data could be retrieved via WLAN connection during the operation or afterward by connecting the data logger to a PC. Data logger clocks were synchronized via an integrated GPS unit. Recording intervals of fuel consumption data were 100 and 20 milliseconds for the base machine and the DC, respectively.
Data analysis and modeling
Firstly, data were checked for completeness, consistency and plausibility. Cycle time data were joined with load, yarding distance, lateral yarding distance, slope, number of trees per cycle and average tree volume data in a Microsoft Excel spreadsheet. The format in which fuel consumption data was provided by the engine control systems was not readable by standard data processing software and a multiple-step conversion approach, involving UltraEdit (IDM Computer Solutions, Inc., version 26.20) and Notepad (version 7.8.3) was necessary for data transformation. Firstly, from ASCII to hexadecimal and then to decimal encoding. Extracted fuel consumption data were double-checked by Konrad Forsttechnik GmbH by comparing a random sample of data logger figures with those provided by the dedicated factory software: this check confirmed that proper conversion had been achieved. Fuel consumption per cycle was then extracted by matching timestamps on the time study and on the fuel data logger records. All analyses were conducted with the statistical software R (R Core Team Citation2018).
Models for yarding efficiency and fuel consumption were formulated through the application of regression analysis. Correlation analysis and ANOVA were conducted to extract significant explanatory variables from the larger pool of potential independent variables. This pool included average tree volume (VOL), the number of trees per load (N), lateral yarding distance (LD), yarding distance (YD), terrain slope (SL) and carriage type (CARR). These variables were also tested for combined interaction effects.
Productivity (m3 per time unit) and efficiency (time per m3) were calculated based on net productive system time, excluding delays (PSH0). To account for delays up to 15 min (PSH15), a conversion factor of 1.3 was adopted (Stampfer et al. Citation2010). Fuel consumption per m3 was obtained by dividing fuel consumption per cycle by load volume (liters of diesel per m3 of yarded timber; l m−3).
Cost
Machine cost was estimated with the method developed by European COST Action FP0902 (Ackerman et al. Citation2014). Machine service life estimates as well as the cost of fuel, insurance, repair and service were obtained directly from the machine owners. Labor cost was set to 35 € per scheduled machine hour (SMH), inclusive of indirect salary costs. The calculated cost of all operations was increased by 25% to account for overhead costs (Hartsough Citation1993). Further detail on cost calculations is shown in . Readers must be aware that actual machine rates may differ from the calculated rates, based on local market conditions (Spinelli et al. Citation2015).
Table 1. Operation cost estimates for the base machine, both carriage options (DC = diesel carriage treatment, EC = electrical carriage treatment) and a crew of 3
Valid range of the models
The range of validity of any model depends on the circumstances under which the model was created. Therefore, the models developed in this study are best used under conditions similar to those encountered during the study itself, and within the explaining parameter’s limits, defined by their 5% and 95% quantiles. These limits are 0.21 to 2.35 m3 for average tree volume, 8.0 to 102.8 m for yarding distance and 3 to 30 m for lateral yarding distance.
Results
In total, the study covered 305 cycles (152 for the DC and 153 for the EC treatment), during which 442 m3 of timber (under bark) were extracted (222 m3 for the DC and 220 m3 for the EC treatment). Mean extraction distance was slightly, but significantly shorter (e.g. by 6.5 m or 14%) in the EC treatment (), while maximum yarding distances were comparable (117 m vs. 110 m). Mean lateral yarding distances did not differ between treatments and ranged from a minimum of 0 m (load right under the skyline) to a maximum of 39 m and 40 m for the DC and the EC treatment, respectively. While load volume was almost the same for the two treatments, loads consisted of about 0.3 more trees per load in the DC treatment. Accordingly, average tree volume was significantly higher (about 0.06 m3 more) in the EC treatment.
Table 2. Descriptive statistics of test conditions
Time consumption, efficiency and productivity
The total observation times (100%; excluding lunch breaks) were 770 min or 12.84 h for the DC treatment and 710 min or 11.83 h for the EC treatment. Delays shorter than 15 min accounted for 61 min or 1.01 h (7.9%; DC) and 52 min or 0.87 h (7.4%; EC), respectively. Hence, the total effective working times were 710 min and 658 min or 11.83 PSH0 and 10.96 PSH0 for the DC and the EC treatment, and represented 92.1% (DC) and 92.6% (EC) of the total observation times, respectively.
Lateral yarding was the most time-consuming work element in both cases (170 min or 24.0% (DC) and 127 min or 19.3% (EC) of the total effective working time), followed by unloading and lowering the dropline/mainline. Inhaul time accounted for 111 min or 15.6% and 113 min or 17.1% of the total effective working time in DC and EC, respectively. Slightly less time was consumed for hooking (110 min or 15.5% in DC; 96 min or 14.6% in EC) and the least time was consumed for outhaul of the carriages (63 min or 8.8% in DC and 88 min or 13.3% in EC). In essence, loading-related tasks (slack-pulling, hooking, lateral yarding) accounted for about half (56.6% and 52.0% in DC and EC, respectively) of the time consumption in both cases.
While no significant differences were observed for average inhaul time consumption (), significantly less time was consumed on average for the outhaul of the DC. The same trend was observed for the average inhaul and outhaul speed of the carriages. Significantly (p = <0.001) more time was consumed for loading-related tasks under the DC treatment (2.64 ± 0.93 min) compared with the EC treatment (2.23 ± 0.95 min). Within loading, hooking and lateral yarding took significantly more time under the DC treatment, while no difference was observed for slack-pulling. Furthermore, lateral yarding speed was about 0.13 m s−1 or 38.2% slower under the DC treatment.
Average time consumption per cycle was 4.67 ± 1.50 min (DC) and 4.30 ± 1.53 min (EC), which corresponded to an average efficiency of 4.52 ± 3.06 min PSH0 m−3 and 3.66 ± 2.30 min PSH0 m−3 and an average productivity of 21.4 ± 20.4 m3 PSH0−1 or 22.5 ± 14.2 m3 PSH0−1 for the DC and EC treatments, respectively (). Both efficiency and productivity were highly variable and significantly less time was consumed on average per cycle and per m3 under the EC treatment, compared with the DC treatment. Accordingly, productivity was significantly higher for the EC treatment.
Table 3. Descriptive statistics of time consumption elements, efficiency and productivity
ANOVA revealed that carriage type did not have a significant effect on efficiency. Therefore, a model estimating time consumption per m3 as a function of average tree volume, yarding distance and lateral yarding distance was developed (EquationEq. 1(1)
(1) ), which explained about 60.0% of the variation in efficiency. Time consumption per m3 decreased with increasing average tree volume and increased with the yarding distance and lateral yarding distance. Mean deviation from the observation was 2.8 × 10⁻¹⁵ ± 1.72 min PSH0 m−3, with median, minimum and maximum deviations of 0.19 min PSH0 m−3, −6.92 min PSH0 m−3 and 4.70 min PSH0 m−3. Model coefficients and detailed model statistics are displayed in .
Table 4. Model statistics, parameter estimates and summarized test statistics for the time consumption and fuel consumption models
where:
EffYard = efficiency of yarding, min PSH0 m−3
FuelTot = base machine and carriage fuel consumption, l m−3
VOL = average tree volume, m3
YD = yarding distance, m
LD = lateral yarding distance, m
The estimates for efficiency can be converted to productivity by EquationEq. 2(2)
(2) . To account for delays shorter than 15 min, a conversion factor of 1.3 (Stampfer et al. Citation2010) was introduced.
where:
ProdYard = productivity of yarding, m3 PSH15−1
EffYard = efficiency of yarding, min PSH0 m−3
k = delay factor, where k = 1.3
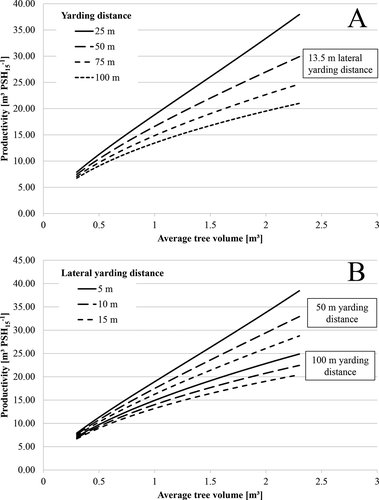
All other parameters equal, yarding productivity decreases considerably with increasing yarding distance. For a lateral yarding distance of 13.5 m, doubling the yarding distance from 50 to 100 m equals a decrease of productivity between 0.51 m3 PSH15−1 or 9.6% (0.3 m3 average tree volume) and 8.90 m3 PSH15−1 or 29.8% (2.3 m3 average tree volume) (). At a given yarding distance and average tree volume, the level of productivity is determined by lateral yarding distance. For example, at a yarding distance of 50 m and an average tree volume of 0.9 m3, an increase of lateral yarding distance from 5 to 15 m corresponds to a decrease in productivity of 2.32 m3 PSH15−1 or 13.3% ().
Figure 3. Yarding productivity as a function of average tree volume and yarding distance (a) and impact of lateral yarding distance on yarding productivity (b)
Fuel consumption
Total fuel consumption during the study was 198 l under the DC and 162 l under the EC treatment. Under the DC treatment, 180 l (91.0%) was consumed by the base machine and 18 l (9.0%) by the carriage, while the total equals the consumption of the base machine, in case of the EC treatment. Average fuel consumption was significantly higher under the DC treatment compared with the EC treatment, irrespective of the reference unit (per cycle, per hour and per m3; ). No such difference was observed between treatments for the base machine on an hourly level.
Table 5. Descriptive statistics of fuel consumption
The developed fuel consumption model (EquationEq. 3)(3)
(3) estimates the combined fuel consumption of the base machine and the carriage per m3 under both treatments. Respective coefficients and detailed model statistics can be found in . Total fuel consumption was modeled as a function of average tree volume, yarding distance, lateral yarding distance and treatment type. The larger the average tree volume, the less fuel was consumed per m3. Conversely, the longer the yarding distance and the lateral yarding distance, the more fuel was consumed. Furthermore, treatment type was found to interact with average tree volume, while no such interaction was observed between treatment type and yarding or lateral yarding distance. Mean deviation of the estimation from the observation was −0.06 ± 0.47 l m−3, with median, minimum and maximum deviations of 0.02 l m−3, −2.09 l m−3 and 1.14 l m−3. About 63.8% of the variation in combined fuel consumption per m3 was explained by the model.
where:
FuelTot = base machine and carriage fuel consumption, l m−3
VOL = average tree volume, m3
YD = yarding distance, m
LD = lateral yarding distance, m
CARR = carriage/treatment type, with DC = 0 and EC = 1
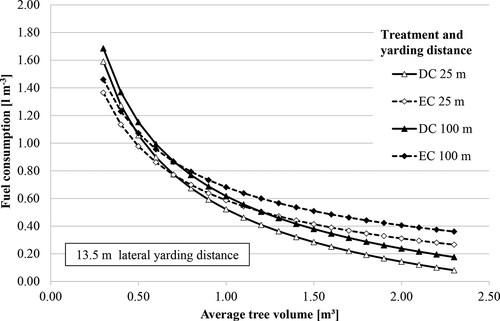
Comparison of treatments revealed that the EC treatment was advantageous when yarding was carried out over short distances and when average tree volume was low (). For example, at the average lateral yarding distance of 13.5 m and an average tree volume of 0.3 m3, the EC treatment consumed 0.22 l less fuel per m3 than the DC treatment, with an advantage of 14.1% and 12.0% at yarding distances of 25 m and 100 m, respectively. The break-even point in terms of average tree volume was found at around 0.7 m3; above this threshold, less fuel is consumed per m3 under the DC treatment. In a final felling scenario (1.9 m3 average tree volume), the DC (0.17 l m−3) would consume only almost half as much fuel per m3 as the EC (0.33 l m−3) at 25 m yarding distance. At 100 m yarding distance, the advantage drops to 46%. Lateral yarding distance has a considerable effect on fuel consumption: At a yarding distance of 50 m and an average tree volume of 0.9 m3, increasing lateral yarding distance from 5 to 10 m corresponded to increases of fuel consumption of 7.8% (EC) and 8.5% (DC).
Figure 4. Total fuel consumption for the DC and EC treatments depending on average tree volume in a short and a long yarding distance scenario
Cost
Under the conditions of the study, the hourly costs of operation were about 3 Euro or 1.2% less for the EC treatment due to the lower average fuel consumption. At a yarding distance of 50 m and a lateral yarding distance of 13.5 m, this corresponded to an advantage of the EC treatment of between 0.40 Euro m−3 and 0.11 Euro m−3 for average tree volumes of 0.3 to 2.3 m3. At a yarding distance of 100 m, the range was from 0.44 to 0.15 Euro m−3.
Discussion
Electrical, energy-recuperating slack-pulling carriages have been introduced into cable yarding only recently and are expected to decrease the fuel consumption and increase the productivity of cable yarding compared to standard motorized slack-pulling carriages because of their higher energy efficiency and lower tare weight, leading to higher payload capacity. To the authors’ knowledge, this study is the first to investigate how the productivity, fuel consumption and operation cost of a cable yarding system are affected by this novel type of carriage in comparison to a conventional motorized slack-pulling carriage equipped with a diesel engine. The study’s main result was that by working with an energy-recuperating, electrical slack-pulling carriage (EC), productivity did not differ significantly from working with a conventional, diesel engine-powered carriage, while less fuel was consumed in the EC treatment up to a certain average tree volume, above which the DC treatment became more fuel-efficient.
Investigation of fuel consumption yielded the most interesting results: Firstly, both the total fuel consumption per hour and per m3 of both treatments were well within the wide range reported in other studies (Holzleitner et al. Citation2011, Kühmaier et al. Citation2019b). Holzleitner et al.’s (Citation2011) model provided a considerable larger estimate (17.4 l PMH15−1) for base machine fuel consumption, which indicates progress in engine fuel efficiency and the need to update existing fuel consumption models. Contrarily, observation was in close agreement with the manufacturer’s experience with other machines of the same model (13 to 14 l per PMH15; conversation with Konrad M 2020; unreferenced). Secondly, the study highlighted the existence of a break-even balance between the two treatments that was unexpected and deserves some consideration. As indicated by the model’s interaction term, treatment effect is closely linked to the average tree volume in a decreasing trend, but how may not be straightforward to comprehend. In this respect, differences between the treatments regarding power requirements and power supply during lateral yarding have to be considered. In the DC treatment, lateral yarding is powered by the smaller diesel engine in the carriage and, in addition to the load, and the weight of a dropline stretch equivalent to about the lateral yarding distance has to be moved. Compared to inhaul of the carriage, the power requirements are likely to be lower for the DC base machine’s engine during lateral yarding, as the winching system does not need to be powered. Contrarily, the yarder’s winching system has to be powered during lateral yarding under the EC treatment. In addition to that, a longer stretch of cable – the equivalent of the lateral yarding distance plus the yarding distance – has to be moved. Thus, the power requirements during lateral yarding are likely to be higher for the base machine’s engine under the EC treatment than under the DC treatment. As long as average tree volume, and thus power requirement, is small, it appears that the combined fuel consumption of base machine and carriage per m3 under the DC treatment exceeds that of working with the EC. However, above the break-even point of average tree volume, power requirement increases to a level where the base machine’s engine in the EC treatment consumes more fuel per m3 than the two engines under the DC treatment in combination. In this respect, it must also be considered that the DC’s fuel consumption per PSH15 equals only a tenth of the base machine’s and that lateral yarding represented about a quarter of total time consumption under the DC treatment, thus opening up potential for fuel saving at the base machine’s engine. The EC’s disadvantage of having to move a larger load with respect to cable weight is not unique to the EC, but rather applies to all types of slack-pulling carriages where a line is pulled through the carriage, and may be compounded by the friction occurring when pulling the mainline over the sheave for driving the electrical generator. It may also add to the power requirement and it would be most logical that the importance of line weight and friction effects increase with yarding distance. However, it must be noted that the explanation provided above, though derived through intensive discussion with the machine manufacturer, is of mostly speculative nature and clarification of this issue certainly requires deeper investigation of the interrelations between work element, respective power requirement, engine RPM and fuel consumption.
Nevertheless, the EC demonstrated a clear advantage regarding fuel consumption when average tree volumes were small. The latter is typical of thinning operations, which are characterized by particularly low profit margins. For average tree volumes of 0.3 to 0.6 m3, a lateral yarding distance of 13.5 m and average yarding distances of 25 to 100 m, the advantage would be 0.04 to 0.22 l m−3. At a fuel price of 1.00 Euro per l diesel, this corresponds to savings of 400 to 2.200 Euros per 10,000 m3 of yarded logs.
Not surprisingly, the efficiency of yarding could be explained by average tree volume, yarding distance and lateral yarding distance, which are some of the most common explanatory variables used in cable yarding efficiency studies (Lindroos and Cavalli Citation2016). Modeling revealed no significant difference in efficiency between the treatment types and the observed difference therefore might be explained by the slightly shorter average yarding distance and a little larger average tree volume in the EC treatment.
While the DC’s higher weight is most likely responsible for its faster outhaul, the EC’s advantage of 330 kg was expected to equal a higher maximum payload. The effect was considered to be visible in the load sizes, but a comparison of average load volumes did not support this assumption. However, load volume might be less suitable than load weight to indicate this difference and procedures should have followed Spinelli et al.’s (Citation2017b) example, were load sizes had been established by scaling yarded logs individually, sampling green density and converting volume to weight, as well as accounting for branch and foliage weight. Since the yarding crew had plenty of experience with the EC, it is unlikely that they did not make use of its higher payload capacity wherever possible. However, besides payload capacity, load size can be further constrained by the number of trees available in close proximity to the loading point, by their volume or by the limited number of available chokers. Nevertheless, at the same payload, a lighter carriage weight offers the benefit of decreased skyline load and anchor strain (Spinelli et al. Citation2017b), which is beneficial in terms of worker safety.
The anticipated advantage of the DC in slack-pulling time consumption due to its ability to pay out the dropline before arriving at the loading point, which is not possible with the EC, did not materialize and slack-pulling time consumption was found to be solely dependent on lateral yarding distance.
Delay share was considerably low compared to other studies (e.g. Stampfer et al. Citation2010) and it seems that the study struck a particularly “lucky” week with regard to delay appearance. Therefore, the introduction of a conversion factor appears to be justified to ensure that delays are taken into account at a realistic level.
While the study covered a wide range of conditions with regard to lateral yarding distance and average tree volume, yarding distance was comparatively short. This can be considered the study’s main limitation and future studies may focus on longer distances. Further, though separate models for base machines and the DC carriage could be derived from the available data, presentation of results was restricted to total fuel consumption level to allow statistical comparison of treatments and to comply with the journal’s scope limits. However, future studies should aim to investigate the observed effects on a more detailed level. To this end, they will have to consider that the base machine’s engine powers not only the winches, but also the crane and processor head through the same oil circuit and thus the winches’ share in fuel consumption of the base machine is obscured by their consumption. While it can be assumed that crane and processor work occurs regularly, their power requirement is likely to interact with the processed tree’s dimension. This issue is compounded by the fact that the fuel consumption of crane and processor work is related to trees yarded during the previous cycle, while fuel consumption is accounted for in the current cycle. To distinguish between processing and yarding work consumption, future studies will have to scrutinize data provided by base machine’s engine and oil circuit control systems or use operations where the yarder and the processor are separate and not integrated into the same machine. In addition to engine-related parameters and separation of yarding from processor work consumption, future fuel consumption models for cable yarding systems will have to integrate yarding direction effects.
Conclusions
The current study showed that energy-recuperating, electrical slack-pulling carriages have the potential to improve profit margins in cable yarding at sites characterized by low average tree volume through a lower fuel consumption per yarded m3 of timber, while maintaining similar levels of productivity compared to carriages equipped with a diesel engine. Being one of the first investigations of this novel type of carriage, many questions remain with regard to fuel consumption over longer yarding distances and to the breakdown of fuel consumption into yarding and processing work; these should be addressed in future studies. However, this study has clearly shown that contemporary sensor and data logger technology allows cost-effective, simple and convenient collection of a wide range of machine data in cable yarding, and hence the provision of the data required for digitalization of timber harvesting.
Acknowledgements
The authors thank Mrs. Giuliana Caliandrob and Mr. Markus Vorraber for their assistance with data collection. Special thanks to Forstunternehmen Hirtler for access to their operation and full support of the study and to Konrad Forsttechnik GmbH for supporting the study by providing the LIFTLINER carriage and engine data monitoring equipment.
Disclosure statement
No conflicts of interest to be declared.
Additional information
Funding
References
- Ackerman P, Belbo H, Eliasson L, De Jong A, Lazdins A, Lyons J. 2014. The COST model for calculation of forest operations costs. Int J For Eng. 25:75–81.
- Bergholz T. 2015. Lithiumbatterien für stationäre und mobile Anwendungen: benchmarking und experimentelle Umsetzung [Lithium batteries for stationary and mobile applications: benchmarking and experimental implementation]. Jülich (Germany): Forschungszentrum Jülich GmbH; p. 387.
- BMLRT – Bundesministerium für Landwirtschaft, Regionen und Tourismus. 2020. Warum ein Aktionsprogramm? [Why an action programme?]. Vienna: Federal Ministry Republic of Austria – Agriculture, Regions and Tourism. [accessed 2020 Jul 14]. https://www.schutzwald.at/aktionsprogramm/warum_aktionsprogramm.html.
- Dorren L, Berger F, Imeson A, Maier B, Rey F. 2004. Integrity, stability and management of protection forests in the European Alps. For Ecol Manag. 195(1–2):165–176. doi:https://doi.org/10.1016/j.foreco.2004.02.057.
- Erber G, Haberl A, Pentek T, Stampfer K. 2017. Impact of operational parameters on the productivity of whole tree cable yarding – a statistical analysis based on operation data. Aut J For Sci. 134:1–18.
- Forest Europe. 2015. State of Europe’s forests 2015. Ministerial Conference on the Protection of Forests in Europe; Spain: FOREST EUROPE Liaison Unit Madrid; 314 p.
- Franz Hochleitner. 2020. Produkte [Products]. Franz Hochleitner Bodman (Germany); [accessed 2020 Jul 14]. https://www.franzhochleitner.com/produkte.html.
- Greifenberg Teleferiche. 2020. Carriage HT 30. Greifenberg Teleferiche SAS. Terzolas (Italy); [accessed 2020 Jul 14]. https://www.greifenberg.it/carrellipescanti/prodotto.html?mod=ht30&lin=0.
- Guetif A. 2006. Klassifizierung von Batterien und Super-Kondensatoren als Energiespeicher [Classification of batteries and super-capacitors for energy storage]. Germany: Technical University of Braunschweig. Annual Report of the Institute for Electrical Machines, Drives and Trains; p. 56–65.
- Harrill H, Visser R, Raymond K. 2019. New Zealand cable logging 2008–2018: a period of change. Curr For Rep. 5(3):114–123. doi:https://doi.org/10.1007/s40725-019-00092-5.
- Hartsough B. 1993. Benefits of remote tension monitoring. Rotorua (New Zealand): Logging Industry Research Organization. LIRO Report 18-23; 13 p.
- Heinimann HR, Stampfer K, Loschek J, Caminada L. 2001. Perspectives on Central European cable yarding systems. Proceedings of the International Mountain Logging and 11th Pacific Northwest Skyline Symposium – A Forest Engineering Odyssey; Dec 10–12; Seattle, WA; Edited by: Schiess and Krogstad; p. 268–279.
- Heuck K, Dettmann K-D, Schulz D. 2013. Elektrische Energieversorgung [Electrical power supply]. Hamburg (Germany): Springer Vieweg; p. 753.
- Holzfeind T, Visser R, Chung W, Holzleitner F, Erber G. 2020. Development and benefits of Winch-Assist harvesting. Curr For Rep. 6(3):201-209.
- Holzleitner F, Stampfer K, Visser R. 2011. Utilization rates and cost factors in timber harvesting based on long-term machine data. Croat J For Eng. 32:501–508.
- Huggins RA. 2009. Advanced batteries, materials science aspects. Heidelberg (Germany): Springer; p. 474.
- Kaltschmitt M, Hartmann H, Hofbauer H. 2009. Energie aus Biomasse: Grundlagen,Techniken und Verfahren [Energy from biomass: basics,techniques and procedures]. Berlin (Germany): Springer; p. 1030.
- Koller Forsttechnik. 2020. Elektroauspuler [Electrial slack-pulling carriages]. Schwoich bei Kufstein (Austria): Koller GmbH; [accessed 2020 Jul 14]. https://www.kollergmbh.com/de/laufwagen/elektroausspuler.
- Konrad Forsttechnik. 2020. E-Liner 3000 and E-Liner 5000. Oberpreitenegg (Austria): Konrad Forsttechnik GmbH. Technical documentation system.
- Korthauer R. 2013. Handbuch Lithium-Ionen Batterie [Handbook for lithium-ion batteries]. Berlin-Heidelberg (Germany): Springer Vieweg; p. 320.
- Kühmaier M, Harrill H, Ghaffariyan MR, Hofer M, Stampfer K, Brown M, Visser R. 2019a. Using conjoint analyses to improve cable yarder design characteristics: an Austrian yarder case study to advance cost-effective extraction. Forests. 10(2):165. doi:https://doi.org/10.3390/f10020165.
- Kühmaier M, Kanzian C, Kral I, Gruber P, Eckert D, Huber C. 2019b. Ökobilanzierung der Holzbereitstellung bis zum Werk unter Einbeziehung neuer Technologien –Endbericht [Life cycle assessment of wood supply to the plant under consideration of emerging technologies - final report]. Vienna (Austria): University of Natural Resources and Life Sciences; p. 136.
- Lindroos O, Cavalli R. 2016. Cable yarding productivity models: a systematic review over the period 2000–2011. International Journal of Forest Engineering 27: 79–94 doi:https://doi.org/10.1080/14942119.2016.1198633
- Magagnotti N, Kanzian C, Schulmeyer F, Spinelli R. 2013. A new guide for work studies in forestry. Int J For Eng. 24:249–253.
- MM Forsttechnik. 2020. Carriage MM Sherpa UE. Frohnleiten (Austria): MM Forsttechnik GmbH; [accessed 2020 Jul 14]. http://www.mm-forsttechnik.at/_files/MM-SHERPA_UE_2.pdf.
- Pollanschütz J. 1974. Zuwachsschätzung im Rahmen von Stichprobeninventuren der Forsteinrichtung [Estimation of increment in the course of forest inventories]. Vol. 105. Vienna (Austria): Mitteilungen der forstlichen Bundesversuchsanstalt; p. 82–98.
- Proto AR, Bacenetti J, Macri G, Fiala M, Zimbalatti G. 2017. Mechanisation of different logging operations: environmental impact assessment using life cycle assessment (lca) approach. Chem Eng Trans. 58:229–234.
- R Core Team. 2018. R: A language and environment for statistical computing. Vienna: R Foundation for Statistical Computing. [accessed 2020 Jun 03]. https://www.R-project.org/.
- Reif K, Noreikat KE, Borgeest K. 2012. Kraftfahrzeug – hybridantriebe [Automotive hybrid drives]. Wiesbaden (Germany): Springer Vieweg; p. 354.
- Schilter. 2020. Elektroausspuler [Electrial slack-pulling carriage]. Erstfeld (Switzerland): Schilter Seilbahnen und Metallbau GmbH; [accessed 2020 Jul 14]. https://www.schilter-seilbahnen.ch/home/maschinenbau-und-forst/elektro-ausspuler/.
- Spinelli R, Magagnotti N. 2011. The effects of introducing modern technology on the financial, labour and energy performance of forest operations in the Italian Alps. For Pol Econ. 13(7):520–524. doi:https://doi.org/10.1016/j.forpol.2011.06.009.
- Spinelli R, Magagnotti N, Jessup E, Soucy M. 2017a. Perspectives and challenges of logging enterprises in the Italian Alps. For Pol Econ. 80:44–51. doi:https://doi.org/10.1016/j.forpol.2017.03.006.
- Spinelli R, Marchi E, Visser R, Harrill H, Gallo R, Cambi M, Neri F, Lombardini C, Magagnotti N. 2017b. The effect of carriage type on yarding productivity and cost. Int J For Eng. 28:34–41.
- Spinelli R, Visser R, Thees O, Sauter H, Krajnc N, Riond C, Magagnotti N. 2015. Cable logging contract rates in the Alps: the effect of regional variability and technical constraints. Croat J For Eng. 36:195–203.
- Stampfer K, Leitner T, Visser R. 2010. Efficiency and ergonomic benefits of using radio controlled chokers in cable yarding. Croat J For Eng. 31:1–9.
- Studier D. 1993. Carriages for skylines. Corvallis (USA): Oregon State University, Forest Research Laboratory. Research Contribution 3; p. 21.