
 ?Mathematical formulae have been encoded as MathML and are displayed in this HTML version using MathJax in order to improve their display. Uncheck the box to turn MathJax off. This feature requires Javascript. Click on a formula to zoom.
ABSTRACT
The preservation of the functionality of forest soil is a key aspect in planning mechanized harvesting operations. Therefore, knowledge and information about stand and soil characteristics are vital to the planning process. In this respect, depth-to-water (DTW) maps were reviewed with regard to their potential use as a prediction tool for wheel ruts. To test the applicability of open source DTW maps for prediction of rutting, the ground surface conditions of 20 clear-cut sites were recorded post harvesting, using an unmanned aerial vehicle (UAV). In total, 80 km of machine tracks were categorized by the severity of occurring rut-formations to investigate whether: i) operators intuitively avoid areas with low DTW values, ii) a correlation exists between decreasing DTW values and increasing rut severity, and iii) DTW maps can serve as reliable decision-making tool in minimizing the environmental effects of big machinery deployment. While the machine operators did not have access to these predictions (DTW maps) during the operations, there was no visual evidence that driving through these areas was actively avoided, resulting in a higher density of severe rutting within areas with DTW values <1 m. A logistic regression analysis confirmed that the probability of severe rutting rapidly increases with decreasing DTW values. However, significant differences between sites exist which might be attributed to a series of other factors such as soil type, weather conditions, number of passes and load capacity. Monitoring these factors is hence highly recommended in any further follow-up studies on soil trafficability.
Introduction
A stable and fertile soil system plays a major role as a basis on which a forest can grow, rejuvenate, and sustain, while providing numerous ecological and economic benefits to its surrounding (Ponge et al. Citation1998; Lavelle et al. Citation2006). The preservation of the functionality of forest soils should therefore always be considered as vital for forest management but might sometimes be in conflict with short-term economic interests (Ballard Citation2000; Akselsson et al. Citation2007).
Due to technical innovations and ongoing mechanization progress a growing share of harvesting operations is carried out with the fully mechanized cut-to-length (CTL) system consisting of a harvester followed by a forwarder (Michelsen et al. Citation2008). While the ground pressure of a harvester is lower and might not have a strong influence on soil structure, fully loaded forwarders can exceed the critical limit of the soil bearing capacity, resulting in compaction or rutting and potentially causing irreversible damage to the forest soil (Suvinen et al. Citation2009; Ampoorter et al. Citation2010; Labelle and Jaeger Citation2011; Schweier et al. Citation2019).
Heavy machine traffic on forest soils can cause various negative effects, however the most noticeable are wheel rut formations (Nugent et al. Citation2003; Labelle and Jaeger Citation2011; Uusitalo et al. Citation2015; Toivio et al. Citation2017). Wheel ruts can be defined as a vertical and horizontal soil displacement resulting in an indented, compressed, and compacted middle part and displaced soil upwelling on one or both sides of the wheel track. The occurrence of severe rutting is conditioned by several influencing factors including machine weight, wheel and tire specifications (number and dimensions), steepness of the terrain, soil moisture content, and basic soil characteristics such as particle size distribution (Eliasson Citation2005; Sakai et al. Citation2008; Uusitalo et al. Citation2015). Severe rutting can ultimately result in impeded water drainage, advanced erosion, or poor preconditions for regrowth (Ampoorter et al. Citation2010; Labelle and Jaeger Citation2011; Cambi et al. Citation2015).
For forest soil trafficability, soil moisture content is a key factor influencing physical characteristics like soil plasticity and soil bearing capacity (Uusitalo et al. Citation2019). Therefore, heavy machinery should predominantly be deployed on either dry or frozen soils in order to avoid severe rutting. However, forest soil moisture varies with soil texture and position in the micro-topographic landscape (Murphy et al. Citation2009). Utilizing spatial data for predicting site conditions, e.g. soil moisture content, hence becomes increasingly important within the planning phase of mechanized harvesting operations (Salmivaara et al. Citation2020). Depth-to-water (DTW) maps can be generated in reflecting some of this variability. The DTW maps represent models based on geospatial information, predicting the distance from the soil surface to the ground water table, typically visualized for the first meter only (White et al. Citation2012). The DTW maps can thereby cover large areas and might deliver important information in aiding the machine operator to avoid potentially wet areas within a harvesting cut and hence reducing severe rutting in the field. However, Mohtashami et al. (Citation2017) noted that the cartographic DTW index alone did not accurately predict the occurrence of rut formations within their study conducted in Sweden and suggested it would require further information such as soil type to provide reliable predictions on soil damage. Kankare et al. (Citation2019) supplemented soil moisture data with information on vegetation and ditch depths in their assessment of the feasibility of a forest trafficability map. Jones and Arp (Citation2019) used DTW predictions as one of the multiple input parameters in developing a soil trafficability model.
To test the potential applicability of DTW information in harvesting operations, 20 clear-cut harvesting sites were investigated with regards to the occurrence and severity of rut formations after clear-cut harvesting in southern Norway. For the 20 investigated test sites the DTW information was not previously known to the operators to ensure routine driving behavior within the harvesting cut and to provide general evidence as to whether the knowledge of DTW information could potentially have prevented severe rut formations. The recording of the harvesting site conditions was carried out by applying airborne data sampling using unmanned aerial vehicles (UAV). Photogrammetry and especially UAV-based photogrammetry has been proven as a cost and time effective method of recording large areas and rut formations in high detail (Haas et al. Citation2016; Pierzchała et al. Citation2016; Nevalainen et al. Citation2017; Marra et al. Citation2021). In the current study, the ortho-mosaics derived from the UAV imagery were used to evaluate and classify all harvesting tracks into the categories light, moderate, and severe. These trail maps were then evaluated against the corresponding DTW information to answer three main research questions about the future planning potential:
To assess whether potentially wet areas (calculated DTW value <1 m) are naturally avoided by operators and therefore the density (m/ha) of tracks is lower within this zone.
To investigate whether the severity of rut patterns increases within areas with a shallow DTW value <1 m.
To evaluate if DTW maps provide robust information for future planning processes of fully mechanized harvesting operations.
Materials and methods
Description of test sites
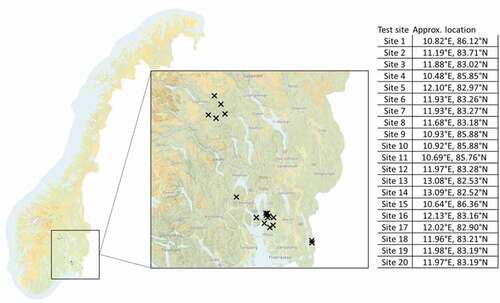
A total of 20 clear-cut harvesting sites in southern Norway were analyzed (). Site size ranged from 0.5 to 21.5 ha, with a mean of 5 ha (). The terrain ruggedness index (TRI) on the sites varied from 0.21 to 0.58 with an average of 0.38, implying that they were generally distributed over even terrain. The TRI is a quantitative measurement of the terrain heterogeneity, summarizing the change in elevation between a center cell and the eight neighboring cells within the digital terrain model (DTM) of the investigated test site (Riley et al. Citation1999). In all cases, a DTM derived from aerial laser scanning (ALS), with a horizontal resolution (XY plane) of 1 m was used. Furthermore, the inclination of the investigated terrain varied from 7% to 22% with an average of 14% ().
Table 1. Descriptive statistics of area and identified machine track extents
Figure 1. Location of the test sites in southern Norway.
In total, 105.3 hectares of harvested Norway spruce (Picea abies L. Karst) dominated forest were investigated, representing 83.4 km of machine tracks, resulting in an average of 1657.1 m/ha single wheel tracks on the investigated 20 stands.
Field recording, sampling, and processing of UAV imagery
To record the ground conditions on the clear-cut harvesting sites, a DJI Phantom 4 Pro UAV was used (DJI Citation2020). The DJI Phantom 4 Pro drone is a consumer-grade quadcopter, intentionally produced for the consumer market, but meets or exceeds the specifications needed in providing sufficiently high-resolution survey quality images covering areas the size of the harvested sites sampled in this study ().
Table 2. Specification of the utilized drone and camera system (DJI Citation2020)
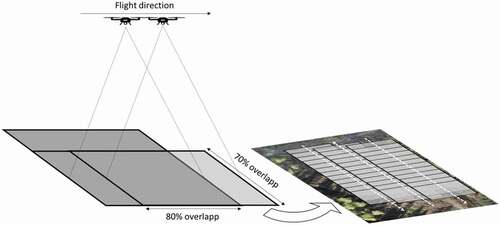
In-field image capturing was performed along predefined flight paths planned using DJI’s Ground Station Pro software (DJI Citation2021) in most cases, although UgCS software was used on stands located in challenging or mountainous terrain (UgCS Citation2021). The advantage of UgCS software being that it can use DTM input in planning flights that follow undulating or mountainous terrain. A flight altitude of approximately 50 m above the ground was targeted, providing a ground sampling distance (GSD) of 1–2 cm. To be able to create 3D surface models and high resolution ortho-mosaics of the harvesting site in the ensuing image processing step, a forward overlap of 80% and a lateral overlap of 70% was used in the flight plan (). This overlap ensures that enough features are identifiable in sequential images to pair and generate depth models of adequate quality.
Figure 2. Schematic representation of the UAV flight setup with 80% front and 70% side overlap for an ortho-mosaic creation.
Agisoft Metashape, which is a software solution specially designed to perform photogrammetric processes using digital images and generate 3D and photogrammetric datasets, was used (Agisoft Metashape Citation2019). The captured images were uploaded, registered, aligned, and georeferenced in generating structure-from-motion (Iglhaut et al. Citation2019). The 3D point cloud generated from this process was further processed into a digital surface model (DSM) and a high-resolution ortho-mosaic. The highest common resolution on each site was used in generating the ortho-mosaics and DSMs, which were typically the same as the GSD, 0.5–1.5 cm.
Rut detection and severity-categorization
In order to assess the location, density, and severity of wheel ruts, the created ortho-mosaics were imported into QGIS (v3.10.0). QGIS is an open-source GIS software, developed to manipulate, view, edit, and analyze geospatial data (QGIS Development Team Citation2020). Within this software platform, the wheel ruts were identified and visually classified. Due to the clear-cut character of the harvesting operation the visibility of the tracks was obvious throughout the sites. Previous studies proved the applicability of photo-optical recording measures to identify wheel ruts on clear cuts and were used as the basis for this research (Pierzchała et al. Citation2016; Talbot et al. Citation2018). The tracks were traced as polylines and visually classified into three categories: light, moderate, and severe (). The light category was defined as visible tracks with no identifiable soil displacement or rut-formation. Tracks that showed rutting with minor soil displacement and deeper incisions, but no loss of water drainage functions were classified as moderate. As severe ruts, all tracks were classified that showed either major soil displacement, very deep incisions, loss of water drainage functions, or a combination of these factors. In cases where the degree of severity was unclear, the QGIS profile tool was used on the DEM, providing a high-resolution transverse profile of the rut. For better visibility, the categories were further displayed with a corresponding color code of green (light), yellow (moderate), and red (severe) ().
Figure 3. Examples and description of the three rut severity classes.
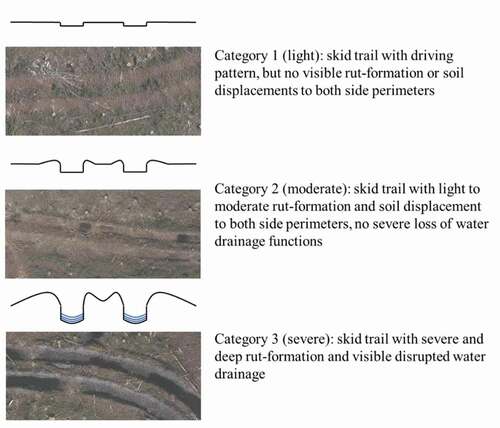
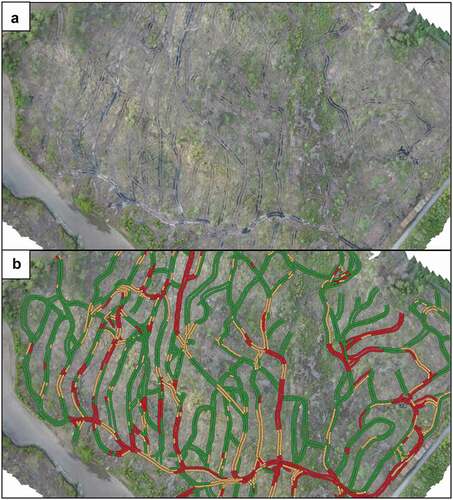
Figure 4. Ortho-mosaic of the recorded harvesting site Nr 16. (a) Basic ortho-mosaic presenting the unmarked tracks, (b) ortho-mosaic with marked and categorized tracks (green = light rut; yellow = moderate rut; red = severe rut) with 0.25 m point spacing.
After the categorization into severity classes, the traced tracks were converted into point features (sampling point) with a 0.25 m spacing between successive points for further processing. A spacing of 0.25 m was chosen as a compromise between achieving sufficient resolution while not oversampling.
As rutting appears to be more severe in curves or areas of machines turning (Liu et al. Citation2009; Edlund et al. Citation2012; Gelin and Björheden Citation2020) and samples taken here might confound the results, it was necessary to be able to isolate these points in the dataset. In doing that, every sample point (spacing 0.25 m) created on the track was also classified by its position (located in a curve or a straight track). This classification was also done by visual determination. Furthermore, it was recorded whether both wheel tracks of the machine trails presented were categorized as the same rut severity class upfront or if opposing wheel tracks differed in their severity.
Depth-to-water mapping and information
The DTW maps had been calculated for the land area of Norway in 2018 and are freely available. The DTW map used for the assessments taken were provided by the Norwegian Institute for Bioeconomy (NIBIO) and the Norwegian Mapping Authority (Norge digitalt). This DTW map was calculated based on the digital terrain model from the new Norwegian altitude model DTM1 (1 × 1 meters) for each major catchment area. The single index value per cell was hereby calculated over the Flow Initiation Area (FIA) of 1 ha in conjunction with the surface flow, presenting a value indicating the depth from this particular point to the nearest flow line (Schönauer et al. Citation2021). The map therefore presents areas with a high probability of increased moisture content nearer the soil surface. Lower DTW values thereby indicate wetter soils, whereas the values of the DTW index increase with the vertical distance to delineated flow lines in the landscape (Murphy et al. Citation2009). By using the DTM1 as a single input value, influencing factors on the flow and water drainage like vegetation, soil type, rock formations, or weather are not taken into account in the calculation.
Investigation of correlation between DTW mapping, rut density, and rut severity
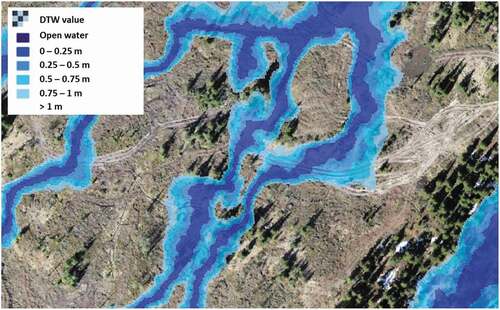
The analysis focused on DTW values less than 1 m grouped in intervals of 25 cm resulting in 6 different DTW categories (0; 0.25 cm; 0.5 cm; 0.75 cm; 1 m; >1 m) from the soil surface (). This visual representation was used for a first evaluation and as basis for the marking of the designated area with depth-to-water values smaller than 1 m (1mDTW), used in the advanced calculations.
Figure 5. Ortho-mosaic of the test site Nr 4, with the corresponding DTW map presenting the different DTW values.
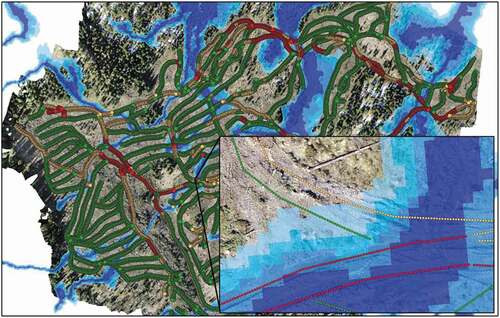
The DTW information was assigned to every sampling point on the track (0.25 m spacing) and exported together with the information about rut severity and location (straight/curved track) for a statistical analysis of the relation between rut severity and DTW. The extent of residual harvesting area outside of the 1mDTW area was also calculated. By assessing the length and count of both straight and curved tracks within and outside of the 1mDTW areas, information was gathered on whether the operators drove less frequently within these areas, hence trying to avoid them by default (). Factors like the weather conditions before and during the harvesting operation, number of passes, and average load mass were not considered as they were not known or not available.
Figure 6. Ortho-mosaic of the test site 4 with corresponding DTW map and classified harvesting/forwarding tracks.
Logistic regression for predicting the probability of rutting
In order to analyze whether the probability of rutting is dependent on the DTW value, a logistic regression model was developed with the DTW value as predictor and the occurrence of rutting as the predicted value. The model was fitted twice: (1) with probability of severe rutting as the predicted variable, we will call this model SEV and (2) with the probability of severe or moderate rutting as the predicted variable, we will call this model SEVMOD. Since the observations are nested within 20 sites, the logistic regression was fit as a mixed effects model with a random effect on the intercept (EquationEquation (1)(1)
(1) ).
where Pij is the probability of observing rutting in the ith measurement of jth site, βX is a linear combination of parameters β and explanatory variables X, and uj is the random effect representing the effect of the jth site, which is assumed to follow a multivariate normal distribution with mean zero. We fitted the mixed effects logistic regression models using the glmer function in the lme4 package in R (Douglas et al. Citation2015).
Logistic regression assumes a linear relationship between the log odds of the dependent variable and the independent variable. To ensure linearity, we tested different transformations of DTW and compared them to a restricted cubic spline, rcs function, from rms package (Harrell Citation2021). The transformation that provided the best results was the inverse of DTW, that is 1/ (DTW + 1).
We measured the fitted model’s predictive discrimination with the AUC, area under a receiver operating characteristic (ROC) curve. A value of AUC of 0.5 indicates random predictions, and a value of 1 indicates perfect prediction. We quantified the predictive strength of the model with pseudo R2 (Nakagawa et al. Citation2017) as implemented in the piecewiseSEM package (Lefcheck Citation2016).
Results
Frequency of rut detection in relation to DTW value
An analysis of 83.4 km machine tracks revealed that 63.6% (53 km) of all tracks showed minor and 24.6% (20.5 km) moderate rut formations. Severe rut formations were present in 11.8% (9.8 km) of all investigated tracks (). However, when the frequency of rut formations is investigated within the 1mDTW area, it shows that the share of moderate and severe ruts increased. Within the 1mDTW area the share of severe ruts doubled with 21% of the investigated tracks (). Moderate and light ruts were present in 24.6% and 51% of the investigated tracks, resulting in a total length of 5.8 km of light, 3.2 km of moderate, and 2.4 km of severe rut formations. Within the harvesting area with DTW values higher than 1 m, it showed that the share of light rut formation was the highest with 65.7% representing 59.1 km of machine trail (). At 24% and 10.3% the share of moderate and severe trails was considerably lower than inside the defined shallow DTW area. However, the absolute length of 21.6 km and 9.3 km was considerably longer.
Figure 7. Share of occurring rut formations, (a) over the entire investigated area, (b) inside the 1mDTW area (DTW >1 m), (c) outside the 1mDTW area (DTW >1 m).
Considering that the extent of the area with DTW values greater than 1 m accounted for a total of 105.3 ha, whereas the area inside the defined 1mDTW area accounted for only 15 ha, a correction factor had to be applied to ensure proportional representation. After adjusting the rut length to the area represented, the results showed that approximately the same proportion of area was affected by light rut inside and outside the 1mDTW area (). For moderate ruts the proportion of rut formations was higher (58%) inside the 1mDTW area than outside the 1mDTW area (). Most importantly, the share of severe rut formations within the 1mDTW area was substantially higher (70.8%) than outside the 1mDTW area ().
Figure 8. Occurrence of rut severity categories of meters per hectare (m/ha) in relation, when inside and outside of the 1mDTW area compared, (a) Density of light rut formations, (b) Density of moderate rut formations, (c) Density of severe rut formations.
Logistic regression for the probability of rutting as a function of DTW value
In order to assess the effect of DTW on rut formation, we fitted two mixed-effects logistic regression models, one with the probability of severe rutting as the predicted variable (SEV), and the other with the probability of severe or moderate rutting as the predicted variable (SEVMOD). The models show that the density of severe ruts increases with decreasing DTW values ( and ).
Table 3. Goodness-of-fit statistics
Figure 9. Graphic representation of the logistic regression between rut severity and DTW value for (a) the fixed effect (typical response) for severe rut formations, (b) illustration of the site-specific effect of DTW on severe rut formations, (c) the fixed effects (typical response) for moderate and severe rut formations and (d) illustration of the site-specific responses for moderate and severe rut formations.
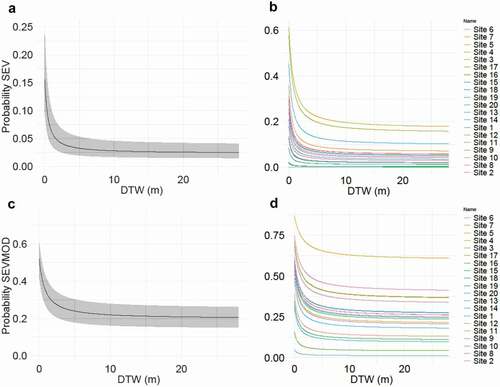
The site-specific predictions of the probability of severe ruts for both SEV and SEVMOD show a large amount of inter-site variability (). This variability suggests the presence of further influencing factors on rut severity such as weather, machine type, soil type, rock formations, etc.
The probability of rut formations for the typical response of a site (fixed effects) increased in the SEVMOD model approximately by a factor of 3 when compared to the SEV model (). For the SEVMOD model the between sites variability is even higher than in the SEV model, underlining the importance of other influencing factors on rut formation while highlighting the importance of the DTW value as rut-prediction variable within a site.
Table 4. Logistic regression parameters. Standard error (fixed effects) and standard deviation (random effects) of the parameters are shown in brackets
Frequency and distribution of turns and curves
In addition to the DTW value, the influence of driving curves and turns on rut severity was investigated. In total 67.1 km of wheel tracks patterns located within turns were investigated. In general, 27.6% of the turns showed a different rut severity category on the left or right wheel track. The remaining 72.4% of curved tracks presented no difference within the left and right wheel track (). Investigating the frequency of curved track and straight tracks inside and outside of the defined 1mDTW area in order to assess whether operators were sensitive to wet areas when considering turns, clearly showed no difference in the relation between curved tracks and straight tracks (). For both inside and outside the DTW area, the relation of straight to curved tracks was measured to be 43% curves and 57% straight tracks. This ratio also did not change when investigating the dataset categorized by rut severity. Forty-two percent of all registered light and moderate rut formations were located within a curve and 58% on straight tracks (). The severe rut formations showed a lower likelihood of occurrence within curves, with 47% of all registered severe rut formations in curves and 53% on straight tracks, when compared to light and moderate rut formations ().
Figure 10. Occurrence of, (a) Identified curves with equal and different rut severity classes on the associated tracks, (b) The relation between curved and straight tracks inside the 1mDTW area, (c) The relation between curved and straight tracks outside the 1mDTW area, (d) Curved and straight tracks with light rut formations, (e) Curved and straight tracks with moderate rut formations, (f) Curved and straight tracks with severe rut formations.
Discussion
The study utilized (consumer grade) drones to capture data from large study areas (stand level). This approach proved to be both easy to execute and to interpret, corroborating similar conclusions by Turner et al. (Citation2012), Nevalainen et al. (Citation2017), Talbot et al. (Citation2018) and Marra et al. (Citation2021). The camera and flight parameters provided a sufficient resolution, allowing the transformation of single images into a high resolution ortho-mosaic, further providing all information required for the applied methodology. For this study, the use of the DJI Phantom 4 was sufficient as the terrain of all 20 test sites was rather flat and in particular chosen to be flown with this setup (). However, as becoming more available and easier to operate, drone technology and according planning software solutions that provide a terrain following option are nevertheless highly recommended.
A challenge with the implementation of the described methodology was found during the identification of tracks and the categorization of the according rut severity class. Due to best practice guidelines, the utilization of brush mats is carried out in order to reduce ground impact of the applied machinery. For some cases, it was difficult to identify the actual track and to assign a rut severity class on brush and debris that covered the tracks within the ortho-mosaic.
Overall, the drone-based mapping of tracks provided a quick and complete dataset that could also easily be captured by a practicing forester as part of standard field duties. However, the identification and classification of the tracks remained work intensive and the potential for measurement error was dependent on the interpretation of the person evaluating the ortho-mosaic. To keep the variation as small as possible, all tracks were hence evaluated by the same person. Developing an automated machine-learning approach for the detection of wheel ruts would significantly reduce the workload and promote a more widespread adoption of the method.
In general, the analyses of the results suggest that the probability of severe or moderate rutting is highest for DTW values smaller than 1 meter, and rapidly decreases afterward. This is in accordance with research conducted by Vega-Nieva et al. (Citation2009), revealing that 65% of the severe ruts (deeper than 25 cm) were detected within the depth-to-water range <1 m, Bergkvist et al. (Citation2014) stating that 60% of the soil damage was recorded on areas defined as “wet” and Niemi et al. (Citation2017) finding a prediction accuracy of 83.6% for soil damage based on DTM-derived soil wetness indices. However, even though DTW information can be considered as a good predictor for the probability of rutting across a harvesting site, the analysis also releveled significant between-site variability. This between site variability suggests that other factors such as soil type, weather conditions, machine type, load capacity, or machine overpasses have a large impact on the actual rutting on a given site and needs to be considered, as suggested by Ågren et al. (Citation2014) and Sirén et al. (Citation2019a) and demonstrated by Salmivaara et al. (Citation2020). Therefore, the soil moisture prediction models are envisioned to become an integrated part of a dynamic and more holistic trafficability prediction concept, in order to consider the above listed parameters, and frequently adapting volatile information, such as weather, or machine sensor data as suggested by Mohtashami et al. (Citation2017).
Within the dataset, no overall evidence for active avoidance of areas with low calculated depth-to-water values were detected by comparing the ratio of machine tracks within and outside of the 1mDTW area (). However, this does not preclude that an avoidance defined by the intensity of overpasses was occurring in the field. It can be interpreted that even though the general density of visible tracks did not differ inside and outside of the 1mDTW area, however certain extraction-routes might have been traveled more frequently, resulting in a higher number of machine passes on these particular tracks, potentially shifting the usage of trafficked areas and thereby masking an intentional avoidance during the forwarding process. The research of Sirén et al. (Citation2019b) and Mohtashami et al. (Citation2017) clearly demonstrated that besides factors like the organic layer, soil type, or the volumetric water content of the mineral soil; the number of machine passes was a major contributing factor to rut formation. Therefore, with the availability of machine global navigation satellite system (GNSS) information, an investigation of the number of machine overpasses and associated load capacity is recommended for further research.
The observation that the probability of severe and moderate rutting increased rapidly with decreasing DTW value, and the observation that the operators generally did not avoid driving through the 1mDTW areas, illustrates the potential for an actual reduction in the extent of soil impact, by utilizing DTW maps in the planning and execution of forest operations. Even though a holistic trafficability-model will have to become a more complex approach than the DTW index alone, our results indicate that the relatively simple and easy accessible DTW information provides a good starting point for planning forest operations to reduce wheel rutting.
Conclusions
Open access spatial and depth-to-water data provide a variety of application purposes. Within this study, these data provided important information of sufficient accuracy to be considered in surveying the extent of soil disturbance associated with mechanized harvesting operations. By applying UAV photogrammetry for visual classification and considering the corresponding depth-to-water-prediction value it can be stated that:
The average density of machine tracks (m/ha) proved to be equal inside and outside of 1mDTW areas.
Seventy-one percent of the measured severe ruts per unit area occurred within the 1mDTW zone.
The majority of the observed severe rutting was observed within 1mDTW areas, and the logistic regression illustrates an overall increase in the probability of rutting with decreasing DTW values. However, the significant influence of site variability illustrates that factors such as soil type, soil moisture content at the time of the operations, and the number of machine passes should be considered in future trials in improving the predictive power of the model.
Disclosure statement
No potential conflict of interest was reported by the author(s).
Additional information
Funding
References
- Agisoft Metashape. 2019. User Manual: Professional Edition, Version 1.5. Agisoft LLC. 1–20. Retrieved from https://www.agisoft.com/pdf/metashape-pro_1_5_en.pdf.
- Ågren AM, Lidberg W, Strömgren M, Ogilvie J, Arp PA. 2014. Evaluating digital terrain indeces for soil wetness mapping – a Swedish case study. Hydrol Earth Syst Sci. 18:3623–3634. doi:https://doi.org/10.5194/hess-18-3623-2014
- Akselsson C, Westling O, Sverdrup H, Gundersen P. 2007. Nutrient and carbon budgets in forest soils as decision support in sustainable forest management. For Ecol Manage. 238(1–3):167–174. doi:https://doi.org/10.1016/j.foreco.2006.10.015
- Ampoorter E, Van Nevel L, De Vos B, Hermy M, Verheyen K. 2010. Assessing the effects of initial soil characteristics, machine mass and traffic intensity on forest soil compaction. For Ecol Manage. 260(10):1664–1676. doi:https://doi.org/10.1016/j.foreco.2010.08.002
- Ballard TM. 2000. Impacts of forest management on northern forest soils. For Ecol Manage. 133(1–2):37–42. doi:https://doi.org/10.1016/S0378-1127(99)00296-0
- Bergkvist I, Friberg G, Mohtashami S, Sonesson J. 2014. STIG-projektet 2010–2014 [The STIG project, 2010–2014]. Skogforsk, Arbetsrapport nr. 818 –2014. 18.
- Cambi M, Certini G, Neri F, Marchi E. 2015. The impact of heavy traffic on forest soils: a review. For Ecol Manage. 338:124–138. doi:https://doi.org/10.1016/j.foreco.2014.11.022
- DJI. 2020 DJI Phantom 4 Pro, Specs . accessed 2020 Jul 9. https://www.dji.com/no/phantom-4-pro/info#specs.
- DJI. 2021 DJI Ground Station Pro . accessed 2021 Feb 2. https://www.dji.com/no/ground-station-pro.
- Douglas B, Maechler M, Bolker B, Walker S. 2015. Fitting linear mixed-effects models using lme4. J Stat Softw. 67(1):1–48. doi:https://doi.org/10.18637/jss.v067.i01
- Edlund J, Bergsten U, Löfgren B. 2012. Effects of two different forwarder steering and transmission drive systems on rut dimensions. J Terramech. 49(5):291–297. doi:https://doi.org/10.1016/j.jterra.2012.03.004
- Eliasson L. 2005. Effects of forwarder tyre pressure on rut formation and soil compaction. Silva Fenn Monogr. 39(4):549–557. doi:https://doi.org/10.14214/sf.366
- Harrell FE Jr. 2021. RMS: regression modeling strategies. R package version 6.2-0. https://CRAN.R-project.org/package=rms.
- Gelin O, Björheden R. 2020. Concept evaluations of three novel forwarders for gentler forest operations. J Terramech. 90:49–57. doi:https://doi.org/10.1016/j.jterra.2020.04.002
- Haas J, Hagge Ellhöft K, Schack-Kirchner H, Lang F. 2016. Using photogrammetry to assess rutting caused by a forwarder-a comparison of different tires and bogie tracks. Soil Tillage Res. 163:14–20. doi:https://doi.org/10.1016/j.still.2016.04.008
- Iglhaut J, Cabo C, Puliti S, Piermattei L, O’Connor J, Rosette J. 2019. Structure from motion photogrammetry in forestry: a review. Curr For Rep. 5(3):155–168. doi:https://doi.org/10.1007/s40725-019-00094-3
- Jones MF, Arp P. 2019. Soil trafficability forecasting. Open J For. 9(4):296. doi:https://doi.org/10.4236/ojf.2019.94017
- Kankare V, Luoma V, Saarinen N, Peuhkurinen J, Holopainen M, Vastaranta M. 2019. Assessing feasibility of the forest trafficability map for avoiding rutting-a case study. Silva Fenn. 53. doi:https://doi.org/10.14214/sf.10197
- Labelle ER, Jaeger D. 2011. Soil compaction caused by cut-to-length forest operations and possible short-term natural rehabilitation of soil density. Soil Sci Soc Am J. 75(6):2314–2329. doi:https://doi.org/10.2136/sssaj2011.0109
- Lavelle P, Decaëns T, Aubert M, Barot S, Blouin M, Bureau F, Margerie P, Mora P, Rossi JP. 2006. Soil invertebrates and ecosystem services. Eur J Soil Biol. 42(SUPPL. 1):S3–S15. doi:https://doi.org/10.1016/j.ejsobi.2006.10.002
- Lefcheck JS. 2016. piecewiseSEM: piecewise structural equation modeling in R for ecology, evolution, and systematics. Methods Ecol Evol. 7(5):573–579. doi:https://doi.org/10.1111/2041-210X.12512
- Liu K, Ayers P, Howard H, Anderson A. 2009. Influence of turning radius on wheeled military vehicle induced rut formation. J Terramech. 46(2):49–55. doi:https://doi.org/10.1016/j.jterra.2009.02.004
- Marra E, Wictorsson R, Bohlin J, Marchi E, and Nordfjell T. 2021. Remote measuring of the depth of wheel ruts in forest terrain using a drone. Int J For Eng 32(3) :224–234.
- Michelsen O, Solli C, Strømman AH. 2008. Environmental impact and added value in forestry operations in Norway. J Ind Ecol. 12(1):69–81. doi:https://doi.org/10.1111/j.1530-9290.2008.00008.x
- Mohtashami S, Eliasson L, Jansson G, Sonesson J. 2017. Influence of soil type, cartographic depth-to-water, road reinforcement and traffic intensity on rut formation in logging operations: a survey study in Sweden. Silva Fenn. 51(5):1–14. doi:https://doi.org/10.14214/sf.2018
- Murphy PNC, Ogilvie J, Arp P. 2009. Topographic modelling of soil moisture conditions: a comparison and verification of two models. Eur J Soil Sci. 60(1):94–109. doi:https://doi.org/10.1111/j.1365-2389.2008.01094.x
- Nakagawa S, Johnson PCD, Schielzeth H. 2017. The coefficient of determination R2 and intra-class correlation coefficient from generalized linear mixed-effects models revisited and expanded. J R Soc Interface. 14(134):20170213. doi:https://doi.org/10.1098/rsif.2017.0213
- Nevalainen P, Salmivaara A, Ala-Ilomäki J, Launiainen S, Hiedanpää J, Finér L, Pahikkala T, Heikkonen J. 2017. Estimating the rut depth by UAV photogrammetry. Remote Sens. 9(12):1–26. doi:https://doi.org/10.3390/rs9121279
- Niemi MT, Vastaranta M, Vauhkonen J, Melkas T, Holopainen M. 2017. Airborne LiDAR-derived elevation data in terrain trafficability mapping. Scand J For Res. 32(8):762–773. doi:https://doi.org/10.1080/02827581.2017.1296181
- Nugent C, Kanali C, Owende PMO, Nieuwenhuis M, Ward S. 2003. Characteristic site disturbance due to harvesting and extraction machinery traffic on sensitive forest sites with peat soils. For Ecol Manage. 180(1–3):85–98. doi:https://doi.org/10.1016/S0378-1127(02)00628-X
- Pierzchała M, Talbot B, Astrup R. 2016. Measuring wheel ruts with close-range photogrammetry. Forestry. 89(4):383–391. doi:https://doi.org/10.1093/forestry/cpw009
- Ponge JF, André J, Zackrisson O, Bernier N, Nilsson MC, Gallet C. 1998. The forest regeneration puzzle: biological mechanisms in humus layer and forest vegetation dynamics. BioScience. 48(7):523–530. doi:https://doi.org/10.2307/131331410.2307/1313314
- QGIS Development Team. 2020. QGIS geographic information system. Open-Source Geospatial Foundation Project. http://qgis.osgeo.org.
- Riley SJ, DeGloria SD, Elliot R. 1999. Terrain_Ruggedness_Index.pdf. Intermountain J Sci. 5:23–27.
- Sakai H, Nordfjell T, Suadicani K, Talbot B, Bøllehuus E. 2008. Soil compaction on forest soils from different kinds of tires and tracks and possibility of accurate estimate. Croatian J For Eng. 29(1):15–27. http://hrcak.srce.hr/index.php?show=clanak&id_clanak_jezik=40565.
- Salmivaara A, Launiainen S, Perttunen J, Nevalainen P, Pohjankukka J, Ala-Ilomäki J, Sirén M, Laurén A, Tuominen S, Uusitalo J, et al. 2020. Towards dynamic forest trafficability prediction using open spatial data, hydrological modelling and sensor technology. Forestry. 93(5):662–674. doi:https://doi.org/10.1093/forestry/cpaa010
- Schönauer M, Hoffmann S, Maack J, Jansen M, Jaeger D. 2021. Comparison of selected terramechanical test procedures and cartographic indices to predict rutting caused by machine traffic during a cut-to-length thinning-operation. Forests. 12(2):1–22. doi:https://doi.org/10.3390/f12020113
- Schweier J, Magagnotti N, Labelle ER, Athanassiadis D. 2019. Sustainability impact assessment of forest operations: a review. Curr For Rep. 5(3):101–113. doi:https://doi.org/10.1007/s40725-019-00091-6
- Sirén M, Salmivaara A, Ala-Ilomäki J, Launiainen S, Lindeman H, Uusitalo J, Sutinen R, Hänninen P. 2019a. Predicting forwarder rut formation on fine-grained mineral soils. Scand J For Res. 34(2):145–154. doi:https://doi.org/10.1080/02827581.2018.1562567
- Sirén M, Ala-Ilomäki J, Lindeman H, Uusitalo J, Kiilo KE, Salmivaara A, Ryynänen A. 2019b. Soil disturbance by cut-to-length machinery on midgrained soils. Silva Fenn. 53(2):article id 10134.24. doi:https://doi.org/10.14214/sf.10134
- Suvinen A, Tokola T, Saarilahti M. 2009. Terrain trafficability prediction with GIS analysis. For Sci. 55(5):433–442. doi:https://doi.org/10.1093/forestscience/55.5.433
- Talbot B, Rahlf J, Astrup R. 2018. An operational UAV-based approach for stand-level assessment of soil disturbance after forest harvesting. Scand J For Res. 33(4):387–396. doi:https://doi.org/10.1080/02827581.2017.1418421
- Toivio J, Helmisaari HS, Palviainen M, Lindeman H, Ala-Ilomäki J, Sirén M, Uusitalo J. 2017 Jun. Impacts of timber forwarding on physical properties of forest soils in southern Finland. For Ecol Manage. 405:22–30. doi:https://doi.org/10.1016/j.foreco.2017.09.022
- Turner D, Lucieer A, Watson C. 2012. An automated technique for generating georectified mosaics from ultra-high resolution Unmanned Aerial Vehicle (UAV) imagery, based on Structure from Motion (SFM) point clouds. Remote Sens. 4(5):1392–1410. doi:https://doi.org/10.3390/rs4051392
- Uusitalo J, Salomäki M, Ala-Ilomäki J. 2015. The effect of wider logging trails on rut formations in the harvesting of peatland forests. Croat J For Eng. 36(1):125–130.
- Uusitalo J, Ala-Ilomäki J, Lindeman H, Toivio J, Siren M. 2019. Modelling soil moisture – soil strength relationship of fine-grained upland forest soils. Silva Fenn. 53(1):article 10050. doi:https://doi.org/10.14214/sf.10050
- UgCS. 2021 UgCS Support . accessed 2021 Aug 14. https://wiki.ugcs.com/?from_ugcs_support.
- Vega-Nieva DJ, Murphy PNC, Castonguay M, Ogilvie J, Arp PA. 2009. A modular terrain model for daily variations in machine-specific forest soil trafficability. Can J Soil Sci. 89(1):93–109. doi:https://doi.org/10.4141/CJSS06033
- White B, Ogilvie J, Campbell DMH, Hiltz D, Gauthier B, Chisholm HK, Wen HK, Murphy PNC, Arp PA. 2012. Using the cartographic depth-to-water index to locate small streams and associated wet areas across landscapes. Can Water Resour J. 37(4):33. doi:https://doi.org/10.4296/cwrj2011-909