
 ?Mathematical formulae have been encoded as MathML and are displayed in this HTML version using MathJax in order to improve their display. Uncheck the box to turn MathJax off. This feature requires Javascript. Click on a formula to zoom.
ABSTRACT
Tree-length harvesting with skidders is common in the Northeast US. Traditional rubber-tired skidders (with and without chains) make repeated passes over skid trails during a timber harvest. This traffic causes rutting and compaction which can lead to concentrated surface run-off and sediment delivery to streams. An innovation referred to as attachable tracks for wheeled logging equipment is designed to improve traction and reduce ground disturbance. In theory, increased traction could reduce rutting (negative soil displacement) and improve tire flotation and compaction while providing loggers with an accessible and durable tool. We examined rutting, soil bulk density and mechanical resistance using attachable single-wheel tracks versus traditional chains and bare tires in a randomized controlled study. Soil bulk density did not differ among the three tire cover types. Bare tires caused the least mechanical resistance followed by tracks then chains. After one year of recovery of the skid trails, bare tires resulted in the lowest mechanical resistance and single-wheel tracks the highest. Soil profile measurements were similar across the three tire cover types with very shallow rutting that was less than 5 cm; however, tracks did create statistically significantly deeper ruts than bare tires and chains. These results do not make a compelling case that single-wheel tracks have less impact on forest soils compared to either chains or bare tires.
Introduction
Since the early nineteenth century, the demand for wood products has grown globally. Without evolving forest harvesting practices, it would not be possible to meet the demand. Advancements in harvest systems have produced larger and more powerful harvesting equipment; unfortunately, all that horsepower often comes with extra size and weight, along with potential negative impacts on forest ecosystems (Horn et al. Citation1995; Zemanek and Neruda Citation2021). A common logging practice in the Northeast US is to fell trees by hand or mechanized equipment and subsequently pull the tree-length stems to the landing with a wheeled skidder. Rubber-tired skidders (with and without chains) make repeated passes over skid trails. In regions with hilly topography, this traffic causes rutting and compaction, concentrating surface run-off, resulting in erosion and sediment delivery to surface water. An estimated 80–90% of the sediment run-off from a logging operation is linked to the harvest access system of skid trails and forest roads which usually accounts for 10 to 15% of the harvest area (Patric Citation1976; Swift Citation1984; Germain and Munsell Citation2005).
Soil compaction is a natural phenomenon that results from increased force on the soil which can occur as a result of intense rainfall, growth of plant roots, and foot traffic from animals (Taylor and Brar Citation1991). However, the most impactful force in forests is usually associated with the machinery used to harvest timber (Greacen and Sands Citation1980). Soil compaction has adverse effects on root growth, water infiltration, and soil aeration. Compression of the soil destroys macropores, which reduces total porosity, resulting in less gaseous exchange within the soil profile. This reduces soil infiltration capacity, leading to increased and concentrated surface runoff which makes its way to water bodies, leading to sedimentation. Soil compaction also restricts root growth and uptake of water and nutrients, reducing tree growth (Greacen and Sands Citation1980; Naghdi et al. Citation2018; Zemánek and Neruda Citation2021). Roots must penetrate nearby soil to elongate and grow. With increased compaction and decreased macroporosity, root growth is both slowed and truncated (Greacen and Sands Citation1980; Taylor and Brar Citation1991). Soil compaction can be measured via bulk density and mechanical resistance. Soil bulk density is defined as the mass of the soil per unit volume of soil, whereas mechanical resistance is the reaction of the soil to the forces exerted by growing plants. Both measures serve to indicate ease of root penetration through the soil, predict water transmission, and indicate soil quality (Grossman and Reinsch Citation2002).
Heavy skidders making repeated passes on skid trails can increase soil compaction. Most of the compaction from skidders originates from the rear wheels due to the added weight of the hitch (Horn et al. Citation1995; Naghdi et al. Citation2018). Bulk density and mechanical resistance of the soil can increase significantly even after just one pass of heavy logging equipment (Parkhurst et al. Citation2018). However, logging requires repeated passes of skidders and forwarders to move stems or logs from the felling site to the landing. In addition to compaction, repeated passes can cause visible rutting and soil displacement. Wheel slippage, which is a main cause of rutting, is the result of insufficient traction and wasted mechanical energy. This energy is displaced into the movement of the soil, causing ruts. In steeper terrain, ruts can concentrate surface flow into channels, which can then direct flow into nearby streams, causing sedimentation (Parkhurst et al. Citation2018).
Forestry best management practices (BMPs) for water quality represent strategies to minimize the movement of soil and protect water quality, while still allowing other forest management objectives (e.g., timber production, recreation) to be met. Most BMPs are associated with harvest planning (i.e., landing location, culverts, skid trail location) or remediation after the fact (i.e., smoothing rutting on skid trails, installing waterbars); however, with the size and power of today’s logging machinery, there is a greater need to focus on BMPs during a harvest.
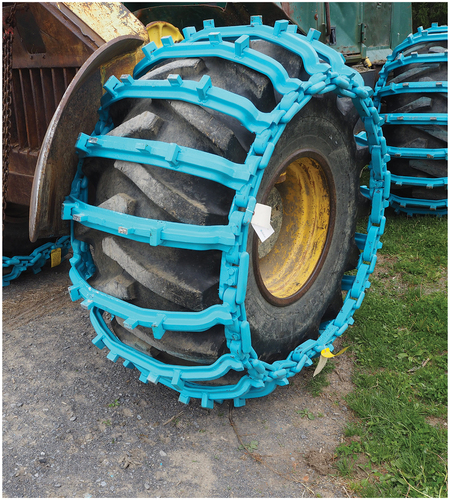
There is a new innovation in tire traction technology known as single-wheel attachable tracks that seems promising as a possible BMP during harvesting operations. The manufacturers of single-wheel attachable tracks (single-wheel tracks) claim increased stability, better grip and pulling power, extended tire life, reduced fuel consumption, and lower impact on forest soils (Olofsfors Citation2021). Attachable tracks have been used on feller-bunchers, harvesters, and forwarders for several decades, however, attachable single-wheel tracks for skidders are a new innovation. Single-wheel tracks on skidders can potentially reduce soil compaction and rutting by improving flotation. To date, there is little empirical evidence to support or refute product claims associated with single-wheel attachable tracks. Although single-wheel tracks offer roughly 30% more surface area than chains (Olofsfors Citation2021), it is important to note that single-wheel tracks do not offer the surface area and flotation associated with traditional dozer tracks or tracks commonly used on feller-bunchers and harvesters. As is evident from the photo in , they represent a mid-point between traditional tracks and chains.
Figure 1. A newly installed Eco-track prior to trial #1 at the Tully location.
In this study, we examined three different skidder tire cover types (bare tires, tires with chains, and tires with single-wheel tracks) and compared their impacts on soil compaction and disturbance. Specifically, we compared soil bulk density, mechanical resistance and rutting among the three tire cover types.
Materials and methods
Study location and layout
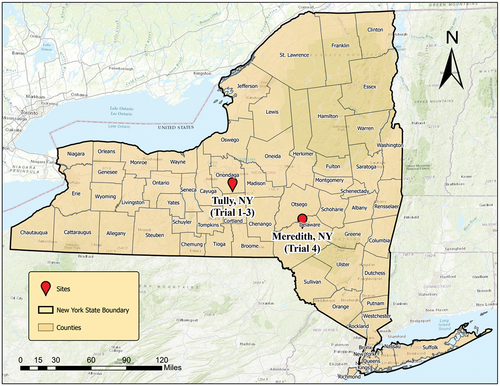
This research took place in Meredith and Tully, New York (). These study locations were chosen based on accessibility, convenience, and ability to control some external factors.
Figure 2. Map of study locations.
The logger at the Heiberg location operated a Timberjack 360 skidder. Per the user manual, this model weighs roughly 8,392 kg with bare tires (size 28–26). It is 3 m wide, 6.3 m in length, and has a ground clearance of 51 cm. The 6-cylinder engine has a maximum horsepower of 119. A concrete block was attached via the cables and lifted completely off the ground to simulate a hitch weighing approximately 2,000 kg.
The fourth trial (T4) took place September 2020 in Meredith, NY in a field adjacent to a county highway. The physical capacity of the area limited us to one trial at this site. The soil at this location was mapped as Lewbeach channery loam. This soil type is found on hills and mountains with average slopes of 8 to 15 %, and is derived from reddish sandstone, siltstone, and shale which results in a loamy till. There is a fragipan beginning around 43–91 cm in depth (USDA Citation2021). The slope of the Trial #4 site averaged 3–10 %. Similar to the Heiberg location, these soils have a history of agricultural land use. The ground cover was mostly grass, milkweed (L. Asclepias syriaca), and goldenrod (Solidago rigida var). In contrast to the Heiberg location, this site was not mowed, resulting in vegetative ground cover averaging 50 cm tall.
The logger at the Meredith location operated a 2008 John Deere 648 H Grapple Skidder with size 32–30.5 tires. Per the user manual, this model weighs around 14,626 kg with bare tires. It is 7.2 m long, 3.1 m wide, and has a ground clearance of 0.5 m. The 6-cylinder engine has 172 of horsepower. This skidder used the grapple to tow a cement block weighing approximately 1600 kg completely off the ground to simulate a hitch.
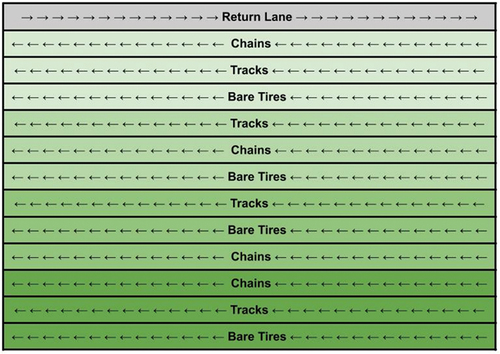
Each trial consisted of four replications of each wheel cover type: four bare tires (BT), four tires with attached chains (CH), and four tires with single-wheel tracks (TR). Each replication consisted of one uni-directional lane for each cover type (BT/CH/TR) which will be referred to as a plot. The sample plots were 6 × 40 m (). The 6 m of width allowed for 3 m of buffer between different lane conditions to avoid interaction between plots. This resulted in 12 plots per trial for a total of 48 plots (experimental units) arranged into 16 blocks. Each trial site had a 6 m wide return lane () to allow the skidder to return to the start of the lanes without interfering with the study plots.
The skidders unidirectionally passed through each plot a total of 12 times. Trials #1, #2, and #4 were completed within a two-day period to control for varying weather conditions and soil moisture contents. Trial #3 was delayed mid-way through by three days to allow the soil to dry after a rain event.
Bulk density and soil moisture
Bulk density sampling was done using a double core drop hammer soil sampler with a 5 cm diameter opening and 10 cm length. Core sampling locations were chosen by a random number generator (1–39); the number refers to distance (m) from the beginning of the lane. Soil cores (0–10 cm depth) were collected from the left wheel track, right wheel track, and the middle. Cores were collected at four traffic frequencies (0, 4, 8, and 12 passes) to represent the no, low, medium, and high range for skidder passes.
To obtain the samples, the top layer of debris (grass and litter) was removed. The sampler was then placed on the soil and driven downward by the drop hammer until the top of the soil core was in line with the surrounding soil. Samples were then carefully removed from the sampler, and split between the top 5 cm and the bottom 5 cm. Samples were then gently placed into labeled plastic bags and sealed. The sample bags were then checked for holes to ensure maintenance of soil moisture. The samples were brought back to the soil lab and promptly weighed. Weighed samples were put into labeled tins and oven dried to 105°C. The drying oven could hold 96 samples at a time. Samples that were not being processed immediately were kept sealed, and in a cool place until dried. After 48 hours of drying, 5 randomly selected samples were weighed every 24 hours until there was no longer any change in mass. This process required 3–5 days of drying, depending on the moisture content of the soil.
After the samples were dried, they were again weighed. Rocks larger than 5 mm were removed, weighed, and volume was measured via water displacement. Rock weight was subtracted from each sample weight, and rock volume was then deducted from the sample volume. Bulk density and soil moisture were calculated as EquationEquation 1(1)
(1) and Equation2
(2)
(2) , respectively:
(Wilde et al. Citation1972).
(Grossman and Reinsch Citation2002)
The analysis of variance (ANOVA) for bulk density measurements used a completely randomized block design incorporating 16 blocks and 3 tire cover types resulting in 48 experimental units. The comparison of the three tire cover types was done separately for the 5 cm depth measurements and the 10 cm depth measurements. A separate ANOVA was done for each of 0, 4, 8, and 12 passes. A general linear model was run to establish if there was a statistically significant difference in mean soil moisture content between the three tire cover types. Tukey’s method was then used to conduct pairwise comparisons of treatment means while controlling the experiment-wise Type I error rate. A significance level of α = 0.05 was used to determine statistical significance for all tests. Normal probability plots of the residuals from the general linear model were examined to evaluate the degree of departure from normality and to check for any obvious outliers. No major departures from normality or outliers were observed. Minitab 18 was the statistical software used for the analysis (Minitab Citation2020).
Because the same plots were measured for each pass of the skidder, a repeated measures analysis (Meredith and Stehman Citation1992) was necessary to assess whether the three tire cover types differed in terms soil disturbance as a function of number of passes. For each plot, we estimated the slope of the simple linear regression model of the soil disturbance variable (y) as a function of number of passes (x = 0, 1, 2, …, 12). An ANOVA was then run using the estimated slope for each plot as the response variable. If the mean slopes among the three tire cover types differed, this would indicate a treatment difference in the rate of disturbance as the number passes increased.
Mechanical resistance
Soil mechanical resistance was measured using a soil penetrometer. Measurements were collected from a cross-section of the lane. Placement of the cross-section was determined using a random number generator. Two readings were collected from each of the left wheel track, right wheel track, and on the inner wheel path (). These readings were taken following each pass of the skidder (0–12). The penetrometer was pushed into the soil up to 10 cm.
Figure 3. Visual representation of trial layout with each set of three treatments constituting a block in the randomized block design with four blocks and a 6 m wide return lane to allow the skidder to return to the start of the lanes without interfering with the study plots.
Using the same field protocol, mechanical resistance measurements were completed during the summer of 2021 in Heiberg trials #1 and #2 to assess soil recovery after one year. The other trial areas had since been disturbed with tractor traffic.
Analysis of mechanical resistance used the same general linear model approach for the randomized complete block design as described with the bulk density analysis. Similar to the analysis of bulk density, a repeated measures analysis was applied to the 2020 data to assess if the rate of change in mechanical resistance over time (i.e., number of passes) differed among the three tire cover types. For the one-year recovery data analysis, only Heiberg trials #1 and #2 were used, creating 8 blocks and 24 total experimental units. Each lane had 6 measurements taken from the wheel tracks for each condition resulting in each tire cover type having a sample size of 96 mechanical resistance measurements.
Soil rutting
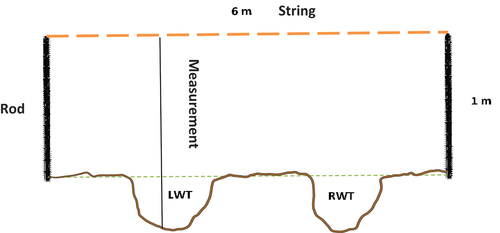
Soil rutting was measured via positive and negative soil displacement. The soil profile meter assembly consisted of two permanent rods, which were inserted before the trials started, a metric measuring tape, and a string. The string was marked every 20 cm to indicate the measurement location and stretched tight between the permanent rods. The locations for the permanent rods were determined at random before the trials began, and not moved during the experiment. Measurements were taken across the lane from the string at the marked intervals. The measuring tape was placed vertically from the string to the ground, and distance was recorded to the nearest centimeter. Measurements were taken at 20 cm intervals to create a cross section of the ruts across the lane profile (). These measurements were taken at 0, 4, 8, and 12 passes.
Figure 4. Locations for mechanical resistance readings within a lane.
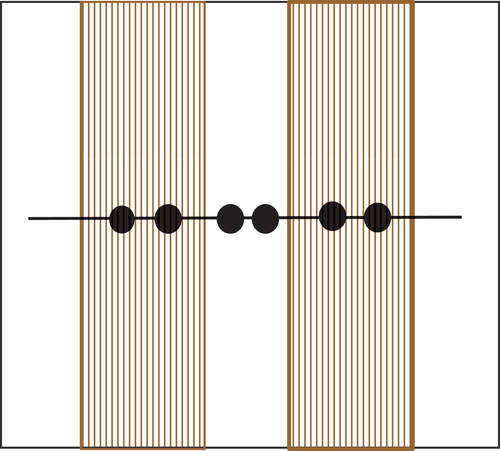
Figure 5. Visual representation of how the soil profile was measured with a taunt string across two metal rods. Measurements were taken across the profile which includes the potential ruts in the left wheel track (LWT) and right wheel track (RWT).
Soil profile results were analyzed by splitting the rutting depths (negative displacement) and positive displacement measurements of the soil into two separate analyses. Each used a completely randomized block design using 12 blocks and 3 cover types resulting in 36 experimental units. Only three trials were used for this analysis due to data collection errors in trial #4.
We found the differences between pass 0 and passes 4, 8, and 12 to establish change in the soil profile. Due to there being minimal movement of the soil, only the differences between passes 0 and 12 were used for further analysis. We then separated the negative differences in soil rutting from the positive displacement to create two groups for analysis. An ANOVA was then used to assess if differences in rutting (negative displacement) or positive displacement occurred among the three tire cover types.
Soil moisture
Soil moisture content plays an important role in the degree of soil compaction, mechanical resistance, and rutting depth that can be caused by harvesting machines (Ampoorter et al. Citation2010; Jourgholami and Majnounian Citation2011). The likelihood of soil disturbance is greater on moist to saturated soils (Greacen and Sands Citation1980; McDonald et al. Citation1995; Aust et al. Citation1998). As is evident from the mean moisture contents in , the average soil moisture content across trials ranged from 31–42%. This puts the soil moisture content at about field capacity, representing the water remaining in the soil a few days after a precipitation event. For loamy soils, field capacity ranges from 35–45% (Cornell University Citation2010).
Table 1. Average soil moisture across trials.
Results
Bulk density
At passes 0 through 12, we observed no statistical difference in bulk density between the tire cover types for either the 5 cm or 10 cm depth (). The results for the repeated measures analysis show similar findings. There was no statistical difference between the mean slopes of the regression lines for the three tire cover types at a depth of 5 cm (p-value = 0.58) or 10 cm (p-value = 0.28), indicating that the rate of change in bulk density over time (number of passes of the skidder) was not different between the three tire cover types.
Table 2. Average bulk density at 5 cm for bare tires, chains and tracks cover types (16 replications for each tire cover type).
Table 3. Average bulk density at 10 cm for bare tires, chains and tracks cover types (16 replications for each tire cover type).
Mechanical resistance
There were no significant differences in average mechanical resistance between the three tire cover types (p-value = 0.80) at pass 0 or at pass 4 (p-value = 0.06), although greater separation between means occurred at pass 4 (). By pass 8, there was a significant difference (p-value = 0.01) with single-wheel tracks and chains significantly higher than bare tires. By the final pass (pass 12), the bare tires continued to exhibit the least amount of mechanical resistance while the chains resulted in the highest mechanical resistance. The bare tires treatment was not significantly different from single-wheel tracks.
Table 4. Average mechanical resistance for bare tires, chains and tracks cover types (16 replications for each tire cover type).
The repeated measures analysis of mechanical resistance revealed that the trend in mechanical resistance over number of passes was different among the three tire cover types (). The rate of change (average slopes) was not significant between the chains and single-wheel tracks cover types, but both chains and single-wheel tracks had statistically greater rates than the bare tires.
Table 5. Average slope for mechanical resistance as a function of number of passes (i.e., comparison of rate of change in mechanical resistance).
In the summer of 2021, Heiberg trials #1 and #2 were re-measured to assess mechanical resistance after one year of recovery (). There were significant differences (p-value = .001) in mechanical resistance between the three tire cover types. Similar to the prior year, bare tires showed the least resistance, single-wheel tracks the highest, and chains intermediate. The bare tires mean declined from 3614 to 3060 kPa and chains declined from 4434 to 3585 kPa, while single-wheel tracks remained relatively unchanged (3943 vs. 3980 kPa). Although practically the same, the slight increase in mechanical resistance with single-wheel tracks a year later is likely due to the location of the penetrometer measurements in the lanes.
Table 6. Average mechanical resistance for bare tires, chains and tracks cover types after one year of recovery for Heiberg trials #1 and #2.
Soil profile
The mean positive displacements from the soil profile measurements for all three tire cover types were not statistically different (p-value = 0.39) (). Among the three tire cover types, the single-wheel tracks caused significantly more rutting of the soil than the other two tire cover types. However, even though there was more rutting (negative displacement) for the single-wheel tracks, the magnitude was minimal at less than 5 cm. There was no significant difference (p-value = 0.41) between the chains and bare tires cover types.
Table 7. Rutting as measured by average negative and positive displacement across cover types (12 replications for each tire cover type).
Discussion
Overall, our results do not make a compelling case that single-wheel tracks have less impact on forest soils compared to either chains or bare tires. There were no statistical differences in bulk density results among single-wheel tracks, chains, and bare tires. All per pass and repeated measures analyses indicate that all three tire cover types behaved in similar ways in terms of increasing soil bulk density.
In general, it appears the bulk densities across the two study locations are generally low. Bulk densities in the range of 1.10 g/cm3 – 1.60 g/cm3 (depending on soil type) are considered ideal for plant growth, while bulk densities in the 1.47 g/cm3 – 1.80 g/cm3 range or greater can restrict root growth (USDA Citation2008). In this study, the maximum bulk density measurement (not mean) reached at 10 cm depth was 1.47 g/cm3 and at 5 cm depth was 1.03 g/cm3. This suggests that although compaction did occur over the 12 passes, the post-study soil conditions were not root restricting.
The mechanical resistance analyses did show some difference after 8 passes; soil under single-wheel tracks and chains exhibited statistically higher mechanical resistance compared to bare tires. This increase was maintained after 12 passes. The repeated measures analysis revealed increased mechanical resistance among tire cover types throughout. Chains and single-wheel tracks increased mechanical resistance at a statistically faster rate than bare tires.
The mechanical resistance results indicate a higher level of soil compaction. The literature suggests that the growth of tree roots can slow at a mechanical resistance as low as 496 kPa, while root growth stops completely between 2,000 to 3,000 kPa (Miller et al. Citation2004). Mechanical resistance measurements (not means) for this study after the early passes ranged between 1,910 to 2772 kPa, reinforcing the narrative that the soils on these sites may have a history of agricultural compaction. The range of mechanical resistance measurements after 12 passes across the 4 trials was between 3365 to 4764 kPa – significantly beyond the range for viable root growth. Interestingly, the mechanical resistance measurements at Heiberg trials #1 and #2 after one year of recovery showed a range of 1,958 to 5,943 kPa. The mechanical resistance means declined for bare tires and chains, but remained the same for single-wheel tracks, suggesting that site recovery may take longer when using tracks. This is likely due to the added weight of the tracks to the skidder.
Variability between penetrometer readings and bulk density sampling could have been the result of the way these data were collected. When using the bulk density hammer, the operator did not have to stop due to rocks as often as the person operating the penetrometer. If the penetrometer did hit a small rock, but was still able to penetrate to 10 cm, it may have increased mechanical resistance measurements.
Similar studies on the effects of harvesting machinery and traffic intensity on soil compaction and mechanical resistance have also yielded highly variable results. As we discuss these studies comparing various wheel cover types, it is important to recognize that single-wheel tracks are not equivalent to traditional tracks, but rather more of an upgrade from traditional chains. Because this is one of the first studies to examine the impact of single-wheel tracks on soil compaction and displacement, we were limited when comparing our results with previous work. In the studies referenced below, the term “track” represents traditional tracks rather than single-wheeled tracks. Please keep this important caveat in mind when interpreting the discussion.
Similar to our study, Kamaruzaman (Citation1991) reported tracked machines had significantly more compaction than rubber-tired machines for up to 30 passes. Tracks exhibited a more gradual compaction with increasing passes while rubber-tired machines started off with a steeper increase in compaction before leveling off. Somewhat contrary to our results, Bashford et al. (Citation1988) reported that up to a depth of 15 cm, the rubber-tired machines had a significantly greater impact on bulk density; however, at lower depths (below 15 cm) there was no difference between the two machine types. More consistent with our results, Jansson and Johansson (Citation1998) reported that the rubber-tired machine decreased bulk density at 5 cm depth while the tracked machine increased bulk density, despite its lower ground pressure. They suspect the decrease from rubber tires was caused by organic matter being mixed into the soil due to wheel slippage.
Ampoorter et al. (Citation2010) examined the impact of different machines and traffic intensity on various soil types. Similar to our study, the authors expected loams and silt loams to be sensitive to soil compaction, but the response was small to negligible. This was attributed to the low moisture content of the soil and previous history of compaction at the site. They found that both bulk density and mechanical resistance were lower than expected for those soil types. This was attributed to high initial levels of compaction and soil moisture content (ranging from 12–20%) which was considerably lower than the moisture content across the trials for our study. With respect to our study, both soil types were well-drained, and have a history of agricultural compaction (USDA Citation2021). Soil moisture content was higher than the Ampoorter et al. (Citation2010) study, averaging between 30–40%, but similarly, bulk density was lower than expected, while mechanical resistance was higher. As previously explained, the higher mechanical resistance measurements were likely influenced by the penetrometer probe hitting small rocks in the soil.
Our study found that single-wheel tracks caused the deepest “rutting” depths as compared to chains and bare tires. However, these depths are quite small, averaging less than 5 cm. Actually, it is a misnomer to even refer to them as ruts. There were no statistical differences between any cover types in terms of the displacement of soil, all of which averaged around 1–1.5 cm of change. The former agricultural soils and soil moisture conditions during this study may have resulted in these minimal rutting depths and lateral displacement measures. As reported by Hatchell et al. (Citation1970), increasing soil moisture resulted in more lateral displacement and deeper rutting in the soil. It is common to find rutting depths up to 22 cm or more, especially in wetter soil conditions (Naghdi and Solgi Citation2014; Naghdi et al. Citation2018).
The significantly higher displacement, albeit minimal, by the single-wheel tracks in this study is counter to the established literature which indicates that increased surface area and flotation, when compared to chains and bare tires, should result in less comparative rutting. Again, it is important to note that this study did not experience any true rutting. Jansson and Johansson (Citation1998) reported that it took a tracked machine 8 passes to reach the same rutting depth as a wheeled machine after 2 passes. The authors suspected that this could be due to the rubber tires tearing at the soil and mixing the organic matter layer in with the soil. Tracks, on the other hand, caused shallow ruts and left the organic layer intact. We observed that the single-wheel tracks tend to have a sturdier grip on the soil with the cleats on the crossbars, and create less movement of the soil overall. Chains have a similar design, but by nature are not able to maintain a tight fit on the tire, leading to slippage. The bare tires, depending on pass number, tended to have a bit more wheel slip, but did not aerate the soil like the single-wheel tracks and chains did.
More studies needed
Future research contrasting single-wheel tracks and chains with respect to soil disturbance is needed. The Northeast US is dominated by challenging topography which requires skidders to have added traction. Keeping chains on skidders year-round to aid in traction on slopes and in adverse weather conditions is a common practice among loggers. A direct comparison between chains and single-wheel tracks would be a more useful and efficient avenue of study because single-wheel tracks on skidders are an alternative to chains, but not so much to bare tires. Future work should examine the soil impacts from single-wheel tracks and chains at varying slopes in “real-world” logging conditions. The cleated tracks reportedly reduce slippage, and based on anecdotal evidence from loggers, chains tend to slip and move throughout a logging job. The introduction of a slope component could shed light on the differences between these tire cover types and their relative abilities in steep conditions. Adding a forwarder with more traditional tracks in the aforementioned studies would be a useful contribution as well.
The impacts of single-wheel tracks versus other tire cover types at various soil moisture contents also requires further study. We were unable to include moisture content as a controlled variable in our study. Loggers are often faced with wet and muddy working conditions, and it is imperative to know how single-wheel tracks impact the soil at various soil moisture contents. Completing this study at a higher moisture content would likely lead to more intense rutting and soil displacement and would give a better representation of the cumulative effects of skidders equipped with bare tires, chains, and single-wheel tracks.
Variables associated with productivity and economic viability also require more study. For instance, skidders with single-wheel tracks are able to pull larger loads due to increased traction, thereby resulting in fewer passes on skid trails, potentially reducing soil compaction and general disturbance while simultaneously improving productivity, and perhaps profitability. In addition, the manufacturer claims that single-wheel tracks are more durable than traditional chains, and by extension, do a better job of protecting tires from wear and tear (Olofsfors Citation2021). A comparative cost-benefit analysis of the product life of chains versus single-wheel tracks, overall productivity, and cost would be valuable to the logging community.
Conclusions
Overall, this study offers mixed results. Single-wheeled tracks behaved similarly to both chains and bare tires in terms of increasing bulk density in the soil. Single-wheel tracks also performed similarly to chains with regards to mechanical resistance, creating higher resistance in the soil at a faster rate than bare tires over the course of the study. With respect to rutting, single-wheel tracks ended up creating significantly more rutting, but in reality, given the field conditions, the amount of actual rutting was nearly nonexistent. While adding almost 1,000 kg of weight to the skidder, the single-wheel tracks were comparable to chains and bare tires with respect to bulk density, and most similar to chains in terms of mechanical resistance. This indicates that despite the added weight, single-wheel tracks seem to be comparable to chains in terms of soil disturbance. Based on the results of this study alone, we cannot recommend single-wheel tracks be marketed as a new BMP for logging with skidders. However, single-wheel tracks offer many positive attributes and can serve as an integral component of a harvest system.
Disclosure statement
No potential conflict of interest was reported by the author(s).
Additional information
Funding
References
- Ampoorter E, Van Nevel L, De Vos B, Hermy M, Verheyen K. 2010. Assessing the effects of initial soil characteristics, machine mass and traffic intensity on forest soil compaction. For Ecol Man. 260:1664–1676. doi:10.1016/j.foreco.2010.08.002
- Aust WM, Burger JA, Carter EA, Preston DP, Patterson SC. 1998. Visually determined soil disturbance classes used as indices of forest harvesting disturbance. South J Appl For. 22:245–250. doi:10.1093/sjaf/22.4.245.
- Bashford LL, Jones AJ, Mielke LN, Bashford LL. 1988. Comparison of bulk density beneath a belt track and tire. Biol Syst Eng. 4:122–125.
- Cornell University. 2010. Certified crop advisor study resources (Northeast Region). Cornell University; [accessed 2021 Dec 17]. https://nrcca.cals.cornell.edu/soil/CA2/CA0212.1-3.php.
- Germain RH, Munsell JF. 2005. How much land is needed for the harvest access system on nonindustrial private forestlands dominated by northern hardwoods? North J Appl For. 22(4):243–247. doi:10.1093/njaf/22.4.243.
- Greacen EL, Sands R. 1980. Compaction of forest soils. A review. Aust J Soil Res. 18:163–189. doi:10.1071/SR9800163.
- Grossman RB, Reinsch TG. 2002. The solid phase. In: Al-Amoodi L, editor. Methods of soil analysis part 4 physical methods. Madison (Wisconsin): Soil Science Society of America, Inc; p. 201–414.
- Hatchell GE, Ralston CW, Foil RR. 1970. Soil disturbances in logging: effects on soil characteristics and growth of loblolly pine in the Atlantic Coastal Plain. J For. 68(12):772–775.
- Horn R, Domzzał H, Słowińska-Jurkiewicz A, van Ouwerkerk C. 1995. Soil compaction processes and their effects on the structure of arable soils and the environment. Soil Tillage Res. 35(1–2):23–36. doi:10.1016/0167-1987(95)00479-C.
- Jansson K-J, Johansson J. 1998. Soil changes after traffic with a tracked and a wheeled forest machine: a case study on a silt loam in Sweden. Forestry. 71:57–66. doi:10.1093/forestry/71.1.57
- Jourgholami M, Majnounian B. 2011. Effects of wheeled cable skidder on rut formation in skid trail - a case study in Hyrcanian forest. J For Res. 22:465–469. doi:10.1007/s11676-011-0112-9
- Kamaruzaman J. 1991. Effect of tracked and rubber-tired logging machines on soil physical properties of the Berkelah Forest Reserve, Malaysia KAMARUZAMANJUSOFF. Pertanika. 14:265–276.
- McDonald TP, Strokes BJ, Aust WM. 1995. Soil physical property changes after skidder traffic with varying tire widths. J For Eng. 6:41–50.
- Meredith MP, Stehman SV. 1992. Repeated measures experiments in forestry: focus on analysis of response curves. Can J For Res. 21:957–965. doi:10.1139/x91-133.
- Miller RE, Colbert SR, Morris LA 2004. Effects of heavy equipment on physical properties of soils and on long-term productivity: a review of literature and current research. Research Triangle Park (N.C.): National Council for Air and Stream Improvement, Inc. Technical Bulletin No. 887. 90.
- Minitab I. 2020. MINITAB. http://www.minitab.com/en-US/products/minitab/
- Naghdi R, Solgi A. 2014. Effects of skidder passes and slope on soil disturbance in two soil water contents. Croat J For Eng. 35:73–80.
- Naghdi R, Solgi A, Zenner EK, Behjou FK. 2018. Soil physical properties degrade further on skid trails in the year following operations. J For Res. 29:93–101. doi:10.1007/s11676-017-0413-8
- Olofsfors. 2021. Eco-Tracks benefit both the forest and those who work in it. Olofsfors; [accessed 2019 Oct 17]. www.olofsfors.com.
- Parkhurst BM, Aust WM, Bolding MC, Barrett, SM, Carter, EA. 2018. Soil response to skidder trafficking and slash application. Int J For Eng. doi:10.1080/14942119.2018.1413844.
- Patric JH. 1976. Soil erosion in the eastern forest. J For. 74:671–676.
- Swift LW. 1984. Gravel and grass surfacing reduces soil loss from mountain roads. For Sci. 30(3):657–670.
- Taylor HM, Brar GS. 1991. Effect of soil compaction on root development. Soil Tillage Res. 19:111–119. doi:10.1016/0167-1987(91)90080-H.
- USDA. 2008. Soil Quality Indicators - Bulk Density. NRCS Soil Quality Indicator Sheets; [accessed 2021 Jun 4]. https://www.nrcs.usda.gov/wps/portal/nrcs/detail/soils/health/assessment/?cid=stelprdb1237387.
- USDA. 2021. Official soil series descriptions. Soil Survey Staff, Natural Resources Conservation Service, United States Department of Agriculture. [accessed 2021 Jun 4].
- Wilde SA, Vogt GK, Iyer JC. 1972. Soil and plant analysis for tree culture. New Delhi (India): Oxford and IBH Publishing Co.
- Zemánek T, Neruda J. 2021. Impact on the operation of a forwarder with the wheeled, tracked-wheel or tracked chassis on the soil surface. Forests. 12:336. doi:10.3390/f12030336