
Abstract
Objective: In sound processors of cochlear implant (CI) users, input sound signals are analysed in multiple frequency channels. The amplitude mapping function (AMF) is the output compression function dictating the conversion from (acoustical) channel output levels to (electrical) current levels used for electrode stimulation. This study focused on the detectability of AMF adjustments by CI users and the effects of detectable AMF adjustments on subjective preference and performance. Design: Just noticeable differences (JNDs) for AMF settings were measured for pre-processed sentences at 60 dB SPL in quiet and noise. Three AMF settings, ranging twice the JND, were used during a take-home trial period of 12 days. Subjective ratings were collected and speech recognition in quiet and noise was measured. Study sample: JND measurements: 17 CI users. Field experiment: 15 CI users. Results: JNDs for AMF settings varied among subjects and were similar in quiet and noise. A steeper AMF in the lower part was advantageous for speech recognition in quiet at soft levels. Subjective ratings showed limited agreement with speech recognition, both in quiet and noise. Conclusions: CI users may benefit from different AMF settings in different listening situations regarding subjective preference and speech perception, especially for speech in quiet.
Loudness growth functions (LGFs) describe the perception of loudness as a function of stimulation level. In cochlear implant (CI) users, loudness perception is influenced by both subject-independent factors (e.g. processing parameters and stimulation parameters) and subject-dependent factors (e.g. the number and state of surviving neurons that are stimulated by the electrodes, location of surgical placement of electrode array). The subject-dependent factors may underlie part of the variability of LGFs that is observed among CI users and, for some CI users, among electrodes (e.g. Chua et al, Citation2011; Hoth, Citation2007; Hoth & Müller-Deile, Citation2009). This variability suggests that loudness perception differs among CI users, between the ears of bilateral and bimodal listeners,Footnote1 and/or even among electrodes on the same array within implanted ears. Loudness perception may affect user satisfaction and performance. In addition, a difference in loudness perception between ears may affect binaural performance such as localization. Several processing parameters in the fitting software of CI systems influence the loudness perception of sounds. One of these is the amplitude mapping function (AMF). The AMF is the output compression function that dictates the conversion from the channel output levels to the current levels used for stimulation. Several studies have addressed the effects of AMF adjustments on speech recognition (e.g. Fu & Shannon, Citation1998, Citation2000; Willeboer, Citation2008; Zeng & Galvin, Citation1999). However, those studies investigated the effects of AMF adjustments on performance rather than on subjective preference, and they used fixed AMF adjustments and thus did not relate those adjustments to the sensitivity of the CI users to AMF adjustments.
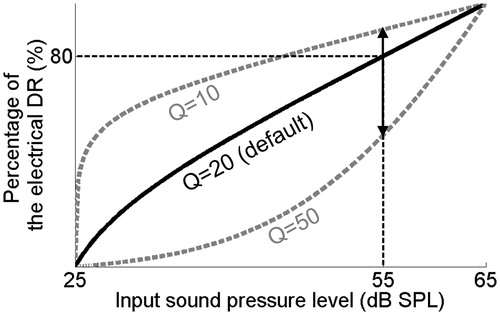
CI systems analyse input sound signals in multiple frequency channels that correspond to electrodes on the electrode array that is implanted in the cochlea. In the case of the commonly used advanced combination encoder (ACE™) processing strategy, during each analysis cycle, a subset of the electrodes is selected for sequential stimulation. This stimulation is restricted to the dynamic ranges (DRs) of the individual electrodes as set by the clinician during the fitting session. The DR of each electrode is defined as the electrical current range between ‘just audible’ and ‘loud but acceptable’ levels.Footnote2 In general, the electrical DR of the electrodes is much smaller than the acoustical DR of normal-hearing (NH) listeners, both in terms of dB and in terms of the number of discriminable loudness levels (Nelson et al, Citation1996). This results from bypassing the nonlinear processing that normally occurs in the cochlea. The small electrical DR of the electrodes is used as efficiently as possible by processing only the acoustical information within a (compressed) acoustical window of 40 dB to 80 dB (depending on manufacturer, clinician choice and processor model). This acoustical window is called the instantaneous input DR (IIDR).Footnote3 After processing including the selection of the frequency channels for stimulation, instantaneous compression is used to map the (acoustical) channel output levels to (electrical) current levels within the DRs of the electrodes. This output compression is dictated by the AMF. The sound processors of different manufacturers differ with respect to the parameter(s) and freedom with which the AMF can be adjusted in the fitting software, but similar principles hold. For example, in Cochlear™ Nucleus® devices, for a fixed IIDR the AMF can be adjusted by changing the Q-parameter setting. This Q parameter defines the percentage of the electrical DR to which the top 10 dB of the IIDR is mapped (). The default Q-parameter setting is 20, and the parameter can be changed in the fitting software to a value between 10 and 50.
Figure 1. Schematic representation of the default AMF in Nucleus devices. The Q-parameter setting defines the percentage of the electrical DR to which the top 10 dB of the IIDR is mapped. The minimum, maximum and default settings in the fitting software equal 10, 50, and 20, respectively. The upward and downward pointing arrows indicate maximum adjustments of the Q-parameter setting in the fitting software. These adjustments result in the AMFs shown with dotted lines in gray.
Several studies have addressed the effects of the AMF on speech recognition. Willeboer (Citation2008) studied the effects of the Q-parameter setting on phoneme recognition in quiet between 40 dB SPL and 70 dB SPL for 25 CI users using the ACE processing. According to their results, an increase of the Q-parameter setting to 30 did not have a significant effect on phoneme recognition. However, a decrease of the Q-parameter setting from 20 to 10 significantly increased the phoneme recognition at the group level. The effect sizes were 18 and 8 percentage points for speech levels of 40 dB SPL and 50 dB SPL, respectively. Willeboer explained the positive effect of a reduced Q-parameter setting as caused by an improvement in audibility at low speech levels. Zeng and Galvin (Citation1999) investigated the effects of increasing the Q-parameter setting to a value between 20 and 50 on phoneme recognition in quiet and noise with four CI users using the spectral peak (i.e. SPEAK) processing strategy. The amplitude mapping manipulations did not significantly affect phoneme recognition, but the results suggested that the effect of signal-to-noise ratio (SNR) on speech recognition (i.e. the intelligibility function) depended on the AMF setting. In 1998 and 2000, Fu and Shannon studied the effects of amplitude mapping on phoneme recognition in quiet with three CI users. According to those studies, the effects of amplitude mapping on speech recognition were mild, which is consistent with the results of Willeboer and Zeng and Galvin. Fu and Shannon commented that the CI users performed best at comfortable levels with maps that restored normal loudness growth.
Speech recognition is the outcome measure that is mainly focused on when fitting CI users. In contrast to outcome measures reflecting performance, outcome measures reflecting subjective preference (e.g. based on sound quality) in relation to AMF adjustments have received relatively little attention in the literature. For individual CI users, fine-tuning of the AMF settings based on subjective outcome measures may result in preferred maps. Such a fine-tuning strategy would be feasible only if CI users show a preference for AMF settings (within the clinically accessible range), if this preference differs among CI users, and if the fine-tuning strategy does not significantly (or only mildly) compromise performance (i.e. speech recognition).
With respect to speech recognition, the literature discussed above suggests that the effects of AMF adjustments are mild. With respect to user preference, different CI users may perceive the same AMF setting differently and/or may differ in their sensitivity to AMF adjustments, because subject-specific factors influence their perception of loudness. CI users may prefer different AMF settings because of differences in the perceptual effects of the AMF adjustments as well as user preferences that are not related to the detectability of the AMF adjustments.
In the present study, we focused on the feasibility of a fine-tuning strategy for AMF settings based on subjective preference by investigating the effects of AMF adjustments on subjective ratings and speech recognition. The study was designed to minimize the influence of differences in the detectability of the AMF adjustments among subjects. Therefore, we separately addressed the sensitivity of CI users to AMF adjustments (part I) and the effects of detectable AMF adjustments on both subjective preference and speech recognition (part II).
Part I of the study answers the following research question: Does the sensitivity to adjustments of the AMF differ among CI users? To answer this research question, the just noticeable difference (JND) of CI users for AMF adjustments was measured. As a model, the Q parameter in Nucleus devices was used, but the results can be generalized for applicability in other devices as well. Besides providing the answer to the above research question, which we hypothesize to be affirmative, the results of the JND measurements translate the freedom of adjusting the AMF in the fitting software to the perceptual consequences of such adjustments. This information indicates the perceptual relevance of the clinically accessible range of AMF settings.
Part II addresses the following research questions: Do CI users show a preference for AMF settings within the clinically accessible range and under different listening situations? Do CI users differ in their subjective preference? How does this subjective preference relate to performance? To answer these research questions, a field experiment was performed in which the participating CI users compared three maps with different AMF settings in their daily lives. To minimize the effect of differences in the discriminability of the AMF settings among the subjects, the settings were based on the subject-specific JNDs for AMF adjustments around the default setting. This ensured that the AMF settings used during the take-home trial period were discriminable for each CI user and may be assumed to correspond with a comparable perceptual range for all CI users. More specifically, one of the AMF settings used by the subjects was the default setting that was used by all subjects in their clinical map for at least one year prior to the experiment. The other two settings were higher and lower than this default setting. The difference between the lowest and highest settings equaled twice the subject-specific JND. After the take-home trial period, the maps were evaluated under different listening situations by asking for subjective ratings on a visual analogue scale (VAS) and by measuring speech recognition in quiet and noise. We hypothesize that CI users differ in their subjective preference, even in the present design in which the perceptual differences among the AMF settings were comparable for all subjects.
Part I: Sensitivity of CI users to AMF differences
Materials and methods
Subjects
Seventeen postlingually deafened adult CI users participated in the study. Their participation was on a voluntary basis and the experimental protocol was in agreement with the requirements of the Medical Ethical Committee at the Academic Medical Center Amsterdam. All subjects had used their CI for at least one year before participating to the study. They were all implanted unilaterally with a Nucleus CI24RE, CI422 or CI512 array and used the Cochlear Nucleus CP810 or Nucleus CP900 series sound processor. Five subjects were bimodal listeners. The subject characteristics are shown in .
Table 1. Characteristics of the 17 CI users that participated in the study.
Stimuli
The stimuli were sentences from the Dutch matrix speech material (Houben et al, Citation2014). To obtain controlled but realistic stimuli that only differed with respect to the Q-parameter setting that defined the AMF, we pre-processed the sentences using the Nucleus Matlab Toolbox (NMT) provided by Cochlear. The pre-processing was performed as follows:
Six sentences were selected from the Dutch matrix speech material based on previous measurements with this speech material in CI users (Theelen-van den Hoek et al, Citation2014). Three of these sentences were selected on the basis of comparable recognition in quiet, while the other three sentences were selected on the basis of equal intelligibility in noise.
For each subject, a research map was programmed in a research sound processor of the same type as used by the subject. This subject-specific research map was identical to the map most frequently used by the subject in daily life with two exceptions:
For all electrodes, the T-levels (i.e. threshold levels) and C-levels (i.e. loud but acceptable levels) were set at 10 CU and 210 CU, respectively.Footnote4,Footnote5
In the case of the CP810 sound processor the ‘Everyday’ hearing environment was selectedFootnote6 with both adaptive dynamic range optimization (ADRO™) and Autosensitivity Control (ASC) enabled. In the case of the CP900 series sound processor, the ‘standard’ microphone directionality was selected, ADRO and ASC were enabled, and the SCAN function and SNR-NR and WNR noise reduction functions were disabled.
The research sound processor was placed on a B&K Head and Torso Simulator (HATS Type 4128C) in a double-walled soundproof booth with the coil attached to radio-frequency (RF) capturing equipment. For each subject-specific research map, the RF signals sent by the sound processor were recorded while presenting the six selected sentences from the front at a fixed speech RMS level of 60 dB SPL. The three sentences, selected on the basis of equal intelligibility in noise, were presented in the presence of noise at a fixed SNR of +5 dB. The noise had the average power spectrum that was equal to that of the Dutch matrix speech material and was presented from the front. During all RF recordings the IIDR equaled 40 dB, and ranged between 25 dB SPL and 65 dB SPL.
For each of the subject-specific research maps and for each of the six sentences, the captured RF signals were converted into stimulation patterns. The stimulation levels in these stimulation patterns were then converted into channel output levels according to the AMF, corresponding to the default Q-parameter setting of 20 in combination with the T-levels and C-levels of the research map (10 CU and 210 CU, respectively). This backward processing step resulted in channel output levels that reflected all the processing effects occurring in daily life, except the effects of the T-levels, C-levels, and the AMF.
During the JND measurements, an adaptive procedure dictated the sentence and Q-parameter setting required for each trial (see below). Prior to each trial, the AMF corresponding to this Q-parameter setting was used in combination with the subject-specific T-levels and C-levels to convert the channel output levels of the required sentence into the current levels used for stimulation. The subject-specific T-levels and C-levels used for this conversion were taken from the map that was most frequently used by the subject in daily life.
During the adaptive JND procedure, all stimuli were presented to the subjects using custom software written in Matlab (MathWorks Inc., Natick, MA, USA) in combination with the Nucleus Implant Communicator (NICTM) research tools package provided by Cochlear.
Data collection: JND measurements
We measured JNDs for the Q-parameter setting around the default setting of 20 using an adaptive procedure. Three repeated measurements were conducted with pre-processed sentences in quiet as well as in noise. We balanced the order of test conditions (quiet or noise) across subjects.
A 4-interval, 2-alternative forced choice set-up was used. The sentences presented during the four intervals of each trial were based on the RF capturing for the same sentence and thus were semantically identical. During presentation, the written sentence was displayed on a touch screen in front of the subject. One of the four sentences was processed with a different Q-parameter setting. This deviant sentence was processed randomly with a higher or lower Q-parameter setting than the other three sentences. The second or third interval was randomly selected to contain the deviant sentence. The task of the subject was to select the second or third interval on the touch screen as being different from the other intervals.
A 1up–1down paradigm was used until the second reversal marked by a wrong answer. This ensured that the area of interest was reached after a limited number of trials. The subsequent six reversals were measured using a 1up–3down paradigm.Footnote7 This paradigm targeted the 79.4% correct point on the performance intensity curve (Levitt, Citation1971). In quiet and noise, the JND measurements were made with three different sentences. The sentences were varied across the trials semi-randomly to ensure that three successive correct answers were always given for the three different sentences used in that test condition. Per measurement, the JND was defined as the average of the last six reversal points. For each subject, the JNDs obtained during the three repeated measurements in quiet and noise were averaged to obtain one JND value in quiet and one JND value in noise.
Data collection: speech recognition in quiet
The phoneme scores for CVC words in quiet were measured twice (test and retest) at 50 dB SPL, and 60 dB SPL, preceded by one measurement for training at 60 dB SPL. These test levels were chosen because the AMF adjustments were expected to have most effect for somewhat lower speech levels and because it could potentially reduce any possible ceiling effects. Testing was performed in a double-walled soundproof booth with the subjects seated 1 m in front of a Yamaha MSP5 Studio loudspeaker. The retest measurements were made in reverse order from the test measurements. During speech recognition testing, the subjects used the map with which the JND measurements were conducted. The bimodal listeners were not allowed to use their hearing aid. Although unaided speech perception was very unlikely, an earplug was used in the non-implanted ear of all subjects with hearing thresholds in the non-implanted better than 120 dB HL.
Data analysis
Mixed model analysis available in the SPSS Statistics 22 software was used to test for any significant effect of the variables ‘test condition’ (sentences recorded in quiet or in noise) and ‘measurement number’ on the JND outcome. The variables ‘test condition’ and ‘measurement number’ were included as repeated variables using the autoregressive covariance structure (AR(1), Littell et al, Citation2004). The choice for this covariance structure was based on the strategy to optimize the model by minimizing the Akaike’s information criterion (AIC). The variable ‘subject number’ was included as a random factor. A significance level of 5% was used.
To test whether the task was similar across the six different sentences used for the JND measurements, we calculated the percentage of trials answered correctly per sentence and per subject. Mixed model analysis was used to test for any significant effect of the variable ‘sentence’ on the percentage of correctly answered trials. The variable ‘sentence’ was assigned as a repeated variable using the AR(1) covariance structure. A significance level of 5% was used.
Results
Learning effects
On average, JNDs for the Q parameter for the first, second, and third repeated measurements equaled 7.4, 6.7, and 6.4 for pre-processed sentences in quiet and 7.8, 6.9, and 5.9 for pre-processed sentences in noise, respectively.Footnote8 Two-sided paired t-tests between the first and the second and between the second and the third measurements were conducted, thereby accounting for the test condition that was started with. These tests indicated no significant differences between the repeated measurements (p = 0.56 and p = 0.92 in quiet and p = 0.22 and p = 0.09 in noise, respectively). Also, mixed model analysis indicated that the variable ‘measurement number’ had no significant effect on JNDs (F2,52 = 2.4, p = 0.11). This indicates that, at the group level, there were no significant learning effects present in the dataset.
Effects of test condition on JNDs
For each of the subjects, we calculated the mean JND in quiet and noise in terms of differences in the Q-parameter setting (). For 11 of the 17 subjects the mean JND in noise was smaller than that in quiet. However, the mixed model analysis indicated that, at the group level, JNDs were not significantly different in noise than in quiet (F1,23 = 0.04, p = 0.84). The JND values in quiet and noise were significantly correlated (r = 0.83, p < 0.01).
Figure 2. Subject-specific average JNDs as measured at a fixed speech level of 60 dB SPL in noise at a signal-to-noise level of +5 dB (y-axis) and in quiet (x-axis). JNDs are represented in terms of differences in the Q-parameter setting. The error bars represent the standard deviation of repeated measurements. Dotted line: x = y.
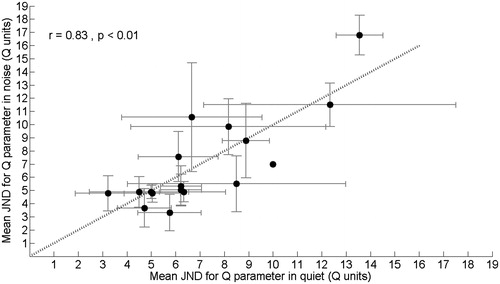
Averaged across the subjects, the mean JND for the Q parameter was 7.1 in quiet and 7.0 in noise, with corresponding inter-subject standard deviations of 2.8 and 3.5, respectively.
We estimated the difference in stimulation patterns corresponding with these mean JNDs for the Q-parameter setting in quiet and noise. For this purpose, we used the pre-processed sentences obtained for a typical research map in the CP810 sound processor. For the three sentences in quiet, the mean differences in the stimulation level of all non-zero pulses between the stimulation patterns obtained with the Q-parameter settings of 16 and 24 were 15.7, 14.5, and 13.4 percentage points of the DR. For the sentences in noise, the mean differences in the stimulation level between the stimulation patterns obtained with the Q-parameter settings of 16 and 24 equaled 12.0, 12.0, and 11.0 percentage points of the DR.
Equivalence of task difficulty among sentences
JNDs were measured in quiet and noise using three different sentences. For each of these six sentences, we calculated the mean percentage of trials answered correctly during the JND measurements across the subjects. These mean percentages ranged between 65 and 78, with a mean value of 73% and a standard deviation of 4.7%. Mixed model analysis indicated that the variable ‘sentence’ had a significant effect on the percentage of correctly answered trials. According to Bonferroni corrected pairwise comparisons, the trials for one of the three sentences used for the measurements in noise were answered correctly significantly less often than the trials for both the other two sentences in noise (p = 0.01 and p < 0.01). Compared to each other, the percentages correctly answered trials for the three sentences used for the measurements in quiet did not differ significantly.
Speech recognition versus JNDs
Averaged across the 17 subjects, the mean phoneme scores equaled 72% and 82% for CVC words in quiet at 50 and 60 dB SPL with corresponding standard deviations of 15% and 12%, respectively. There was no significant correlation between the JND values and the phoneme scores for CVC words in quiet (r = 0.20 and r = 0.12 with p = 0.45 and p = 0.65 for 50 dB SPL and 60 dB SPL, respectively) and in noise (r = 0.36 and r = 0.23 with p = 0.16 and p = 0.37 for 50 dB SPL and 60 dB SPL, respectively).
Part II: The effects of AMF adjustments on subjective preference and speech recognition
Materials and methods
Design of the take-home trial period
During the take-home trial period, the subjects used a loaner sound processor with three programs during 12 consecutive days in their daily lives. The maps programmed in the loaner sound processor were identical to the subject-specific maps used during part I of the study and differed only with respect to the Q-parameter setting. The Q-parameter setting of one of the research maps was the default setting. We refer to this map as Q20. The other maps were programmed with a lower and a higher Q-parameter setting than the default. We refer to these maps as Qlow and Qhigh, respectively. Within subjects and in terms of Q units, the differences between the lowest and highest Q-parameter settings relative to the default Q-parameter setting were equal. The difference between the Q settings in the Qlow and Qhigh maps was subject-dependent and equaled twice the largest JND in quiet and noise measured for that subject during Part I of the study. By using a difference of twice the largest JND, we increased the probability that the Qlow and Qhigh maps were distinguishable from the Q20 map. Because the fitting software does not allow Q-parameter settings below 10, our design of the field study only allows subjects with a mean JND of 10 or smaller. Therefore, subject S28 and S37 were excluded for Part II of this study.Footnote9
The three research maps were randomly assigned to the program positions in the loaner sound processor and the subjects were blind to this randomization. Directly after programming the research maps in the loaner sound processor, the subjects were asked if the maps were distinguishable. Also we asked for a subjective overall rating on a VAS for each of the programs.Footnote10 The subjects could base their overall ratings on a short conversation with the researcher and listening to input sound signals including moving papers on a desk and hand clapping.
The subjects were instructed to use all three programs twice on two subsequent days during the trial period. The design of the trial was the same for the first six-day period and the second six-day period. For example, program 1 was used on the first, second, seventh, and eighth days of the trial period. The subjects were given a diary that dictated which program should be used on each day and were encouraged to use only the appropriate research program throughout the day. The bimodal listeners were instructed not to change the settings of their hearing aid at any point during the study.
At the end of each day, the subjects documented the program that was used, the duration of use, whether they felt their hearing was compromised for any reason that day, and how they would rate the program in general on a VAS. During the second and fourth day that a particular program was used, the subjects also gave ratings on a VAS for three specific listening situations. These were ‘having a conversation in quiet surroundings,’ ‘having a conversation in noisy surroundings,’ and ‘listening to music.’ The data collection during the trial period ensured that the subjects experienced the research maps in different listening environments. Because the data was not collected in a controlled manner, they were only used to acquire insight into the effect on subjective ratings of the subjects’ experience with a particular Q-parameter setting (see Discussion).
Evaluation of the trial period: subjective VAS ratings
After the trial period, the subjects returned to the clinic. During this visit, the take-home experience was discussed and three repeated VAS ratings, in three sound environments, were collected in a laboratory setting for each of the three research maps. In addition, the subjects were asked for an overall VAS rating for each of the programs similarly as during the first visit. While giving the VAS ratings, the subjects were blind to the research map with which they listened, as explained below.
The sound environments were created in a double-walled sound-proof booth using videos from the Amplifit2 interactive multimedia system (www.amplifon.com). The sound environments represented ‘speech in quiet’ (fragment number 85), ‘speech in noise’ (fragment number 19), and ‘tango music’ (fragment number 101). The videos were presented on a screen in front of the subject. The sound was presented from four Boston Acoustics digital BA7500 loudspeakers at 45°, 135°, −45°, and −135° azimuth surrounding the subject. The sound levels were approximately 65 dB(A) for the speech environments and approximately 70–75 dB(A) for the music environment.
For the purpose of familiarization, the subjects listened to (and watched) the complete video representing each sound environment with all research maps prior to the collection of the subjective VAS ratings. Switching between the research maps was performed by the researcher, using either a remote control or the live mode option in the Nucleus Custom Sound® fitting software. For the actual data collection, the subjects watched the video nine times. After each time, the subject rated how comfortable it was to watch the video with the active program on the VAS. The researcher then switched programs, after which the video was re-played. The sequence of switching between the programs was designed to provide VAS ratings in threefold for each map for different sequences of switching between programs. The sequence of the three sound environments was balanced across the subjects according to a Latin square design.
Evaluation of the trial period: speech recognition testing
We measured the phoneme scores for CVC words in a double-walled soundproof booth to assess speech recognition in quiet when using all three research maps. These measurements were done during the same visit as the subjective evaluation of the trial period as described above. After one measurement for training, for each map, the percentage of phonemes that were repeated correctly was measured in threefold at 50 dB SPL. During the testing, the subjects were seated 1 m in front of a Yamaha MSP5 Studio loudspeaker. The subjects were blind to the research map that was activated by the researcher. After these measurements, ADRO and ASC were disabled in the research maps and speech recognition testing in quiet was repeated as described above with a fixed sensitivity setting of 12. This sensitivity setting corresponds to an IIDR of 40 dB that ranges between 25 and 65 dB SPL. The purpose and results of these measurements with ADRO and ASC disabled will be elaborated in the Discussion section.
During a third visit, we used the Dutch matrix test to assess speech recognition in noise for each of the three research maps. This speech test uses 50 unique words that are combined into lists of syntactically equivalent but semantically different sentences (Houben et al, Citation2014). The measurements were made in the free field in a double-walled soundproof booth with the subjects seated 1 m in front of a Yamaha MSP5 studio loudspeaker from which the speech and noise were presented (audio sample rate 44.1 kHz, audio sample size 16 bit). Testing was performed using a Dell laptop (Latitude E6500) with an onboard sound card (Intel High Definition Audio HDMI service) using the Oldenburg Measurement Applications software package developed by HörTech GmbH Oldenburg. The signal was amplified by means of an Interacoustics AC-40 clinical audiometer to meet the technical requirements of the software package. All measurements were made with lists comprising ten sentences that were previously evaluated in CI users (Theelen-van den Hoek et al, Citation2014). After each sentence, the subjects spoke aloud the words they had heard from a word matrix that was given to them (closed set configuration). The subjects were instructed to guess if they were unsure. Speech testing in noise was conducted at a fixed speech level of 60 dB SPL,Footnote11 using continuous noise with the average power spectrum equal to that of the Dutch matrix speech material. For each measurement, the adaptive procedure described by Brand and Kollmeier was used (Brand, Citation2000, Brand & Kollmeier, Citation2002). This procedure targets the 50% word correct point, also known as the speech reception threshold (SRT). The SRT of each measurement was calculated by fitting the data to a logistic function (Brand & Kollmeier, Citation2002) that accounted for the probability of correctly guessing a word by pure chance (10%). The data was fitted to the model using the maximum-likelihood method as described by Brand and Kollmeier (Citation2002).
Eleven SRT measurements were conducted per subject using the research maps that were used during the take-home trial period. The first two measurements were used to mitigate any learning effects. These training data were discarded. The subsequent nine measurements were divided into three sets of three SRT measurements. Each set of three SRT measurements was conducted with one of the three research maps. Again, the subjects were blind to the research map that was activated by the researcher. Like in the CVC measurements, after these SRT measurements, ADRO and ASC were disabled and the SRT measurements were repeated.
Data analysis
As shown in , the dataset that was obtained using the research maps consisted of:
3 VAS ratings per Q-setting for each of the three sound environments (quiet, noise and music) with ADRO and ASC enabled
3 CVC scores at 50 dB SPL per Q-setting, with ADRO and ASC enabled
3 SRTs in noise (dB SNR) per Q-setting, with ADRO and ASC enabled
3 CVC scores at 50 dB per Q-setting with ADRO and ASC disabled
3 SRTs in noise per Q-setting with ADRO and ASC disabled.
Two mixed model analyses were performed to determine whether subjective preference based on VAS ratings were significantly related to speech recognition in quiet or noise and thus would have a predictive value for performance. The dependent variables in these mixed model analyses were the percentage phoneme scores converted to rau scores and SRT values obtained with ADRO and ASC enabled ().
Table 2. Summary of the data collected after the trial period as used for analysis.
The first mixed model analysis was performed to test for any significant relation between a variable that represented the ranking of the map according to the VAS ratings for the sound environment ‘speech in quiet’ and the phoneme score in quiet. This ranking variable equaled 1 (highest VAS rating), 2, or 3 (lowest VAS rating). The ranking variable and measurement number (three repeated measurements) were included as repeated variables using the AR(1) covariance structure, based on the criterion of minimizing the AIC. The subject number was included as a random factor. A significance level of 5% was used. Bonferroni corrected pairwise comparisons were used to assess the differences in speech recognition in quiet between the three differently ranked AMF settings.
The second mixed model analysis was performed similarly, but investigated if a ranking variable based on the VAS ratings for the sound environment ‘speech in noise’ was significantly related to the speech recognition scores in noise (SRT values).
In total, the two mixed model analyses include six Bonferroni corrected pairwise comparisons. Therefore, the power analysis that was performed for this study was based on six two-sided paired t-tests with an overall alpha of 0.05. We corrected for multiple testing using the Bonferroni correction, resulting in an alpha of 0.0083 (0.05/6). The inter-subject standard deviations used in the power analysis were based on pilot measurements in a sample of eight CI users with the same inclusion criteria as this study and equaled 9.6% for the phoneme scores in quiet and 1.68 dB SNR for the SRTs in noise. The power analysis indicated that a sample size of 15 and an alpha of 0.0083 would have an 80% power to detect a difference in mean phoneme score of 10% or a difference in the mean SRT in noise of 1.75 dB SNR between the differently ranked AMF settings.
Additional mixed model analyses were performed to assess secondary research questions regarding group effects. Two of these were mixed model analyses similar as described above. These focused on a possible effect of a reduction or increase of the Q-parameter setting on speech recognition in quiet and noise, and used the Q-parameter setting (Qlow, Q20, Qhigh) as the predictive factor rather than the ranking variable. The final four mixed model analyses were repetitions of the above analyses, but explored possible effects of the subjective rankings and Q-parameter settings on speech recognition in quiet and noise for the condition in which ADRO and ASC were disabled.
Results
Subjective VAS ratings for different sound environments
After the take-home trial period, three repeated VAS ratings were collected in the laboratory for sound environments representing ‘speech in quiet,’ ‘speech in noise,’ and ‘tango music.’ shows the mean VAS ratings per subject for the three Q-parameter settings for these sound environments. The error bars represent the mean of the standard deviations of repeated measurements per sound environment.
Figure 3. The mean VAS ratings for individual subjects when listening to speech in quiet (upper panel), speech in noise (middle panel) and tango music (lower panel) with different Q-parameter settings. The error bars represent the mean of the standard deviations for the repeated measurements per subject, listening situation and Q-parameter setting.
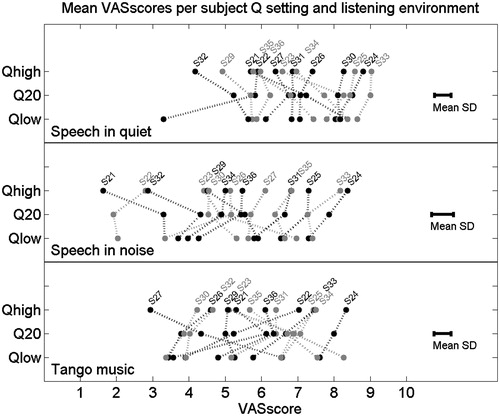
In general, some subjects used higher subjective VAS scores than others to reflect their opinion about listening with the research maps in the different sound environments (e.g. subject S32 used relatively low VAS scores, whereas subjects S24 and S33 used relatively high VAS scores). The ranking of the research maps according to the VAS scores differed among the subjects within listening environments. The subjects differed in consistency among the rankings of the research maps across all three sound environments. For example, S24 was consistent across all three listening environments, while S27 rated the maps differently for listening to speech relative to listening to tango music. For some subjects, the differences in VAS ratings for the three Q-parameter settings within the listening environments were small (e.g. S25, and S30), while others showed a clear positive or negative opinion about one of the Q-parameter settings in one or two specific listening environments (e.g. S21 and S27 for tango music, and S22 for speech in quiet and tango music). The default Q-parameter setting (Q20), with which the subjects had the most listening experience, was not always the Q-parameter setting that received the highest rating in the different listening environments. Taken together, these results indicate that CI users differ in their subjective ratings of Q-parameter settings that are perceptually equally distinct from each other and that these subjective ratings depend on the listening situation for some CI users.
Effects of AMF adjustments on phoneme scores
According to the mixed model analysis, the measurement number did not have a significant effect on the phoneme scores (F1,87 = 0.04, p = 0.96). Also, the phoneme scores at 50 dB SPL were not significantly different at the group level between the Q-parameter settings that received a different subjective ranking according to the VAS ratings for the sound environment ‘speech in quiet’ (F2,47 = 1.1, p = 0.34). In line with these results, no significant correlation was found between the mean subjective VAS rating and the mean phoneme scores at 50 dB SPL (r = 0.01, p = 0.97).
shows box-and-whisker plots for the subject-specific mean phoneme scores at 50 dB SPL for the 15 subjects who participated in the take-home trial. Separate box-and-whisker plots are shown for the different Q-parameter settings.
Figure 4. Box-and-whisker plots for the subject-specific mean phoneme scores at 50 dB in quiet, measured with different Q-parameter settings for the 15 subjects. The gray lines represent the results for individual subjects. The asterisks indicate significant differences (see text for details).
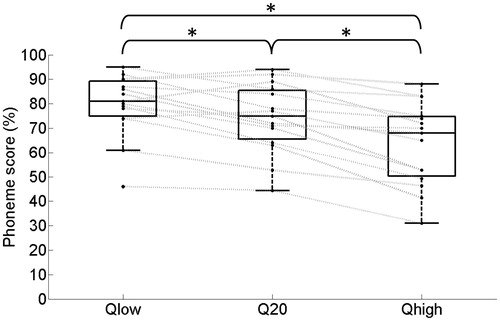
While the mixed model analysis indicated no significant effect of the measurement number on the phoneme scores for CVC words (F2,91 = 0.06, p = 0.94), it did indicate that the Q-parameter setting was significantly related to speech recognition in quiet (F2,54 = 40.7, p < 0.01). According to Bonferroni corrected pairwise comparisons, the phoneme scores indeed increased significantly from Qhigh to Q20 (p < 0.01) and from Q20 to Qlow (p < 0.01). The effect size for a lower Q-parameter setting relative to the default Q-parameter setting was approximately 6 percentage points.
Effects of AMF adjustments on speech recognition in noise
Mixed model analysis for speech recognition in noise indicated that the subject-specific ranking derived from the VAS ratings in noise were not significantly related to performance in noise (F2,50 = 2.5, p = 0.09). The mixed model analysis indicated that the main effect of the variable ‘measurement number’ was significant (F2,86 = 6.9, p < 0.01). Bonferroni corrected pairwise comparisons indicated that speech recognition was significantly worse during the second measurement relative to the first and third measurements. We found a weak but significant correlation between the mean subjective VAS ratings for listening to speech in noise and the mean SRTs in noise (r = −0.31, p = 0.04).
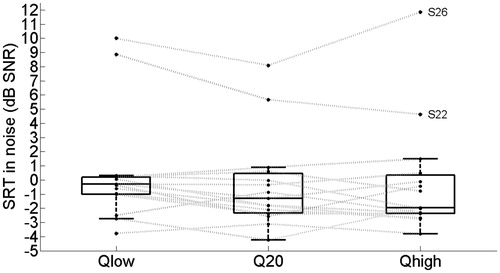
shows box-and-whisker plots for the subject-specific mean SRT values in noise for the 15 subjects. Separate box-and-whisker plots are shown for the different Q-parameter settings. Mixed model analysis indicated that the Q-parameter setting did not significantly influence the SRT at the group level (F2,57 = 3.0, p = 0.06).
Figure 5. Box-and-whisker plots for the subject-specific mean SRT values in noise, measured with different Q-parameter settings for the 15 subjects. The gray lines represent the results for individual subjects (see text for details).
Discussion
Part I. Sensitivity of CI users to AMF differences
For the majority of the subjects, the mean JND for AMF differences was well within the range of AMF adjustments provided in the fitting software that was used. These results indicate that adjusting the AMF (by means of the Q parameter) in clinical practice can indeed lead to subjectively different maps. As hypothesized, the sensitivity of CI users to the differences in the AMF settings varied among subjects.
In this study the sensitivity to AMF adjustments was measured using pre-processed sentences that were directly streamed to the subject’s implant. The pre-processing involved the recording of RF signals sent by a research sound processor in response to sentences (60 dB SPL) in quiet and noise (+5 dB SNR), backward processing of these captured RF signals to obtain channel output levels, and forward processing using the appropriate AMF required by the measurement procedure. The resulting stimulation patterns were streamed to the subjects’ implants during the measurements. This pre-processing strategy provided three advantages. First, it ensured that the only discriminable factor between the sentences was the AMF, because per sentence, the same subject-specific captured RF signal was used for the pre-processing of all tokens during the measurements. Second, it ensured that the measurement conditions were the same among all subjects, because the RF signals were captured using the same set-up and research sound processor. Third, the front-end processing included in the captured RF signals was realistic for daily life, because a real sound processor was used for the RF capturing.
Across subjects, the JND in terms of differences in the Q-parameter setting was not significantly different for sentences in noise relative to sentences in quiet. We also expressed the average JND in quiet and noise in terms of a difference in the stimulation level of the non-zero pulses in percentage points of the DR. On average, the stimulation levels of non-zero pulses had to differ approximately 14.5 percentage points of the DR to distinguish between sentences in quiet, while a difference of approximately 11.7 percentage points of the DR was sufficient to distinguish between sentences in noise. Also, there appeared to be some variation in the cues provided by the different sentences used for the measurements in noise. The 1up–3down paradigm required a good answer for all three sentences before the Q difference was decreased. Therefore, the measured JNDs are not based on single sentences, and thus more representative for speech in general.
The effect on the AMF of increasing or decreasing the Q-parameter setting is not symmetrical around the default Q-parameter setting. Therefore, positive and negative deviations from the default may not be equally discriminable. Still, the JNDs for differences in the Q-parameter setting were measured around the default setting rather than separately for positive and negative deviations from the default setting. This saved measurement time and enabled us to repeat the JND measurements during a single session to assess the variability in the measurements and obtain a more reliable JND. To increase the probability that the subjects could distinguish the maps with the lowest and highest Q-parameter settings from the default, the range of the Q-parameter settings within the subjects equaled twice the largest subject-specific JND measured in quiet and in noise. Immediately after programming the loaner sound processor, all subjects indicated that they heard the difference between all three Q-parameter settings. Also, the VAS scores do not suggest that the perceptual difference between the default Q setting and the higher and lower Q settings was asymmetrical. Thus, the results do not suggest that the JNDs reflect only the positive or negative adjustments and we hypothesize that the theoretically asymmetrical effect of increasing and decreasing the Q-parameter setting relative to the default in practice was limited.
The AMF may affect both the overall loudness of a stimulus as well as the loudness variation of amplitude-modulated components within a dynamic signal such as speech. Both cues could be used to detect AMF differences in the present study. The accessibility of both cues might be related to the ability of CI users to detect increments in the constant intensity of biphasic electrical pulse trains and/or to detect (differences in) the amplitude modulation of biphasic electrical pulse trains. The literature regarding JNDs for differences in the intensity of constant-amplitude pulse trains shows a general trend that JNDs for intensity (in terms of Weber fractions) decrease with increasing stimulation levels (e.g. Gallégo & Micheyl, Citation1998; Galvin & Fu, Citation2009; Kreft et al, Citation2004; Nelson et al, Citation1996). Similarly, detection thresholds for amplitude modulation of pulse trains tend to improve with the level across DR (Galvin & Fu, Citation2005; Pfingst et al, Citation2007, Citation2008). In the present study, the average non-zero stimulation level was higher for the sentences in noise (approximately 75%DR) than for the sentences in quiet (approximately 58%DR) when the default AMF programmed in a CP810 sound processor was used for processing. If the ability to detect AMF differences is correlated with the ability to detect static or dynamic increments in the intensity of pulse trains, this higher average stimulation level in the presence of background noise may explain the increased sensitivity to AMF adjustments for the sentences in noise when expressed in terms of a difference in the stimulation level of the non-zero pulses.
Part II. The effects of AMF adjustments on subjective preference and speech recognition
Part II of this study investigated if CI users show a preference for AMF settings under different listening situations, if these subjective preferences differ between CI users and how the subjective preferences relate to performance.
AMF adjustments and overall loudness level of input sound signals
One of the effects of AMF adjustments is a change in the overall loudness level of input sound signals. We did not correct for this effect, in part because a correction of either the presentation levels of the input sound signals or the T-levels and/or C-levels of the electrodes would have introduced a confounding factor to the study. For example, different presentation levels for different AMF settings would have resulted in different effects of other processing parameters (e.g. ADRO) as a confound. Similarly, different T-levels and/or C-levels for different AMF settings would have resulted in different sizes of the DRs of the electrodes as a confound. In contrast to adjustments of T-levels and/or C-levels, AMF adjustments preserve the electrical DRs of the electrodes, the audibility of input sound signals in the lower part of the IDR, and the acceptability of the loudness level of high-level input sound signals. The results of the present study that are discussed below thus comprise all effects of AMF adjustments, including its effect on overall loudness.
Effects of AMF adjustments on subjective VAS ratings
In line with our hypothesis, the subjects differed in their subjective ratings of different Q-parameter settings that correspond with a comparable perceptual range after a take-home trial period of 12 days.
For some CI users, the subjective rating depends on the listening situation, while others like or dislike the same Q-parameter setting across the listening environments tested. The subject-specific Q-parameter settings selected for the take-home trial period represented similar perceptual differences between the research maps across subjects. However, some subjects showed little difference in VAS ratings across the research maps, while others rated one of the maps quite differently from the others.
After the take-home trial period, each subject gave an overall VAS rating for each of the three Q-parameter settings. At the group level this overall VAS rating was not significantly correlated with the Q-parameter setting (r = −0.00, p = 0.99). According to the overall VAS ratings, the lowest, default and highest Q-parameter settings received the highest VAS score from five, four, and six subjects, respectively. Although the overall VAS scores were not obtained in a well-controlled manner, they indicate that the subjects differed greatly in their overall preference for the Q-parameter setting.
Two unilateral listeners (S22 and S25) and one bimodal listener (S24) asked to add a map with the highest Q-parameter setting in their own sound processor. They all commented that the map with the highest Q parameter was more natural and pleasant to listen with. On the other hand, four unilateral listeners (S21, S23, S29, and S35) and one bimodal listener (S26) asked to add a map with the lowest Q-parameter setting in their own sound processor. Four of these subjects preferred the lowest Q-parameter setting in specific listening situations (e.g. listening to the radio or having a conversation with their partner at home) since they felt that speech recognition with this map was better than with both other maps. Explanations given were that speech signals were louder and clearer. The fifth subject preferred the lowest Q-parameter setting because it improved the detectability of sounds. The bimodal listeners were allowed to use their hearing aids during the take-home trial period and while giving their subjective ratings in the clinic. We do not think that the hearing aid use has introduced relevant differences in VAS scores between the unilateral and bimodal listeners, because the residual hearing in the non-implanted ears of the bimodal listeners was limited. Also, we do not expect that the hearing aid use has influenced the outcomes of the study, since we mainly focused on differences between the Q-parameter settings and the hearing aid use was a constant factor within the subjects.
Taken together, the subjective VAS ratings indicate that a take-home trial period of approximately two weeks can result in preferred Q-parameter settings that differ from the default setting, even in the subjects of this study, who had used the default setting for more than a year before the start of the experiment.
Effects of experience on subjective VAS ratings
The overall VAS ratings were collected once in the clinic directly after programming the research sound processor, four times during the take-home trial period, and once in the clinic after the take-home trial period. For nine of the 15 subjects, the ranking of the research maps according to the acute VAS ratings (before the take-home trial period) differed from the ranking according to the final VAS ratings (after the take-home trial period). This study was not designed to quantify the effects of listening experience with different AMF settings on subjective ratings. However, our data do suggest that listening experience, even for two weeks, affected the subjective ratings of AMF settings in the majority of the subjects.
Effects of AMF adjustments on speech recognition
At the group level, the AMF setting was significantly related to performance in quiet. The results indicate that CI users generally benefit from a lower Q-parameter setting with respect to speech recognition in quiet at a soft speech level of 50 dB SPL. This conclusion is consistent with the findings of Willeboer (Citation2008). A lower Q-parameter setting corresponds to an AMF which is steeper in the lower part of the DR and converts the channel output levels to higher percentages of the electrical DR. Therefore, improved audibility is the most likely explanation for these results, as was also suggested by Willeboer. At the group level, the speech recognition in noise was not significantly different between the Q-parameter settings tested. Thus, at the group level a steeper AMF in the lower part was favorable for speech recognition in quiet, but did not have a significant advantage or disadvantage in noise.
Influence of ADRO on the effect of AMF adjustments on speech recognition
In Nucleus devices, ADRO and ASC are two additional, optional sound coding algorithms affecting loudness perception. While the AMF dictates stimulation levels after the selection of frequency channels for stimulation, ADRO and ASC act before this channel selection. ASC shifts the IIDR up in acoustical level if the estimated background noise level exceeds a certain threshold, and shifts the IIDR down when background noise drops below a lower threshold. ADRO analyzes the average and peak envelope levels and the background noise and adjusts the gain of individual frequency channels to maintain a comfortable loudness perception in each channel (Blamey, Citation2005; Khing et al, Citation2013). By adjusting the gain of individual frequency channels, ADRO influences both the selection of the frequency channels for stimulation as well as the stimulation levels with which the selected frequency channels are stimulated. In this study ADRO and ASC were enabled for all subjects, which is the default setting in current Nucleus devices. ADRO may improve the audibility of low input levels by increasing the gains of individual frequency channels. This may have a similar effect as reducing the Q parameter. To assess the influence of ADRO on the observed effect of the AMF adjustments, we have repeated all speech recognition tests after the take-home trial period with ADRO and ASC disabled.Footnote12 These results showed that the average speech recognition in quiet at 50 dB SPL for the lowest Q-parameter setting was 80%, both with ADRO enabled and with ADRO disabled. However, performance in quiet with the default Q-parameter setting and highest Q-parameter setting were worse when ADRO was disabled. Consequently, when ADRO was disabled, the effect size of the AMF adjustments on phoneme perception at 50 dB SPL was larger. More specifically, with ADRO disabled, a just noticeable reduction of the Q-parameter setting resulted in an average improvement in speech recognition in quiet of 12 percentage points. However, none of our conclusions about the effect of AMF adjustments on speech recognition in quiet and noise would have been different if ADRO had been disabled.
Is a fine-tuning strategy for AMF settings based on subjective outcome measures feasible?
The main focus of this study was on the feasibility of a fine-tuning strategy for AMF settings based on subjective outcome measures. The present study evaluated three criteria that are important for the feasibility of such a fine-tuning strategy. The first criterion is that CI users should show a preference for AMF settings within the clinical accessible range. As discussed above, the observed effects of AMF adjustments on subjective VAS ratings indeed confirm that this criterion holds. The second criterion is that CI users should differ with respect to their subjective preference for AMF settings (as otherwise it would suffice to just change the default setting to the setting that all users prefer). The subjective VAS ratings for different AMF settings as collected after a take-home trial period of 12 days also confirm that this second criterion holds. The third criterion is that fine-tuning according to subjective preference should not significantly (or only mildly) compromise speech recognition. We evaluated this third criterion by investigating the relation between the subjective VAS ratings and speech recognition scores for the three different AMF settings as collected after the take-home trial period. In quiet, we found no significant relation between subjective preference for the AMF setting and performance and the absolute subjective ratings and speech recognition scores were not significantly correlated. In noise, we found no significant relation between subjective preference for the AMF setting and performance, and a weak, negative correlation between the absolute subjective ratings and speech recognition scores. The subjects slightly preferred the AMF setting that was best for speech recognition in noise. These results indicate that the third criterion also holds. Moreover, the results indicate that just-audible adjustments of AMF settings may not only affect subjective ratings, but also speech recognition at the group level under specific listening situations. These results suggest that it may be worthwhile to develop fine-tuning strategies that involve AMF adjustments.
Future directions
Different fine-tuning strategies involving AMF adjustments may be worthwhile investigating. For example, the AMF may be adjusted according to the listening situation. More specifically, sound processors may automatically adjust the AMF for optimal performance when listening to speech in quiet. This strategy would focus on performance rather than on subjective preference. Therefore, the potential of this strategy depends on the CI users’ acceptance of listening with AMF settings that may differ from their subjectively most preferred setting and that may vary throughout the day.
In contrast, AMF settings may be adjusted by the CI users themselves, directed by the listening situation and/or subjective preference. This could be performed by programming separate maps with different AMF settings or by giving CI users direct access to (a limited range of) AMF settings, similar to a volume control or sensitivity control. When focusing on self-fitting, it is important to realize that fine-tuning of the AMF setting may require a period of adaptation, since the results of the present study suggest that the subjective preferences may be influenced by experience.
A different fine-tuning strategy involving AMF adjustments may be to adjust the AMF per electrode rather than per electrode-array. In the current sound processors, this option is not (yet) available. Zhou and Pfingst (Citation2014) have shown a positive effect on speech recognition by increasing the threshold levels for the five stimulation sites with the worst modulation detection thresholds instead of deactivating them. It would be interesting to investigate whether electrode-specific adjustments of the AMF, rather than increases in the threshold levels, could provide similar improvements in speech recognition. An advantage would be that AMF adjustments do not reduce the DR of electrodes.
Finally, it may be worthwhile to investigate the feasibility of using AMF adjustments as a tool to improve binaural performance (e.g. localization) in bilateral or bimodal listeners. Bimodal and bilateral CI users show variability in their ability to localize sound sources in the horizontal plane, and in general both have better access to inter-aural level differences (ILDs) than inter-aural timing differences (e.g. Aronoff et al, Citation2010; Francart et al, Citation2011; Grantham et al, Citation2007; Schoen et al, Citation2005; Van Hoesel & Tyler, Citation2003). AMF adjustments may affect loudness growth for input sound signals and thereby the loudness balance between ears across the DR. With respect to bilateral CI users, Goupell et al (Citation2013) showed that bilateral loudness equalization does not necessarily produce a centered auditory image or optimal lateralization. However, they did find a level effect on lateralization abilities. We may speculate that the AMF may provide a tool that influences this level effect and potentially can improve the accessibility of ILD cues. Therefore, it would be interesting to expand the focus of the effects of AMF adjustments to binaural performance and determine the effect size of AMF adjustments on loudness perception of input sound signals and localization abilities.
Conclusions
CI users show variability in sensitivity to differences in AMF settings. Averaged across the subjects the mean JND in terms of differences in the stimulation level of non-zero pulses ranged between 13.4 and 15.7 percentage points for different sentences in quiet and between 11.0 and 12.0 percentage points for different sentences in noise (+5 dB SNR).
A steeper AMF in the lower part of the DR (lower Q-parameter setting) than default resulted in significantly higher phoneme scores in quiet at a soft speech level (50 dB SPL).
In a subset of the subjects, a take-home trial period of 12 days resulted in preferred Q-parameter settings that differed from the setting with which the subjects had listened for more than a year. According to the ratings on a visual analogue scale (VAS), the preference for AMF settings differed among CI users.
Subjective ratings for listening to speech in quiet were not significantly correlated with speech recognition scores in quiet. In noise, subjective ratings were weakly but significantly correlated to speech recognition scores. At the group level, subjective preference did not significantly compromise speech recognition in quiet or noise. Thus, a limited agreement was found between subjective ratings and performance.
The results of this study suggest that it may be worthwhile to develop fine-tuning strategies that involve AMF adjustments, based on subjective outcome measures.
| Abbreviations | ||
| AMF | = | amplitude mapping function |
| CI | = | cochlear implant |
| CU | = | current units |
| DR | = | dynamic range |
| IDR | = | input dynamic range |
| JND | = | just noticeable ifference |
| LGF | = | loudness growth function describing the relation between loudness and stimulation level |
| NH | = | normal hearing |
| RF | = | radio-frequency |
| SRT | = | speech reception threshold |
| ILDs | = | inter-aural level differences |
| VAS | = | visual analogue scale |
Acknowledgements
We would like to thank the subjects for their time and effort. Also, we would like to thank Nan van Geloven for her help with the statistics.
Declaration of interest: Financial support was received from Cochlear™, one of the co-authors (Bas van Dijk) is employed at Cochlear™. The authors declare no conflicts of interest.
Notes
Notes
1. In this paper, we refer to listeners who use two sound processors as bilateral listeners, and to listeners who use a sound processor on one ear and a hearing aid on the other as bimodal listeners.
2. In Cochlear™ Nucleus® devices these levels are referred to as T-levels and C-levels, respectively.
3. In Nucleus devices T-SPL refers to the lower limit of the IIDR that results in stimulation at T-level while C-SPL refers to the acoustical level above which all levels result in stimulation at C-level (i.e. infinite compression). The default T-SPL is 25 dB SPL and the default C-SPL is 65 dB SPL.
4. CU: Current units, the clinical unit for the current used in NucleusTM devices.
5. These low T-levels and high C-levels were used to obtain a large DR for all electrodes. This improved the precision of the conversion of the recorded RF signals (step 3 of the pre-processing procedure) to channel magnitudes (step 4 of the pre-processing procedure) because of a better resolution. Please note that the subject-specific research maps were only used for the pre-processing procedure and not for presenting signals to the subjects.
6. This is one of the available settings available as part of the ‘SmartSound™’ technology provided by Cochlear in the Nucleus CP810 sound processor.
7. This paradigm always started after a wrong answer. In the case of a large deviation from the real JND due to guessing, the correct area of interest was still reached quickly without the cost of a reversal that influenced the JND.
8. For subjects S21, S34, S36 and S37 the third JND measurements in quiet and noise were omitted because of fatigue and/or time constraints. For the same reason only one measurement in quiet and noise was available for subject S22.
9. For subject S33 the mean JNDs in quiet and noise equaled 6.7 and 10.6. This subject is still included in Part II of the study because all of the measured JNDs in quiet and two of the three measured JNDs in noise were smaller than 10. He reported to hear clear differences between the three research programs.
10. The VAS was a horizontal line 10 cm long. The left end of the line was marked with the label ‘very uncomfortable’ and the number 0, while the right end of the line was marked with the label ‘very comfortable’ and the number 10.
11. For subjects S22 and S26, the speech level was raised to 65 dB SPL because the recognition at 60 dB SPL for these subjects was too low for reliable SRT measurements.
12. ASC was disabled together with ADRO since in Nucleus CP810 devices the fitting software does not allow ASC to be enabled without enabling ADRO. When ASC was disabled, we fixed the sensitivity setting to the default (corresponding to an IIDR of 25-65 dB SPL). We verified in the lab that this same IIDR is used by the sound processors when sentences are presented at 60 dB SPL in noise (+5 dB SNR) while ADRO and ASC are enabled.
References
- Aronoff J.M., Yoon Y.S., Freed D.J., Vermiglio A.J., Pal I., et al. 2010. The use of interaural time and level difference cues by bilateral cochlear implant users. J Acoust Soc Am, 127(3), EL87–EL92.
- Blamey P.J. 2005. Adaptive dynamic range optimization (ADRO): A digital amplification strategy for hearing aids and cochlear implants. Trends Amplif, 9, 77–98.
- Brand T. 2000. Analysis and optimization of psychophysical procedures in audiology. Thesis Universität Oldenburg. Chapter 1.
- Brand T. & Kollmeier B. 2002. Efficient adaptive procedures for threshold and concurrent slope estimates for psychophysics and speech intelligibility tests. J Acoust Soc Am, 111(6), 2801–2810.
- Chua T.E.H., Bachman M. & Zeng F. 2011. Intensity coding in electric hearing effect of electrode configuration and stimulation waveforms. Ear Hear, 32(1), 1–11.
- Francart T., Lenssen A. & Wouters J. 2011. Enhancement of interaural level differences improves sound localization in bimodal listeners. J Acoust Soc Am, 130(5), 2817–2826.
- Fu Q.J. & Shannon R.V. 1998. Effects of amplitude nonlinearity on phoneme recognition by cochlear implant users and normal-hearing listeners. J Acoust Soc Am, 104, 2570–2577.
- Fu Q.J. & Shannon R.V. 2000. Effects of dynamic range and amplitude mapping on phoneme recognition in Nucleus-22 cochlear implant users. Ear Hear, 21(3), 227–235.
- Gallégo S. & Micheyl C. 1998. Intensity discrimination and auditory brainstem responses in cochlear implant and normal-hearing listeners. Behav Neurosci, 112(4), 793–799.
- Galvin J.J III. & Fu Q.J. 2005. Effects of stimulation rate, mode and level on modulation detection by cochlear implant users. J Assoc Res Otolaryngol, 6(3), 269–279.
- Galvin J.J III. & Fu Q.J. 2009. Influence of stimulation rate and loudness growth on modulation detection and intensity discrimination in cochlear implant users. Hear Res, 250(1-2), 46–54.
- Goupell M.J., Kan A. & Litovsky R.Y. 2013. Mapping procedures can produce non-centered auditory images in bilateral cochlear implantees. J Acoust Soc Am, 133(2), EL101–EL107.
- Grantham D.W., Ashmead D.H., Ricketts T.A., Labadie R.F. & Hayness D.S. 2007. Horizontal-plane localization of noise and speech signals by postlingually deafened adults fitted with bilateral cochlear implants. Ear Hear, 28(4), 524–541.
- Hoth S. 2007. Indication for the need of flexible and frequency specific mapping functions in cochlear implant speech processors. Eur Arch Otorhinolaryngol, 264(2), 129–138.
- Hoth S. & Mϋller-Deile J. 2009. Audiologische rehabilitation von kochleaimplantat-Trägern. HNO, 57, 635–648.
- Houben A.C.H., Koopman J., Luts H., Wagener K., van Wieringen A., et al. 2014. Development of a Dutch matrix sentence test to assess speech intelligibility in noise. Int J Audiol, 53(10), 760–763.
- Khing P.P., Swanson B.A. & Ambikairajah E. 2013. The effect of automatic gain control structure and release time on cochlear implant speech intelligibility. PLoS One, 8, e82263.
- Kreft H.A., Donaldson G.S. & Nelson D.A. 2004. Effects of pulse rate and electrode array design on intensity discrimination in cochlear implant users. J Acoust Soc Am, 116(4 PT 1), 2258–2268.
- Levitt H. 1971. Transformed up-down methods in psychoacoustics. J Acoust Soc Am, 49(2), 467–477.
- Littell R.C., Pendergast J. & Natarajan R. 2004. Modelling covariance structure in the analysis of repeated measures data. D’Agostino, R.B. (ed.), Tutorials in Biostatistics: Statistical Modelling of Complex Medical Data, Chichester: John Wiley & Sons Ltd, p. 166.
- Nelson D.A., Schmitz J.L., Donaldson G.S., Viemeister N.F. & Javel E. 1996. Intensity discrimination as a function of stimulus level with electric stimulation. J Acoust Soc Am, 100(4), 2393–2314.
- Pfingst B.E., Xu L. & Thompson C.S. 2007. Effects of carrier pulse rate and stimulation site on modulation detection by subjects with cochlear implants. J Acoust Soc Am, 121(4), 2236–2246.
- Pfingst B.E., Burkholder-Juhasz R.A., Xu L. & Thompson C.S. 2008. Across-site patterns of modulation detection in listeners with cochlear implants. J Acoust Soc Am, 123(2), 1054–1062.
- Schoen F., Mueller J., Helms J. & Nopp P. 2005. Sound localization and sensitivity to interaural cues in bilateral users of the Med-El Combi 40/40+ cochlear implant system. Otol Neurotol, 26(3), 429–437.
- Theelen-van den Hoek F.L., Houben R. & Dreschler W.A. 2014. Investigation into the applicability and optimization of the Dutch matrix sentence test for use with cochlear implant users. Int J Audiol, 53(11), 817–828.
- Van Hoesel R.J. & Tyler R.S. 2003. Speech perception, localization, and lateralization with bilateral cochlear implants. J Acoust Soc Am, 113(3), 1617–1630.
- Willeboer C. 2008. Simplifying cochlear implant speech processor fitting. PhD thesis, University of Utrecht, Universal Press.
- Zeng F.G. & Galvin J.J. III, 1999. Amplitude mapping and phoneme recognition in cochlear implant listeners. Ear Hear, 20(1), 60–74.
- Zhou N. & Pfingst B.E. 2014. Effects of site-specific level adjustments on speech recognition with cochlear implants. Ear Hear, 35(1), 30–40.