
Abstract
Objective: To ascertain if wideband acoustic immitance (WAI) measurements are useful in assessing crimping status following stapedotomy. Design: WAI measurements were obtained using the Mimosa Acoustics HearID system. Wideband chirp sound stimuli and a set of tone stimuli for nine frequencies between 0.2 and 6 kHz were used at 60 dB SPL. Five sets of measurements were performed on each temporal bone: mobile stapes, stapes fixation and stapedotomy followed by insertion of a tightly crimped, a loosely crimped and an uncrimped prosthesis. Study sample: Eight fresh-frozen temporal bones were harvested from human cadaveric donors. Results: At lower frequencies, up to 1 kHz, stapes fixation decreased absorbance. Compared to the baseline absorbance, absorbance with stapes fixation dropped by 6 to 17% in absolute terms from the baseline value (p = 0.027). Absorbance was not affected in higher frequencies (p = 0.725). Stapedotomy changed the absorbance curve significantly compared to the normal condition with an increase of absolute absorbance values by 6 to 36% around 0.25–1 kHz (p-value <0.01). The crimping conditions did not differ from one another (p = 0.555). Conclusion: WAI is not useful in distinguishing between tightly crimped, loosely crimped and uncrimped stapes prostheses following stapedotomy.
Conductive hearing loss accompanied by an intact tympanic membrane and aerated middle ear is common and is usually caused by ossicular fixation, ossicular discontinuity, or can be mimicked by a third window lesion of the inner ear. There are no diagnostic tests commonly available that reliably differentiate between these conditions. The size and the pure-tone frequencies at which air-bone gaps occur on audiometry show large variations within and among these conditions (Rappaport & Provencal, Citation2002). Conventional 226 Hz tympanometry cannot differentiate between ossicular fixation, partial discontinuity or third window lesions (Fowler & Shanks, Citation2002). Although acoustic reflexes and vestibular-evoked myogenic potential testing are helpful in diagnosing superior canal dehiscence, they do not differentiate between ossicular conditions (Minor et al, Citation2005). A diagnostic test that accurately differentiates between these conditions and can be used in an office setting may be of clinical value. It could aid the otologist in preoperative counseling of patients and planning and prevent unnecessary surgery in patients with third window lesions (Minor et al, Citation2003; Li et al, Citation2011).
Wideband acoustic immitance (WAI) measurements have shown promise in the differential diagnosis of several middle ear disorders (Shahnaz et al, Citation2009a; Shahnaz et al, Citation2009b; Nakajima et al, Citation2012). WAI measurements are non-invasive, fast and evaluate the system over a broad range of frequencies. Moreover, WAI measurements have the potential to predict the causes of conductive hearing loss (Piskorski et al, Citation1999; Keefe & Simmons, Citation2003). WAI includes acoustic admittance, as well as acoustic impedance, power reflectance and power absorbance. These quantities describe the sound flow to and from the middle ear. Most studies report wideband energy reflectance (|R| 2) or wideband energy absorbance (A). The power reflectance is the square of pressure reflectance and represents the ratio of reflected energy to the incident energy. It varies from zero indicating all energy has been absorbed into the middle ear to one meaning all energy has been reflected back from the middle ear (Stinson, Citation1990). Absorbance represents the power absorbed by the middle ear and is computed as one minus the power reflectance.
Of particular importance in stapes surgery, various symptoms and signs may ensue post-stapedotomy surgery that may be due to a loose piston, or disengaged piston. One such is a recurrence or persistence of a conductive hearing loss. Another is the ‘loose wire syndrome’ (McGee, Citation1981), in which patients complain of sound distortion, particularly for louder sounds. A test to determine whether the prosthesis is loosely or tightly crimped onto the incus would be very useful clinically. Optimal fixation of the prosthesis to the incus is essential for adequate and effective sound transmission, as well as for minimizing unpleasant sensations. Both clinical and temporal bone studies have shown that the quality of crimping is associated with postoperative hearing results (Huber et al, Citation2003; Huber et al, Citation2008). In a temporal bone model, the sound transmission from incus to prosthesis following tight crimping was similar to the sound transmission found in the physiological incudostapedial joint (Huber et al, Citation2003). Loose and no crimping on the other hand led to sound transmission losses of 5 dB in high frequencies and 10 dB in low frequencies compared to the normal, pre-stapedotomy condition (Huber et al, Citation2003). Loose wires or dislocated prostheses are frequently encountered during revision stapes surgery and are frequently the main cause of hearing loss in this situation (Babighian & Albu, Citation2009; Vincent et al, Citation2010; Albers et al, Citation2013).
Our main goal for this study was to ascertain if WAI measurements may be useful in assessing crimping status following stapedotomy, and if they might help in diagnosing the main cause of failure before revision surgery and thus in preoperative counseling of patients. WAI measurements would also be useful to diagnosing the cause of symptoms of sound distortion following stapedotomy, perhaps also helping us to confirm a diagnosis of ‘loose wire syndrome’ (McGee, Citation1981).
Materials and methods
Temporal bone preparation
Eight temporal bones were harvested from human cadaveric donors within 48 hours of death. The bones were frozen until ready for processing. This process has little effect on their mechanical impedance characteristics (Rosowski et al, Citation1990; Ravicz et al, Citation2000). The freezing and thawing process was closely monitored to ensure no air bubbles ensued in the cochlea and the magnitude of the WAI measurements was similar in pre-frozen bones and in frozen and thawed bones. Cortical mastoidectomy was performed, followed by an extended posterior tympanotomy with removal of the facial nerve recess to expose the stapes footplate and round window region as much as possible. The temporal bones were examined microscopically to exclude tympanic membrane perforations and ossicular malformations, such as fixation of the ossicles or disruption of the ossicular chain. Only non-pathologic temporal bones were included in the study. One of the bones showed a ‘floppy’ tympanic membrane and stapes fixation and was excluded for these reasons. In all bones, we checked that the phase difference of the round window and oval window in response to low frequency acoustic stimulation was −180 °C, to eliminate the possibility of air bubbles from the thawing process (Kringlebotn, Citation1995). Throughout measurements, saline was applied periodically to the temporal bone surface and tympanic membrane to make sure the bone stayed moist (Voss et al, Citation2000). Excess fluid was suctioned away before taking measurements.
Wideband acoustic immitance measurements
The WAI measurements were obtained in a sound-treated room using the Mimosa Acoustics HearID system (HearID software version 5.1.9.2). The middle ear cavity was closed off using clay when taking measurements. A foam eartip with an ER-10C probe was placed in the ear canal. The bones used in these experiments were used for an additional set of experiments (Wegner et al, Citation2016). These additional experiments required the use of laser Doppler interferometry and thus the placement of an ER-7 microphone through the anterior ear canal wall and within 2 mm of the anterior margin of the tympanic membrane. The ER-7 microphone was glued in place and even though it was not used for data collection, it was present while performing the measurements required for the experiments described in this paper. The method that is used to calculate WAI assumes there are no losses along the ear canal wall and that the cross-sectional area of the ear canal is known at the measurement location and does not change (abruptly) along the ear canal. It is assumed that differences between these assumptions and reality are negligible. Absorbance generally increases with distance from the tympanic membrane, though if the distance remains between 3 and 5 mm from the tympanic membrane, the variation in absorbance is negligible (Voss et al, Citation2008). The distance between the foam ear tip and tympanic membrane was standardized as much as possible in our experimental set-up. The distance between the foam ear tip and the tympanic membrane was kept within 5 mm. Furthermore, the insertion depth was marked on the foam ear tip at first use to ensure the distance between the foam ear tip and the tympanic membrane remained the same throughout different conditions within one bone. Both wideband chirp sound stimuli and a set of tone stimuli for nine frequencies between 0.2 and 6 kHz were used at 60 dB sound pressure level. Five sets of measurements were performed: (1) normal condition (mobile stapes), (2) stapes fixation and stapedotomy followed by insertion of a (3) tightly crimped prosthesis, (4) a loosely crimped prosthesis, and (5) a prosthesis that is not crimped at all. All of these conditions were simulated in each temporal bone. The post-stapedotomy conditions were performed in a randomized fashion using a randomization chart that was established before performing any measurements. In each test condition, wideband chirp responses were repeated until two sequential measurements varied by less than a few percent. The two repeatable chirp responses were averaged and used for further analyses. The tone responses were used to further check repeatability of the measurements. The probe was calibrated daily using Mimosa’s instructions, which can be found online (www.mimosaacoustics.com). The calibration procedure determines the Thévenin equivalent source parameters of the combined sound source, microphone and attached foam tip (Rosowski et al, Citation2012). It utilizes sound pressure measurements at the entrance of four cylindrical tubes of different lengths. The calculated Thévenin equivalent needs to be within a set of predetermined values before proceeding with absorbance measurements.
Stapes fixation and stapedotomy
The stapes footplate was immobilized using coral glue (EcoTech Marine LLC, Allentown, PA) to simulate otosclerosis (Nakajima et al, Citation2005; Perez et al, Citation2011; Sim et al, Citation2012; Beyea et al, Citation2013). Immobility of the stapes was checked by manual palpation of the incus and stapes with a microscopic hook. Furthermore, laser Doppler interferometry confirmed stapes fixation; proper fixation of the stapes resulted in reduced vibration velocities of the stapes and round window to almost the noise floor. A standard stapedotomy surgery was performed using the 0.4-mm-diameter Kurz Titanium K-piston. Fenestration of the stapes footplate was performed using a drill. The fenestration size was approximately 0.5 mm. The area around the fenestration was filled with saline during the stapedotomy to prevent the leakage of intracochlear fluid (Sim et al, Citation2012). To reduce fluid leakage between the piston and the stapedotomy perforation following the stapedotomy and to simulate sealing mucosa growing over the fenestration, the area around the perforation was covered with perichondrium. Perichondrium was used as it could be harvested directly from the concha or tragus of our temporal bone specimens. In the no crimping condition, the prosthesis was placed on the incus without crimping it at all. In the loose crimping condition, the prosthesis was partially crimped around the incus using two angulated hooks. There was still an obvious free movement between the incus and the prosthesis upon palpation of the incus. When tightly or completely crimped, the prosthesis did not show free movement while touching the incus with an angulated hook.
Statistical analyses
In accordance with the Eriksholm Workshop on Wideband Absorbance Measures of the Middle Ear Consensus Statement, the absorbance was used to describe WAI (Feeney et al, Citation2013). Statistical analyses were performed using SPSS version 23.0 (IBM Corp., Armonk, NY, USA). The absorbance was averaged over one-third octave bands for data analysis, which reduced the data points from 248 to 15 frequencies. To track the individual patterns of change in absorbance in different simulated conditions, the data for each temporal bone was analysed qualitatively, to avoid averaging out effects that might be qualitatively similar, but varied in the frequency at which they occurred between temporal bones. One temporal bone was an outlier and therefore the results in this temporal bone were not used in the quantitative analyses (see the Results section). Repeated measures analysis of variance (ANOVA) was used to analyze the data from six temporal bones quantitatively. First, two repeated measures ANOVAs were performed for comparison of the normal condition and stapes fixation for groups of frequencies (0.25–1.0 kHz and 1.25–6.0 kHz). Similarly, two repeated measures ANOVAs were performed for comparison of the normal condition and stapedotomy followed by interposition of a tightly crimped prosthesis (0.25–1.0 kHz and 1.25–6.0 kHz). The cut-off value between groups of frequencies was based on visual inspection of . Condition and frequency served as within-subject factors. Third, a repeated-measure ANOVA was performed for comparison of different crimping qualities for all frequencies. Condition and frequency served as within-subject factors. To compensate for violations of compound symmetry and sphericity, the Greenhouse and Geisser approach was used. Although it is a conservative test, it does guard against an inflated type I error.
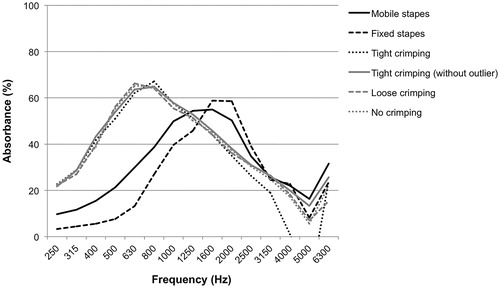
Figure 1. Mean absorbance (%) averaged over 1/3 octave bands from 0.2 to 6 kHz for normal stapes, fixed stapes, and following stapedotomy. For the condition ‘tight crimping,’ a curve including an outlier (n = 6) and excluding an outlier is presented (n = 5).
Results
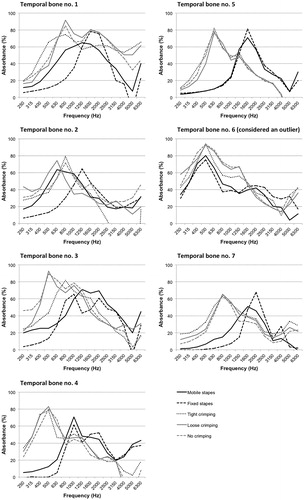
shows the graphed individual results for each temporal bone. This is important to look at, in addition to the averages, as the frequency response changes seen in different prosthesis crimping conditions may follow a similar pattern from bone to bone, but may occur at different frequencies, and so not be visible in the averaged results. Whilst there are general trends for the relative changes between conditions that are similar in many bones, there are also large variations from bone to bone. With regard to the normal and stapes fixation condition, fixation of the stapes footplate resulted in a decrease in energy absorption at low frequencies in most temporal bones. Temporal bone number 5 and temporal bone number 6 did not show this pattern. In these two bones, fixation of the stapes footplate did not change the energy absorption much at any of the measured frequencies. Furthermore, temporal bone number 6 showed a similar pattern in energy absorption for all five conditions. Pathology at a more lateral level, such as tympanic membrane flaccidity or ossicular chain hypermobility, might be masking the simulated conditions at the level of the stapes (footplate). However, no tympanic membrane abnormalities or ossicular chain malformations were seen upon microscopic evaluation of this temporal bone. Even though we do not have an explanation for the similarity in energy absorption across all conditions in this temporal bone, we decided not to include this temporal bone in the group analyses, as it would skew the data. In fact, including or not including this bone changes the group data very little.
Figure 2. Mean absorbance (%) averaged over 1/3 octave bands from 0.2 to 6 kHz for normal stapes, fixed stapes, and following stapedotomy. Temporal bone number 6 was considered an outlier.
illustrates the mean absorbance in six temporal bones for all five conditions using one-third octave bands. illustrates the mean absorbance per frequency for the normal condition and stapes fixation using tone stimuli responses. At lower frequencies, up to 1 kHz, stapes fixation decreased absorbance. Compared to the baseline absorbance (which varied from 10 to 54% by bone and frequency), absorbance with stapes fixation dropped by 6 to 17% in absolute terms from the baseline value (p = 0.027). Absorbance was not affected as much in higher frequencies (p = 0.725). Stapedotomy changed the absorbance curve significantly compared to the normal condition with an increase of absorbance values around 0.25–1 kHz (, ; p = 0.005). At these lower frequencies, stapedotomy increased the absolute absorbance by 6 to 36% compared to the normal condition.
Table 1. Mean absorbance (%) averaged over 1/3 octave bands from 0.2 to 6 kHz for normal and fixed stapes (n = 6).
Table 2. Mean absorbance (%) averaged over 1/3 octave bands from 0.2 to 6 kHz for normal stapes and stapedotomy followed by interposition of a tightly crimped prosthesis (n = 6).
In particular, the crimping conditions did not differ from one another with regard to absorbance (p = 0.555; , ). While there was no difference between loose and no crimping, there seemed to be a marked difference between these two conditions and tight crimping at high frequencies. However, one outlier mainly affected the mean absorbance for the tight crimping condition at these frequencies. This is reflected in the large standard deviations at 4 and 5 kHz (50 and 96 respectively). When we disregard this outlier, the mean absorbances for the tight crimping condition do not differ very much from the loose and no crimping conditions (). It needs to be noted that absorbance varied greatly between temporal bones. This is reflected by the large standard deviations in , and .
Table 3. Mean absorbance (%) averaged over 1/3 octave bands from 0.2 to 6 kHz for tight crimping, loose crimping and no crimping (n = 6).
Discussion
Our results are in agreement with numerous studies that have shown that stapes fixation increases power reflectance at frequencies lower than 1 kHz, indicating increased stiffness in the middle ear system (Shahnaz et al, Citation2009a; Shahnaz et al, Citation2009b; Nakajima et al, Citation2012). Shahnaz et al also found that the range of power reflectance varies greatly within normal ears (Shahnaz et al, Citation2013) and thereby limits the use of power reflectance as a diagnostic tool. The mean power reflectance in ears with stapes fixation may be statistically different from normal ears, but it may not be possible to distinguish one individual pathological ear from normal based on power reflectance (Nakajima et al, Citation2013). Indeed, our results and those reported by Shahnaz et al show that the range of power reflectance for stapes fixation overlaps considerably with the range for normal ears (Shahnaz et al, Citation2009a). In the context of other clinical tools that are currently used to assess the middle ear, however, numerous studies have shown superior test performance of WAI measurements compared to the very poor performance of conventional tympanometry in detecting stapes fixation (Piskorski et al, Citation1999; Keefe & Simmons, Citation2003; Feeney et al, Citation2003; Shahnaz et al, Citation2009a). Furthermore, Nakajima et al have shown that a combination of air-bone gap measurements and power reflectance can accurately differentiate between different pathologies, namely stapes fixation, ossicular discontinuity and superior canal dehiscence (Nakajima et al, Citation2013). Sensitivities ranged between 83 and 100% and specificities ranged between 95 and 100% in their study.
Shahnaz et al examined patterns of power reflectance in otosclerotic ears and compared these to patterns of power reflectance following stapes surgery (Shahnaz et al, Citation2009b). The most prominent change they found following stapes surgery was a sharp and deep drop in the power reflectance values between 0.7 and 1 kHz. Furthermore, they found a small increase in power reflectance between 2 and 4 kHz following stapes surgery. The power reflectance values approximated the values that are found in normal ears. In our study, we found the same pattern when comparing measurements taken pre-stapedotomy and post-stapedotomy. However, the sharp increase in absorbance in the lower frequencies and mild decrease in absorbance in higher frequencies post-stapedotomy were more pronounced and did not exactly match the pattern found in non-otosclerotic ears in living controls. The power reflectance/absorbance patterns following stapes surgery, which bypasses the power flow through the stapes crura, footplate and annular ligament, are very similar to the patterns observed in ossicular discontinuity (Feeney et al, Citation2003; Voss et al, Citation2008). Ossicular discontinuity is also characterized by a deep notch in power reflectance in the low frequencies, which corresponds with a steep increase in absorbance. The total impedance in the human middle ear at lower frequencies is largely dominated by the annular ligament and inner ear complex (Hüttenbrink, Citation2003). Stapes surgery eliminates the contribution of the annular ligament to the total impedance of the middle ear.
Three reports have analysed test-retest measurements of power reflectance in a clinical setting with the probe reinserted between measurements during the same measurement sessions (Vander Werff et al, Citation2007; Hunter et al, Citation2008; Beers et al, Citation2010). The 90th percentile of test-retest differences in power reflectance was within 5% in the study performed by Vander Werff et al (Citation2007). Hunter et al reported intraclass correlation coefficients that ranged between 0.68 and 0.97 at nine frequencies (Hunter et al, Citation2008). Beers et al (Citation2010) found that test-retest difference in control subjects without middle ear pathology were negligible. Two studies performed test-retest measurements in a clinical setting during different sessions that were one or two weeks apart (Werner et al, Citation2010; Rosowski et al, Citation2012). Werner et al reported differences between test and retest measurements of around 5% in adults with the 90th percentile between 10 and 15% (Werner et al, Citation2010). Rosowski et al (Citation2012) reported similar results. Because test-retest measurements have shown substantial reliability, observed differences between conditions are most likely due to changes in the conditions and not as a result of measurement variability. Additionally, our temporal bone experiments were carried out in a controlled setting, which is why it seems likely that intrasubject variations are less than in a clinical setting.
Our results would suggest that wideband power reflectance measurements are not useful clinically to distinguish the crimping status of stapes prosthesis. There is no individual resonance that can be attributed to a loose piston that was detectable on our acoustic measurements. Hence, the main focus of our study has not yielded a promising clinically applicable test.
Several limitations should be taken into consideration when interpreting our results. First, an ER-7 microphone was placed through the anterior ear canal wall and within 2 mm of the anterior margin of the tympanic membrane. The ER-7 microphone was glued in place and even though it was not used for data collection, it was present while performing the measurements required for the experiments described in this paper. Feeney et al (Citation2009) showed that the presence of an ER-7 microphone did not affect WAI measurements. They tested this assumption in two temporal bones only. Second, our measurements only went to 6 kHz. It is possible there may be a free resonance of the stapes loosely or uncoupled piston at higher frequencies, although the number of fine resonances, which may vary from bone to bone, will likely also be more frequent at higher frequencies. Last, in real life the fenestration site will be well sealed with scar tissue over time resulting in increased stiffness. We did not attempt to mimic this scar tissue effect.
Conducting WAI under pressurization (wideband tympanometry) may provide additional diagnostic information. Pressurizing the middle ear tends to load the eardrum, which in turn may potentially lead to accentuated differences in power absorbance between groups at peak pressure (Gaihede, Citation1996). Future investigations should determine whether the difference between different simulated conditions as well as crimping conditions could be accentuated when the middle ear is pressurized. It has been shown that pressurizing of the middle ear can correctly identify middle ear pathology in individuals whose middle ear condition appeared to look normal at ambient pressure (Margolis et al, Citation1999; Keefe & Simmons, Citation2003).
Declaration of interest
The authors report no conflicts of interest.
| Abbreviations | ||
| ANOVA | = | analysis of variance |
| dB | = | decibel |
| kHz | = | kilohertz |
| n | = | number |
| SD | = | standard deviation |
| SPL | = | sound pressure level |
| WAI | = | wideband acoustic immitance |
References
- Albers A.E., Schönfeld U., Kandilakis K. & Jovanovic S. 2013. CO2 laser revision stapedotomy. Laryngoscope, 123, 1519–1526.
- Babighian G.G. & Albu S. 2009. Failures in stapedotomy for otosclerosis. Otolaryngol Head Neck Surg, 141, 395–400.
- Beers A.N., Shahnaz N., Westerberg B.D. & Kozak F.K. 2010. Wideband reflectance in normal Caucasian and Chinese school-aged children and in children with otitis media with effusion. Ear Hear, 31, 221–233.
- Beyea J.A., Rohani S.A., Ladak H.M. & Agrawal S.K. 2013. Laser Doppler vibrometry measurements of human cadaveric tympanic membrane vibration. J Otolaryngol Head Neck Surg, 42, 17.
- Feeney M.P., Grant I.L. & Marryott L.P. 2003. Wideband energy reflectance measurements in adults with middle-ear disorders. J Speech Lang Hear Res, 46, 901–911.
- Feeney M.P., Grant I.L. & Mills D.M. 2009. Wideband energy reflectance measurements of ossicular chain discontinuity and repair in human temporal bone. Ear Hear, 30, 391–400.
- Feeney M.P., Hunter L.L., Kei J., Lilly D.J., Margolis R.H., et al. 2013. Consensus statement: Eriksholm workshop on wideband absorbance measures of the middle. Ear. Ear Hear, 34, 78S–79S.
- Fowler C.G. & Shanks J.E. 2002. Tympanometry. In: Katz, J., Burkard, R.F., Medwetsky, L. (eds.), Handbook of Clinical Audiology: Fifth Edition. Philadelphia: Lippincott, Williams and Wilkins. pp. 175–204.
- Gaihede M. 1996. Tympanometric preconditioning of the tympanic membrane. Hear Res, 102, 28–34.
- Huber A.M., Ma F., Felix H. & Linder T. 2003. Stapes prosthesis attachment: The effect of crimping on sound transfer in otosclerosis surgery. Laryngoscope, 113, 853–858.
- Huber A.M., Veraguth D., Schmid S., Roth T. & Eiber A. 2008. Tight stapes prosthesis fixation leads to better functional results in otosclerosis surgery. Otol Neurotol, 29, 893–899.
- Hunter L.L., Tubaugh L., Jackson A. & Propes S. 2008. Wideband middle ear power measurement in infants and children. J Am Acad Audiol, 19, 309–324.
- Hüttenbrink K.B. 2003. Biomechanics of stapesplasty: A review. Otol Neurotol, 24, 548–557.
- Keefe D.H. & Simmons J.L. 2003. Energy transmittance predicts conductive hearing loss in older children and adults. J Acoust Soc Am, 114, 3217–3238.
- Kringlebotn M. 1995. The equality of volume displacements in the inner ear windows. J Acoust Soc Am, 98, 192–196.
- Li P.M., Bergeron C., Monfared A., Agrawal S. & Blevins N.H. 2011. Superior semicircular canal dehiscence diagnosed after failed stapedotomy for conductive hearing loss. Am J Otolaryngol, 32, 441–444.
- Margolis R.H., Saly G.L. & Keefe D.H. 1999. Wideband reflectance tympanometry in normal adults. J Acoust Soc Am, 106, 265–280.
- McGee T.M. 1981. The loose wire syndrome. Laryngoscope, 91, 1478–1483.
- Minor L.B., Carey J.P., Cremer P.D., Lustig L.R., Streubel S.O., et al. 2003. Dehiscence of bone overlying the superior canal as a cause of apparent conductive hearing loss. Otol Neurotol, 24, 270–278.
- Minor L.B. 2005. Clinical manifestations of superior semicircular canal dehiscence. Laryngoscope, 115, 1717–1727.
- Nakajima H.H., Ravicz M.E., Rosowski J.J., Peake W.T. & Merchant S.N. 2005. Experimental and clinical studies of malleus fixation. Laryngoscope, 115, 147–154.
- Nakajima H.H., Pisano D.V., Röösli C., Hamade M.A., Merchant G.R., et al. 2012. Comparison of ear-canal reflectance and umbo velocity in patients with conductive hearing loss: a preliminary study. Ear Hear, 33, 35–43.
- Nakajima H.H., Rosowski J.J., Shahnaz N. & Voss S.E. 2013. Assessment of ear disorders using power reflectance. Ear Hear, 34, 48S–53S.
- Perez R., Adelman C. & Sohmer H. 2011. Bone conduction activation through soft tissues following complete immobilization of the ossicular chain, stapes footplate and round window. Hear Res, 280, 82–85.
- Piskorski P., Keefe D.H., Simmons J.L. & Gorga M.P. 1999. Prediction of conductive hearing loss based on acoustic ear-canal response using a multivariate clinical decision theory. J Acoust Soc Am, 105, 1749–1764.
- Rappaport J.M. & Provencal C. 2002. Neurotology for audiologists. In: Katz, J., Burkard, R.F., Medwetsky, L. (eds.), Handbook of Clinical Audiology: Fifth Edition. Philadelphia: Lippincott, Williams and Wilkins. pp. 9–32.
- Ravicz M.E., Merchant S.N. & Rosowski J.J. 2000. Effect of freezing and thawing on stapes-cochlear input impedance in human temporal bones. Hear Res, 150, 215–224.
- Rosowski J.J., Davis P.J., Merchant D.N., Donahue K.M. & Coltrera M.D. 1990. Cadaver middle ears as models for living ears: Comparisons of middle ear input immittance. Ann Otol Rhinol Laryngol, 99, 403–412.
- Rosowski J.J., Nakajima H.H., Hamade M.A., Mahfoud L., Merchant G.R., et al. 2012. Ear-canal reflectance, umbo velocity, and tympanometry in normal-hearing adults. Ear Hear, 33, 19–34.
- Shahnaz N., Bork K., Polka L., Longridge N., Bell D., et al. 2009a. Energy reflectance and tympanometry in normal and otosclerotic ears. Ear Hear, 30, 219–233.
- Shahnaz N., Longridge N. & Bell D. 2009b. Wideband energy reflectance patterns in preoperative and postoperative otosclerotic ears. Int J Audiol, 48, 240–247.
- Shahnaz N., Feeney M.P. & Schairer K.S. 2013. Wideband acoustic immittance normative data: Ethnicity, gender, aging, and instrumentation. Ear Hear, 34, 27S–35S.
- Sim J.H., Chatzimichalis M., Röösli C., Laske R.D. & Huber A.M. 2012. Objective measurement of stapedotomy surgery from round window motion measurement. Ear Hear, 33, 24–31.
- Stinson M.R. 1990. Revision of estimates of acoustic energy reflectance at the human eardrum. J Acoust Soc Am, 88, 1773–1778.
- Vander Werff K.R., Prieve B.A. & Georgantas L.M. 2007. Test-retest reliability of wideband reflectance measures in infants under screening and diagnostic test conditions. Ear Hear, 28, 669–681.
- Vincent R., Rovers M., Zingade N., Oates J., Sperling N., et al. 2010. Revision stapedotomy: Operative findings and hearing results. A prospective study of 652 cases from the Otology-Neurotology Database. Otol Neurotol, 31, 875–882.
- Voss S.E., Rosowski J.J., Merchant S.N. & Peake W.T. 2000. Acoustic responses of the human middle ear. Hear Res, 150, 43–69.
- Voss S.E., Horton N.J., Woodbury R.R. & Sheffield K.N. 2008. Sources of variability in reflectance measurements on normal cadaver ears. Ear Hear, 29, 651–665.
- Wegner I., Eldaebes M.M.A.S., Landry T.G., Adamson R.B., Grolman W., et al. 2016. Effect of round window reinforcement on hearing: A temporal bone study with clinical implications for surgical reinforcement of the round window. Otol Neurotol, 37, 598–601.
- Werner L.A., Levi E.C. & Keefe D.H. 2010. Ear-canal wideband acoustic transfer functions of adults and two- to nine-month-old infants. Ear Hear, 31, 587–598.