
Abstract
Objective: This study investigated the hypotheses that (1) prelingually deafened CI users do not have perfect electrode discrimination ability and (2) the deactivation of non-discriminable electrodes can improve auditory performance. Design: Electrode discrimination difference limens were determined for all electrodes of the array. The subjects’ basic map was subsequently compared to an experimental map, which contained only discriminable electrodes, with respect to speech understanding in quiet and in noise, listening effort, spectral ripple discrimination and subjective appreciation. Study Sample: Subjects were six prelingually deafened, late implanted adults using the Nucleus cochlear implant. Results: Electrode discrimination difference limens across all subjects and electrodes ranged from 0.5 to 7.125, with significantly larger limens for basal electrodes. No significant differences were found between the basic map and the experimental map on auditory tests. Subjective appreciation was found to be significantly poorer for the experimental map. Conclusions: Prelingually deafened CI users were unable to discriminate between all adjacent electrodes. There was no difference in auditory performance between the basic and experimental map. Potential factors contributing to the absence of improvement with the experimental map include the reduced number of maxima, incomplete adaptation to the new frequency allocation, and the mainly basal location of deactivated electrodes.
Introduction
Prelingually deafened patients who receive a cochlear implant (CI) in adulthood, after many years of severe hearing impairment or auditory deprivation, constitute a very specific group of cochlear implant users. In the early years of cochlear implantation, results from this population were not very promising, with subjects experiencing very limited benefit with respect to speech understanding (Tong et al, Citation1988; van den Broek et al, Citation1992; Snik et al, Citation1997). With advancements in speech processing strategies, these subjects have generally become more successful CI users, albeit with large inter-individual differences (Teoh et al, Citation2004; Caposecco et al, Citation2012). In view of this substantial variability in outcome, the current study attempted to optimize cochlear implant performance for prelingually deafened subjects by means of individually adapted cochlear implant fitting.
When looking at the underlying auditory processing abilities of this patient population, it is clear that the long-term auditory deprivation of these subjects has influenced the development of the auditory pathways. A long period of profound deafness will severely reduce the number of spiral ganglion cells on a peripheral auditory level. A clear relation between the number of surviving spiral ganglion cells and clinical performance with a cochlear implant has not yet been shown, however (Fayad & Linthicum, Citation2006; Xu et al, Citation2012). Anomalies in this part of the auditory system alone can therefore not fully explain the limited results for most prelingually deafened, late-implanted CI users. It is more likely that this can be explained by aberrant development of the auditory brainstem and, most of all, the auditory cortex. Studies in children using cochlear implants (Gordon et al, Citation2011) and animal models (Butler & Lomber, Citation2013) have shown that the subcortical nuclei of the auditory brainstem require auditory input for further maturation; a sophisticated tonotopy, for instance, does not develop (Butler & Lomber, Citation2013). Synaptic activity in the primary auditory cortex will deviate substantially from normal including less activation of the deeper cortical layers (Kral, Citation2007). These deep layers are usually responsible for cognitive modulation, integrating descending (top-down) input from higher-order cortical layers, and also project back to subcortical structures. Based on animal studies, (Kral et al, Citation2005; Kral, Citation2007), hypothesized that a functional decoupling between the primary auditory cortex and higher cortical layers occurs when auditory input is not restored before the end of a sensitive period which, in humans, is thought to lie around 7 years of age (Sharma et al, Citation2009). This may lead to an auditory system that is incapable of forming auditory objects, which is a requirement for attributing meaning to incoming auditory stimuli (Kral, Citation2013). In addition, cross-modal reorganization may occur, with mainly higher order auditory structures being recruited by other sensory modalities such as vision (Kral, Citation2007). This phenomenon is illustrated by Buckley & Tobey (Citation2011), who showed that higher activation in the auditory cortex in response to peripheral visual movements was correlated with lower speech understanding scores in CI users with a prelingual onset of deafness. In conclusion, differences in auditory processing may explain the reduced speech understanding performance as compared to post-lingually deafened CI-users.
Given the irreversible consequences of long-term auditory deprivation in prelingually deafened CI users, arranging the speech signals through the processing strategies might facilitate the reception and processing in the compromised auditory structure. Due to the filterbank system of CI processing, which relies on cochlear tonotopy, the exact pattern of stimulated sites along the array contains potentially important information for speech understanding. It is hypothesized in this study that it is difficult for prelingually deafened CI users to discriminate between stimulation given on different electrodes, and that this limits their access to the spectral information encompassed in the stimulation pattern. These difficulties might be due to a reduced neural survival on a peripheral level, with different electrodes stimulating largely the same neurons, as well as to a less precise development of tonotopy throughout the auditory system. Additionally, the auditory cortex might encounter more difficulties in translating the incoming neural signals into distinct auditory percepts. The ability to discriminate between stimulation given at different sites in the cochlea can be evaluated by means of electrode discrimination testing. In post-lingually deafened cochlear implant users, (near) perfect discrimination was found when stimulation was given at C-level (Zwolan et al, Citation1997; Laneau & Wouters, Citation2004; Chatterjee & Yu, Citation2010). To our knowledge, two studies have specifically tested the electrode discrimination abilities of prelingually deafened CI users. In the first study (Busby & Clark, Citation1996), 50% discrimination limens of six subjects for an apical, mid and basal electrode ranged from 0.5 to over 7 electrodes. In the second study, average limens across 3 electrode positions targeting 70.7% correct, varied from 0.68 to 5.36 electrodes in a group of 16 young subjects (Busby & Clark, Citation2000).
Electrode discrimination results and speech understanding have been found to correlate in some, but not all studies investigating this relationship (Zwolan et al, Citation1997; Busby & Clark, Citation2000; Henry et al, Citation2000). However, these studies did not use up-to-date speech coding strategies. More recently, studies using spectral ripple discrimination tests generally found good correlations between discrimination thresholds and speech understanding (Won et al, Citation2007; Jones et al, Citation2013; Drennan et al, Citation2014). Spectral ripple discrimination relies on complex spectral pattern analysis, and therefore is expected to require good electrode discrimination skills. Moreover, a number of studies have shown no further improvement in speech understanding with more than about 7 to 12 active electrodes (Friesen et al, Citation2005; Shannon et al, Citation2011). Our objective was therefore to determine whether speech understanding performance of prelingually deafened CI users would improve when only mutually discriminable electrodes were selected for use in cochlear implant fitting. Selectively turning off electrodes related to “ineffective sites” in order to improve speech perception is referred to as the “site selection strategy” (Pfingst et al, Citation2008). To our knowledge, only two studies have tested speech recognition in post-lingually deafened subjects using an experimental cochlear implant program containing only discriminable electrodes. In a study by Zwolan et al (Citation1997), seven out of nine subjects showed improvement with the experimental map. It is important to note that these subjects made use of the MPEAK strategy, an F0F1F2-based strategy encoding the fundamental frequency (F0), first (F1) and second (F2) formant, no longer used nowadays. A study by Saleh et al (Citation2013) found significant improvements in speech perception scores for 16 of 25 post-lingually deafened subjects, using an experimental program that contained either only discriminable or the two-thirds most discriminable electrodes.
The first goal of the present study is to determine electrode discrimination difference limens for the entire electrode array in a number of prelingually deafened, late-implanted adult cochlear implant users. It is hypothesized that a number of electrodes have less than perfect discrimination limens, with subjects not being able to discriminate between stimulation on adjacent or even further removed electrodes. The second goal is to investigate whether changing CI fitting based on the electrode discrimination results, can lead to improved speech understanding, listening effort, spectral ripple discrimination and subjective appreciation in this patient population.
Methods
Subjects
The six subjects in this study met the following inclusion criteria: onset of deafness/severe hearing loss before or at the age of 4 years, unilateral implantation with a Nucleus cochlear implant, a minimum of 1 year experience with their implant, Dutch native language, oral communication as primary mode of communication, age at implantation >16 years, age at inclusion >18 years and <80 years and normal reading skills. Four subjects used a Nucleus CP810 processor, one used a CP910 processor and one a Freedom processor. Their PTA (pure-tone average of 500, 1000 and 2000 Hz) for the contralateral ear ranged from 92 to 115 dB HL. presents the subjects’ main characteristics. The Medical Ethical Committee of the Maastricht University Medical Center granted approval for the study protocol.
Table 1. Subject characteristics.
Electrode discrimination testing
Prior to electrode discrimination measurements, thresholds (T-levels), most comfortable loudness (MCL) levels, and uncomfortable loudness (UCL) levels were determined for a number of electrodes, and loudness level was balanced between electrodes. Deactivated electrodes in the map that subjects used in daily life, were not included in the experiments.
Stimuli were pulse trains with duration of 1 s, a rate of 900 pulses per second (pps), pulse width (PW) 25 or 50 μs with 8 μs interphase gap. The clinically used rate for all subjects was 900 pps. T-levels were determined on five electrodes spread over the array and interpolated for the remaining electrodes. The MCL-level was measured on the most central electrode of the array. Initial MCL-levels for the remaining electrodes were set at the same percentage of the dynamic range (between T- and UCL-level) as the central electrode. UCL-levels were determined for all active electrodes of the array. For both the MCL- and UCL-levels a loudness scale containing five steps (almost inaudible, soft, medium, loud, too loud) was used, with the MCL-level corresponding to “medium” and the UCL-level to “too loud”.
All electrodes were pairwise loudness balanced with their neighbouring electrode. The most central electrode of the array was chosen as a starting point in order to minimize the drift in loudness towards the ends of the array. Neighbouring electrodes were chosen because they are easier to balance due to the small differences in sound quality and because it was important for the discrimination task that nearby electrodes were well balanced. In each run, the current level (CL, as clinically applied by CochlearTM) of the reference electrode was kept constant and the level of the comparison electrode was varied adaptively in a 1 up – 1 down procedure (Levitt, Citation1971). The starting level for each comparison electrode and the first, central, reference electrode was the initial, previously determined, MCL-level. Each trial consisted of two intervals, one on the reference electrode and one on the comparison electrode, using the same stimuli as described above, with an interstimulus interval of 1 s. The subject judged which of both stimuli was louder after each trial. The level of the comparison electrode was then adapted accordingly in the next trial. A step size of 5 CL was applied with the stimulation level on any electrode maximized at the predetermined UCL-level. The run was terminated after six reversals; the average of the last four reversals was used to calculate a “balanced level”. Two runs were conducted per electrode pair and the average balanced level of both runs was used as the new fixed level of the reference electrode for the next pairwise comparison. It is possible that small differences in loudness may remain between “balanced” stimuli; therefore, loudness roving was adopted to prevent the effect of loudness from systematically impacting the results.
Electrode discrimination testing was performed using a 2-down-1-up 3-interval oddity adaptive procedure (Levitt, Citation1971), converging to the 70.7% correct point on the psychometric function. In other words, a difference limen of 1 electrode would indicate that the subject could correctly discriminate adjacent electrodes with an accuracy of 70.7%. Loudness roving was applied to each interval of the stimulus presentation, the magnitude being calculated per subject, based on the principles of Dai & Micheyl (Citation2010)1. In each trial, the subject was presented with three stimuli in random order: two on the same, fixed (reference) electrode and one on the other (comparison) electrode. The interstimulus interval was 0.5 s. The electrode number of the comparison electrode was varied adaptively in a 2-down-1-up manner. At the beginning of the procedure the comparison electrode was five electrode numbers more basal (for electrode numbers 7 to 22) or apical (for electrode numbers 1 to 6) than the reference electrode. The switch from a basal to an apical direction resulted in some overlap, in particular in the vicinity of reference electrode numbers 6 and 7. For S5, the distance at the beginning of the procedure was increased, to maximally nine electrodes, due to discrimination difficulties. The procedure started with a step size of two electrodes for the first two reversals, and a step size of one electrode for the remaining four reversals. The average of the last four reversals was used as the result of the run. When the subject showed perfect performance between adjacent electrodes (100% accuracy), the reversals in the procedure would be between the same and the neighbouring electrodes, leading to an average limen difference of 0.5. Two runs were performed for each reference electrode. The electrode discrimination difference limen (EDDL) was then calculated as the difference between the reference electrode number and the average of both runs.
Creating the experimental map
An experimental map (EM) was programmed, starting from the subjects’ basic map (BM) used by the subject in daily life. Using the results of the electrode discrimination testing, electrodes were deactivated so that all remaining electrodes were mutually discriminable for the subject. If there was more than one possible deactivation pattern, the number of deactivated electrodes was kept as low as possible with the remaining electrodes spread optimally over the array. In case of contradictory discrimination in apical versus basal direction, the best discrimination result was used. The Frequency Allocation Table (FAT) was redistributed over the remaining electrodes using the “recalculate” option of the Custom Sound™ software2. Since this induces a shift of the tonotopic representation of the frequency map, subjects were given a habituation period of four weeks with the EM. At the end of the study, the processor was reprogrammed according to the subjects’ preference.
The ACE strategy was applied in the BM of all subjects, with the number of maxima set to eight. In the EM, the ratio between maxima and number of electrodes was kept at the original level, thereby reducing the number of maxima, with a minimum of four. This reduction of the maxima was preferred in an attempt to emphasize spectral contrasts, given that the number of electrodes available for stimulation was reduced. If SmartSound™ options were used, they were programmed in combination with the EM as well since denying subjects the use of their favourite SmartSound™ options could have a negative impact on their acceptance of the new map. Only during the spectral ripple discrimination test, which is described below, SmartSound™ options were deactivated. All remaining parameters were left unaltered in the EM, except when subjects indicated that the EM was louder or softer, in which case a general adjustment of C-levels was allowed.
Evaluation procedures
Tests on speech understanding, listening effort, spectral resolution and a questionnaire addressing subjective appreciation were administered to compare the EM with the BM in a repeated-measures design with two visits, separated by a four week habituation period with the EM.
Speech understanding tests
Phoneme scores in percentage correct on an open set, Dutch, monosyllabic (CNC) word test (Bosman & Smoorenburg, Citation1995) were collected at 75, 65 and 55 dB SPL. A Dutch open-set sentence test (LIST) (van Wieringen & Wouters, Citation2008) was administered in quiet at 65 dB SPL. If the score in quiet was larger than 50%, administration of the LIST was done in noise as well, using an adaptive procedure. If, on the other hand, the average score on the LIST in quiet was lower than 50%, or if the result on the LIST in noise was worse than 10 dB SNR, a closed-set Dutch number test (LINT) (van Wieringen & Wouters, Citation2008) was added to the test battery. If the score on the LINT in quiet was greater than 50%, administration was also performed in noise. In addition, LIST and LINT scores were determined as the average of three adaptive runs.
Listening effort test
If the LIST or LINT had been administered in noise, a subjective test of self-reported listening effort was added to assess more subtle differences in speech perception, at a supra-threshold level. Such differences might be experienced by subjects, but are likely to remain undetected when using only standard speech recognition tests. In this test, the subject needed to indicate listening effort on a 13-point scale, ranging from “no effort” to “very much effort”. The speech material used was either the LIST or the LINT, depending on the subject, presented at six different signal-to-noise ratios (−6, −3, 0, +3, +6 and +9 dB). The signal-to-noise ratio as determined with the BM was taken as the reference (0) and was left unchanged in the second session with the EM.
Spectral ripple discrimination test
In the spectral ripple discrimination test, the subject was asked to discriminate between a spectrally rippled noise stimulus (a noise with sinusoidal variations in amplitude along the frequency axis) and the same stimulus shifted in phase (positions of the spectral peaks and valleys reversed). The spectral ripple discrimination test is considered to be a test of spectral resolution, which is supported by the correlations with other measures of spectral resolution, including spatial tuning curves (Anderson et al, Citation2011) and measures of channel interactions (Won et al, Citation2011; Jones et al, Citation2013). Our hypothesis was that spectral resolution, as assessed with the ripple discrimination test, improves with the experimental map. This is based on the reasoning that when indiscriminable electrodes are deactivated and all channels elicit different percepts, small differences in the spectral pattern across channels can be readily discerned.
For the spectral ripple stimuli, a Gaussian broadband noise carrier was used (120 – 7680 Hz), spectrally modulated on a log-frequency axis, as in Anderson et al (Citation2011). Ripple densities of 0.125, 0.176, 0.250, 0.354, 0.500, 0.707, 1.000, 1.414, 2.000, 2.828, 4.000, 5.657 and 8.000 ripples/octave (rpo) were created, with the peaks equally spaced on the log-frequency axis. The spectral modulation depth was held constant at 30 dB. The starting phase was 0° for the standard and 180° for the inversed stimuli. The duration of the stimuli was 500 ms, including a 30 ms Gaussian rise/fall time. Stimuli were presented in sound-field at 60 dB SPL and a ± 4 dB random level rove was added to avoid the influence of loudness cues. A psychophysical experiment was used to find the spectral ripple discrimination threshold per subject, which is the highest ripple density at which the subject can still discriminate two spectrally rippled stimuli with inverse positions of the peaks and valleys. Two standard and one inverse stimuli were presented per trial, in a 2-down-1-up 3-interval oddity adaptive procedure (Levitt, Citation1971). Each run started with a ripple density of 0.176. The mean of the last six out of ten reversals was used to establish the threshold, averaged over three runs.
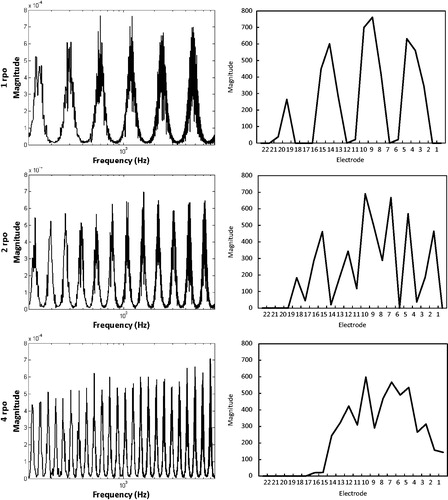
It is known that for ripple densities above 2.000 ripples per octave, the ripple pattern is no longer clearly represented in the processor’s output (Croghan et al, Citation2013). Spectrogram analysis of our own physical measurements confirmed this, as can be seen in for ripple densities 1.000, 2.000 and 4.000 rpo. We therefore did not expect subjects being able to discriminate between phase-inversed ripples when ripple densities were high.
Figure 1. Spectra of the spectral ripple input stimulus (left) and output spectra of a CI with 22 active electrodes (right), for ripple densities 1.000, 2.000 and 4.000 rpo.
Questionnaire
Subjective appreciation of both the BM and the EM was evaluated with a questionnaire consisting of 17 questions regarding primary sound processing, sense of safety and ease of communication. The questionnaire was completed at the beginning of each session and concluded with a Visual Analogue Scale asking subjects to score their general appreciation of the program, whether it is BM or EM. In the second session, subjects designated which program they preferred (BM, EM or no preference).
Materials
The determination of T-, MCL- and UCL-levels was performed using the subjects’ own speech processor and Cochlear’s clinical software Custom Sound™. For the loudness balancing and electrode discrimination testing, individual electrodes were stimulated with a L34 research processor in combination with Cochlear NIC research software and the APEX test platform (Francart et al, Citation2008). All words, numbers and sentences were administered in sound-field through a single speaker (Klein + Hummel O 110 D), positioned 1 m in front of the subject, connected to a laptop. The subjects used their own speech processor without a contralateral hearing aid. The APEX 3 test platform (Francart et al, Citation2008) was used to present the LIST and LINT stimuli. The listening effort test used the Oldenburg Measurement Applications software package, developed by Hörtech Oldenburg (www.hoertech.de). Stimuli for the spectral ripple discrimination test were created using MATLAB (The MathWorks, Inc., Natick, MA, USA).
Results
Electrode discrimination testing
All 22 electrodes were active in the clinical map of five of the six subjects. For subject 1 (S1), six electrodes could not be used for testing due to impedance problems. Pulse widths of 25 μs were used, except for subject 5 (S5), where the pulse width was changed to 50 μs due to out of compliance issues. The MCL of the central electrode, which was electrode number 12 for all six subjects, was on average 73% (range 63–79%) of the dynamic range between T- and UCL-levels.
Good test-retest reliability was indicated by the intra-class correlation coefficients (ICC) for agreement, which ranged from .744 to .968 for the two runs of the electrode discrimination test. The ranges of the EDDLs as well as the mean EDDL per subject are presented in . Difference limens ranged from 0.5 to 7.125 over all subjects and reference electrodes. Subjects’ average EDDLs ranged from 1.17 for the best (S2) to 3.88 for the worst performer (S5). For S1, the average value is preceded by a “≤” sign since there were a large number of deactivated electrodes contributing to an artificially-increased average.
Table 2. Electrode discrimination difference limen (EDDL) results, and parameters of the BM and EM per subject.
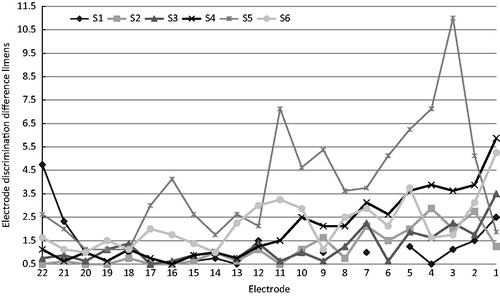
For each subject, the EDDLs are displayed in . When the last four reversals are alternately on the reference and adjacent comparison electrode, the resulting difference limen is 0.5 (i.e. perfect discrimination). A striking similarity between the discrimination patterns of all subjects except S1, were smaller EEDLs for the apical and mid-electrodes, and larger EDDLs for more basally located electrodes. When dividing reference electrodes into apical (electrodes 16–22), middle (electrodes 8–15) and basal (electrodes 1–7) and calculating the average EEDL for S2 to S6, mean EEDLs were 1.16, 1.86 and 3.3 for the apical, middle and basal categories respectively. S1 was excluded due to the large number of missing values. A one-way repeated measures ANOVA indicated that that the mean difference limen was significantly affected by electrode category (F= 18,84, df =2,8, p = 0.001). Pairwise comparisons with a Bonferroni correction revealed significant differences between apical and basal (p = 0.034), and between middle and basal (p = 0.024), but not between apical and middle (p = 0.149).
Figure 2. The electrode number of the reference electrode is represented on the X-axis; the electrode discrimination difference limen is displayed on the Y-axis. Reference electrode number 22 on the left is the most apical electrode; reference electrode number 1 is the most basal electrode. In case of perfect discrimination EDDLs would be 0.5 (lower boundary).
Comparing the basic and experimental map
The parameters of the basic map (BM) and the experimental map (EM) per subject can be found in . The number of deactivated electrodes based on the electrode discrimination results ranged from 4 (S1) to 14 (S5). The number of maxima was reduced for all subjects, with a reduction to four maxima for S5 and S6. For five out of six subjects the EM sounded softer than the BM; C-levels were therefore increased in live-mode by 3 to 7 CL for these subjects.
Speech understanding tests
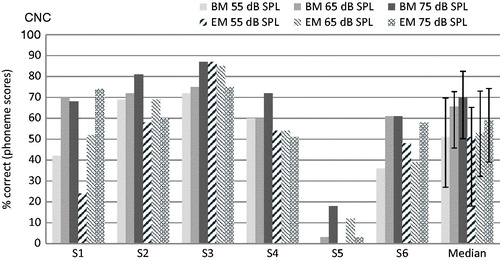
Individual subject and group median results for both the BM and the EM on the CNC monosyllabic word test are presented in . Although median scores were slightly lower with the EM for the 75 and 65 dB administration levels, these differences were not statistically significant according to the Wilcoxon signed-rank test (p = 0.893, p = 0.463 and p = 0.074 for the 55, 65 and 75 dB administration levels, respectively).
Figure 3. Individual and group median phoneme scores on the CNC test for the six subjects, with the BM and the EM, at 55, 65 and 75 dB SPL. Error bars for the median represent the interquartile range.
The LIST was administered in quiet to all subjects except S5, for whom the test was too difficult. The LINT in quiet was also administered to S2, S4, S5 and S6. Subject mean and group median results for both maps are presented in . The Wilcoxon signed-rank test revealed no significant difference between the scores obtained with the BM or the EM for the LIST (p = 0.414) or LINT (p = 1.0) in quiet. In order to analyze possible differences between BM and EM on an individual subject level, the smallest detectable change (SDC) in test score was calculated3. It represents the minimal change in score for this change to be real, that is, not due to measurement error. Based on the results of the five subjects on the LIST in quiet, the SDC was 12.4%. As can be seen in , only the difference score of S2 was statistically significantly larger than the SDC, indicating a lower recognition score when wearing the EM. On the LINT in quiet, none of the difference scores between BM and EM reached the SDC of 11% ().
Figure 4. Subject mean and group median % correct scores on the LIST and/or LINT in quiet for all subjects, with the BM and the EM. Error bars represent 1 SD for the subject means and the interquartile range for the group median scores.
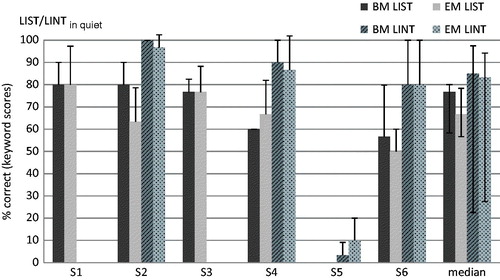
Table 3. Individual difference scores averaged over three measurements.
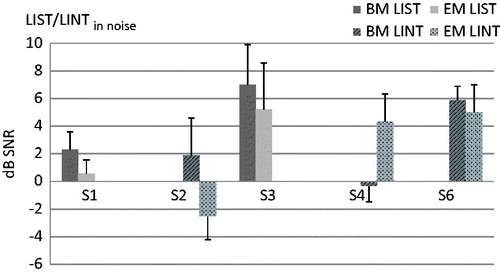
On the LIST in noise, only two (S1 and S3) of the five tested subjects obtained a signal-to-noise ratio better than 10 dB SNR. The LINT in noise was therefore administered to S2, S4 and S6 instead. S5 was not able to perform a test in noise. Individual results with the BM and EM on either the LIST or LINT in noise can be seen in . For S1 and S3, results were slightly better with the EM, with difference scores larger than the smallest detectable change of 1.17 dB SNR (). This is lower than the 1.8 dB SNR obtained for a group of 17 post-lingual CI users (unpublished data), indicating that the slightly better scores for S1 and S3 do not represent a clinically relevant improvement. On the LINT in noise, an improvement greater than 1.5 dB was obtained by S2 and S4, with S2 performing significantly better and S4 significantly worse for the EM. For S6 there was no significant difference. For the LIST in noise, calculation of the SDC was based on the results of just three subjects.
Figure 5. Subject mean scores in dB SNR on the LIST or LINT in noise, for all subjects except S5. Error bars represent 1 SD.
Listening effort test
The Listening effort test was administered to all subjects except S5. There was no difference between the BM and the EM for either the total listening effort averaged over the six signal-to-noise-ratios (p = 0.68) or for any of the separate signal-to-noise-ratios, indicating no change in listening effort in noise.
Spectral ripple discrimination test
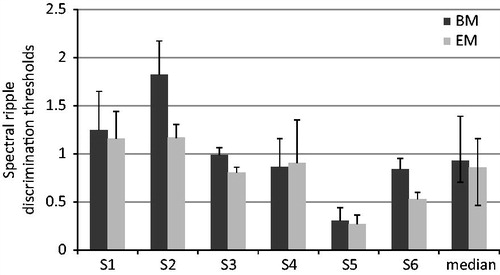
The spectral ripple test was administered to all six subjects. The individual discrimination thresholds ranged from 0.303 to 1.823 rpo for the BM and from 0.267 to 1.167 rpo for the EM as can be seen in . The median threshold was 0.925 rpo with the BM and 0.855 rpo with the EM, this difference not being statistically significant (Wilcoxon signed-rank test, p = 0.075). On an individual subject level, the result with the EM was statistically significantly worse for both S2 and S6, for whom the SDC was 0.26 rpo ().
Figure 6. Subject mean and group median ripple discrimination thresholds for the BM and the EM. Error bars represent 1 SD for the subject mean and the interquartile range for the group median scores.
Questionnaire
Questionnaire scores obtained for the BM and the EM did not differ (p = 0.225, Wilcoxon signed-rank test). The EM was attributed a statistically significantly lower score for the Visual Analogue Scale (p = 0.042, Wilcoxon signed-rank test). Three out of six subjects indicated “no preference” regarding the BM or EM programs, while two preferred the BM and one the EM.
Discussion
The absolute electrode discrimination difference limens (EDDLs) found in this study concurred with those found in other studies with prelingually deafened subjects (Busby & Clark, Citation1996, Citation2000). Although four out of our six subjects obtained a difference limen of 0.5 for at least one reference electrode, the observed range in difference limens (0.5 to 7.125) confirms that in many cases adjacent and even further separated electrodes cannot be discriminated by this group of CI-users. A limitation of the adaptive method used to determine the EDDL however, is that it assumes that discrimination improves when electrodes are further apart, which is not always necessarily the case, for instance, when there is a tip fold-over of the electrode array.
A striking observation in this study is the clearly poorer performance for the basal reference electrodes. This pattern was also found by Zwolan et al (Citation1997) in their three early deafened subjects, Henry et al (Citation2000) for post-lingually deafened subjects, and in a pitch discrimination study by Kwon & van den Honert (Citation2006). However, Busby & Clark (Citation2000) did not observe a poorer performance basally, although electrode number 8 was the most basal reference electrode tested. A plausible explanation may be that most of our subjects did not like the sharp, often unpleasant sensation caused by stimulation of the basal electrodes, hampering discrimination tasks for these electrodes. Secondly, it may be that during the loudness balancing procedure, a drift occurred towards the basal electrodes. In this way, balanced levels could have become gradually softer, again due to the sharp sensation of stimulation on these electrodes, which in turn made discrimination more difficult. Thirdly, it is known that the amount of surviving spiral ganglion cells diminishes with a long period of profound deafness (Hardie & Shepherd, Citation1999). As suggested by Pfingst et al (Citation2008), the number and condition of the activated neurons might be inferior at “ineffective” sites. It can be hypothesized that there are likely to be less surviving spiral ganglion cells in the basal region of the cochlea, where duration of deafness can be expected to be the longest for most subjects with prelingual extensive hearing loss.
For the sample as a whole, no significant differences were found between the two maps on either the CNC test or the LIST in silence. Sample comparison of the BM and EM could not be made for the speech tests in noise. At the individual subject level some significant differences were found between BM and EM, albeit not always in the same direction. Given that the SDC calculations were based on a small number of subjects, they were likely smaller than the true SDC’s, as was illustrated for the LIST in noise. Hard conclusions can therefore not be drawn. This together with the fact that subjects did not experience a change in the amount of effort they needed to listen to and understand sentences or numbers in noise may be an indication that our findings are due to chance, and that there is no difference in speech understanding between the basic and the experimental map.
The findings of the present study are not in agreement with those by both Zwolan et al (Citation1997), and more recently Saleh et al (Citation2013), who found significant improvements on tests of speech understanding, for at least some of their subjects, when the map contained only discriminable electrodes. There are a number of possible explanations for this lack of concordance.
First, the use of the MPEAK strategy by Zwolan et al (Citation1997) compromises comparison to results obtained with current speech processing strategies, like ACE. The MPEAK strategy specifically encodes F1 and F2 by stimulating individual electrodes; therefore it makes sense that by enlarging the contrast between the electrodes used for the representation of F1 and F2, speech understanding scores improve.
Second, it might be that the reduction of the number of maxima in the present study had a negative influence on performance with the experimental map. Plant et al (Citation2002) found that varying the number of maxima between 6 and 16 had little effect on speech understanding in silence, but that a 6-maxima program was significantly worse in noise. It has also been described by Qazi et al (Citation2013) that “wrong maxima selection” is likely to occur when listening to speech in noise with the ACE strategy, with a large portion of maxima being occupied by noise. The reduction in number of maxima could therefore have influenced our results in noise, but not in silence. It can be assumed that this factor did not have an effect on the results by Saleh et al (Citation2013), since they used a variety of speech processing strategies, and did not mention a reduction of maxima for the Nucleus® users.
Moreover, the prelingually deafened subjects in the present study might not have been completely adjusted to the altered frequency allocation consequent to the deactivation of electrodes. Zwolan et al (Citation1997) applied the default frequency allocation available in the software for both maps, but given the use of the MPEAK strategy this redistribution is likely to have had fewer consequences, and a positive effect of the experimental map could occur even without an adjustment period. In the more recent study by Saleh et al (Citation2013) it is not mentioned how the frequency allocation is changed, although it can be assumed that re-allocation was automatically implemented by the CI software of the various brands. In their study, just as in the present one, subjects were given one month to adapt to the experimental program since it is known that changes in frequency allocation require an adjustment period. Fu et al (Citation2002) found that three months of experience with a map that had a severely shifted frequency allocation was not enough to attain the original level of speech understanding of three experienced CI listeners. A model was developed based on these results, which suggested that these subjects were not able to completely alter their internal representations or “phoneme labels”, in favour of the new situation (Sagi et al, Citation2010). In the current study, some subjects explicitly reported that the EM required an adjustment with respect to how everything sounded. It is possible that prelingually deafened CI users generally require more time to form stable internal representations of sounds, especially given their limitations on a central auditory level, and that the one month adaptation period in this study was not sufficient to adjust to the albeit limited frequency shift.
The fourth factor that might have limited the potential improvement with the EM in this study is related to the fact that deactivated electrodes were mainly located in the basal part of the array. This improved resolution mainly in the high-frequency region, whereas fine spectral resolution is more important for low to mid-frequencies (McKay, Citation2005). Also, Henry et al (Citation2000) only found a significant correlation between electrode discrimination abilities and speech information only up to 2680 Hz. Details regarding the deactivation pattern were not provided by Saleh et al (Citation2013).
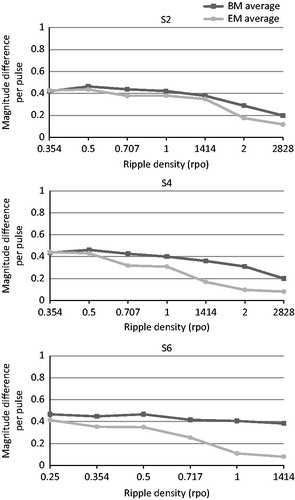
Spectral ripple discrimination thresholds also did not differ between the BM and the EM. At the individual subject level, S2 and S6 even performed significantly worse with the EM. Our hypothesis that a map consisting of discriminable channels leads to better performance on a test of spectral resolution was therefore not confirmed. We wondered whether this could be explained by the reduction in the number of electrodes. Shifted channels are broader in the EM than in the BM and contain a larger frequency range. When ripple density increases, there is an increased possibility that both a peak and a valley fall into the same frequency band, thus reducing the number of peaks and valleys and flattening the output spectrum. This was verified by measuring the electrode outputs of spectral ripple stimuli with different ripple densities presented in sound field to a Nucleus® sound processor that contained the exact maps of our subjects. A Nucleus® Freedom™implant emulator was used for the recordings and data were analyzed with MATLAB (The MathWorks, Inc.). An illustration of the differences between the basic and experimental maps of S2, S4 and S6, who had a relatively decreasing number of active electrodes in their EM, can be seen in for the 1 rpo stimulus: the output spectrum is increasingly flattened with the EM for S2 to S6, when the number of active electrodes becomes smaller. The flattening generally occurred at lower ripple densities when the map contained less than 22 active electrodes. We obtained an estimation of the amount of available contrast for both BM and EM, per subject and per ripple density. We wanted to see if possible differences in the amount of contrast between the BM and EM, could be related to the subjects’ actual ripple discrimination performance. We did this by calculating the difference between outputs of the phase-shifted stimuli and averaging them over the electrodes according to the method described by Croghan et al (Citation2013); . For S2 and S6 a significant difference in performance between the BM and EM was found on the ripple test. The majority of reversals in the adaptive procedure of S6 occurred at 0.707 rpo with the EM, while for the BM the stimulus with 0.707 rpo was mostly discriminated correctly. It can be seen in that the average difference between the output spectra for the phase-shifted stimuli was smaller for the EM, and declined more rapidly from 0.5 rpo onwards for the EM, whereas it remained constant for the BM. This may explain the worse performance by S6 for the EM. At the same time, S2 also performed worse for the EM, although there were no clear differences between BM and EM at 1.414 rpo which is the density of S2 could almost never discriminate in the adaptive procedure for the EM. No significant difference was found between ripple thresholds of S4, whereas a smaller contrast with the EM is clearly visible in , starting from 0.707 rpo. For the remaining subjects S1, S3 and S5, the ripple densities where reversals occurred during the adaptive procedure were well below the ripple densities where the output spectrum became seriously disturbed. Therefore, we conclude that the amount of available spectral contrast available in the spectral ripple stimuli, and the reductions herein with the EM, could not be related to the ripple discrimination results.
Figure 7. Output spectra for the 1 rpo spectral ripple stimuli obtained for the BM (left) and EM (right) of S2 (top), S4 (middle) and S6 (bottom).
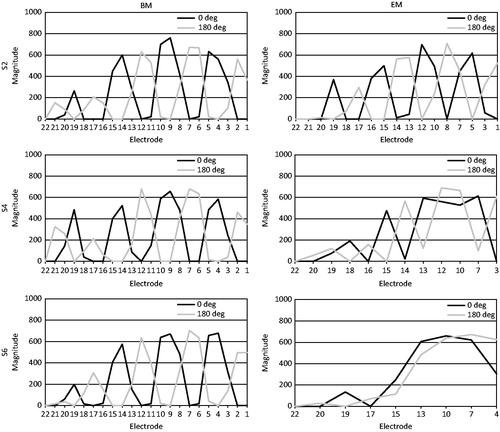
Figure 8. Average difference between output spectra of the phase-shifted stimuli of increasing ripple densities, ranging from 0.354 to 2.828 rpo for S2 and S4, and from 0.25 to 1.414 rpo for S6. The dark grey line represents the contrasts measured with the BM, the light grey line represents the contrasts measured with the EM.
Finally, the fact that there were no significant differences between BM and EM for the questionnaire concurs with the other results. For the Visual Analogue Scale, the EM rated statistically significantly lower than the BM which may be attributable to the required adjustment to the sound quality of the EM. Or it might be simply because our subjects did not feel as comfortable with the new map as with the old one, reflecting the adjustment to the internal representations of (speech) sounds.
Conclusions
In this study, the electrode discrimination abilities of six prelingually deafened CI users were investigated. The electrode discrimination difference limens ranged from 0.5 to 7.125 over all subjects and reference electrodes, confirming our first hypothesis that subjects were not able to discriminate between all adjacent electrodes. Across-site variations were observed, with significantly larger limens for basally located electrodes. Based on these findings, an experimental map containing only discriminable electrodes was devised to test our second hypothesis, which was whether such a map could improve auditory performance. However, this experimental map did not appear to be superior to the basic map for any of the subjects, on tests of speech understanding in quiet and in noise, spectral ripple discrimination or listening effort. Moreover, subjects generally preferred the basic to the experimental map. Our second hypothesis was therefore not confirmed. Factors that may have influenced the observed outcomes were (1) the reduction in the number of maxima in the experimental map, (2) the possibility that the adaptation period of four weeks was too short for these prelingually deafened subjects to become accustomed to the altered frequency allocation, and (3) the fact that a large proportion of the deactivated electrodes were located in the basal region of the cochlea, where fine spectral resolution is less important.
The current study was based on the results of only six subjects, hereby limiting generalizability. Besides testing more subjects, the following recommendations for future studies can be made: use electrode discrimination performance to adjust CI fitting, avoid reducing the number of maxima (in case of the ACE strategy) and create a good balance of deactivated electrodes along the array. It may also be advisable to extend the adaptation period with the new map, or to perform the experiment in a cohort of recently implanted prelingually deafened adults, who have not yet become accustomed to a particular frequency allocation.
| Abbreviations | ||
| CI | = | Cochlear Implant |
| BM | = | Basic Map |
| EM | = | Experimental Map |
| EDDL | = | Electrode Discrimination Difference Limen |
| T | = | Threshold |
| MCL | = | Most Comfortable Loudness |
| UCL | = | Uncomfortable Loudness |
| pps | = | pulses per second |
| PW | = | Pulse Width |
| CL | = | Current Level |
| WPM | = | Words per minute |
| rpo | = | ripples per octave |
| SDC | = | Smallest Detectable Change |
| SEM | = | Standard Error of Measurement |
Declaration of interest
The authors report no conflicts of interest. The authors alone are responsible for the content and writing of this article.
This work was financially supported by Cochlear Cochlear™. The third author provided statistical support made possible by a grant from the Dutch Heinsius-Houbolt Foundation.
Acknowledgments
The authors wish to thank the subjects for their time and effort.
Notes
Notes
1. For our adaptive procedure, the roving range was calculated as the averaged difference between the balanced levels of the two runs of all electrode pairs, which is an estimation of the amount of error after the balancing procedure, divided by .69. If, for example, the average difference between the results of run 1 and run 2 for a subject was 4 CL, the roving range R needed to be at least 5.8 ≈ 6 CL. This roving range was then applied on each side of the balanced loudness level of each electrode: if the balanced MCL-level was 150 CL, the loudness was randomly roved between 147 and 153 CL for that electrode.
2. With this algorithm, the channel frequency boundaries are redistributed in a way that they increase linearly up to 1 kHz and logarithmically above 1 kHz, with relatively narrow apical channels and broader basal channels.
3. The Smallest Detectable Change (SDC) is calculated as 1.96 × √2 × SEM. The standard error of measurement (SEM) is based on the square root of the error variance of the ICC model for consistency, and divided by three given that there are three repeated measures.
References
- Anderson, E.S., Nelson, D.A., Kreft, H., Nelson, P.B. & Oxenham, A.J. 2011. Comparing spatial tuning curves, spectral ripple resolution, and speech perception in cochlear implant users. J Acoust Soc Am, 130, 364–375.
- Bosman, A. & Smoorenburg, G.F. 1995. Intelligibility of Dutch CVC syllables and sentences for listeners with normal hearing and with three types of hearing impairment. Audiology, 34, 260–284.
- Buckley, K.A. & Tobey, E.A. 2011. Cross-modal plasticity and speech perception in pre- and postlingually deaf cochlear implant users. Ear Hear, 32, 2–15.
- Busby, P.A., & Clark, G.M. 1996. Electrode discrimination by early-deafened cochlear implant patients. Audiology, 35, 8–22.
- Busby, P.A. & Clark, G.M. 2000. Electrode discrimination by early-deafened subjects using the cochlear limited multiple-electrode cochlear implant. Ear Hear, 21, 291–304.
- Butler, B.E. & Lomber, S.G. 2013. Functional and structural changes throughout the auditory system following congenital and early-onset deafness: Implications for hearing restoration. Front Neurosci, 7, 92.
- Caposecco, A., Hickson, L. & Pedley, K. 2012. Cochlear implant outcomes in adults and adolescents with early-onset hearing loss. Ear Hear, 33, 209–220.
- Chatterjee, M. & Yu J. 2010. A relation between electrode discrimination and amplitude modulation detection by cochlear implant listeners. J Acoust Soc Am, 127, 415–426.
- Croghan, N.B.H., Krishnamoorthi H. & Smith Z.M. 2013. What does spectral ripple discrimination at high ripple densities mean in cochlear implant listening experiments? Poster presented at the Conference on Implantable Auditory Prostheses, Lake Tahoe, California.
- Dai, H. & Micheyl, C. 2010. On the choice of adequate randomization ranges for limiting the use of unwanted cues in same-different, dual-pair, and oddity tasks. Atten Percept Psychophys, 72, 538–547.
- Drennan, W.R., Anderson, E.S., Won, J.H. & Rubinstein, J.T. 2014. Validation of a clinical assessment of spectral-ripple resolution for cochlear implant users. Ear Hear, 35, e92–e98.
- Fayad, J.N. & Linthicum, F.H. 2006. Multichannel cochlear implants: Relation of histopathology to performance. Laryngoscope, 116, 1310–1320.
- Francart, T., van Wieringen, A. & Wouters J. 2008. APEX 3: A multi-purpose test platform for auditory psychophysical experiments. J Neurosci Methods, 172, 283–293.
- Friesen, L.M., Shannon, R.V. & Cruz, R.J. 2005. Effects of stimulation rate on speech recognition with cochlear implants. Audiol Neurootol, 10, 169–184.
- Fu, Q.J., Shannon, R.V. & Galvin, J.J. 3rd, 2002. Perceptual learning following changes in the frequency-to-electrode assignment with the Nucleus-22 cochlear implant. J Acoust Soc Am, 112, 1664–1674.
- Gordon, K.A., Wong, D.D.E., Valero, J., Jewell, S.F., Yoo, P., et al. 2011. Use it or lose it? Lessons learned from the developing brains of children who are deaf and use cochlear implants to hear. Brain Topogr, 24, 204–219.
- Hardie, N.A. & Shepherd, R.K. 1999. Sensorineural hearing loss during development: Morphological and physiological response of the cochlea and auditory brainstem. Hear Res, 128, 147–165.
- Henry, B.A., McKay, C.M., McDermott, H.J. & Clark, G.M. 2000. The relationship between speech perception and electrode discrimination in cochlear implantees. J Acoust Soc Am, 108, 1269–1280.
- Jones, G.L., Won, J.H., Drennan, W.R. & Rubinstein, J.T. 2013. Relationship between channel interaction and spectral-ripple discrimination in cochlear implant usersa). J Acoust Soc Am, 133, 425–433.
- Kral, A., Tillein, J., Heid, S., Hartmann, R. & Klinke, R. 2005. Postnatal cortical development in congenital auditory deprivation. Cereb Cortex, 15, 552–562.
- Kral, A. 2007. Unimodal and cross-modal plasticity in the 'deaf' auditory cortex. Int J Audiol, 46, 479–493.
- Kral, A. 2013. Auditory critical periods: A review from system’s perspective. Neuroscience, 247, 117–133.
- Kwon, B.J. & van den Honert, C. 2006. Dual-electrode pitch discrimination with sequential interleaved stimulation by cochlear implant users. J Acoust Soc Am, 120, EL–E6.
- Laneau, J., & Wouters, J. 2004. Multichannel place pitch sensitivity in cochlear implant recipients. J Assoc Res Otolaryngol, 5, 285–294.
- Levitt, H. 1971. Transformed up-down methods in psychoacoustics. J Acoust Soc Am, 49, Suppl 2, 467.
- McKay, C.M. 2005. Spectral processing in cochlear implants. Int Rev Neurobiol, 70, 473–509.
- Pfingst, B.E., Burkholder-Juhasz, R.A., Zwolan, T.A., & Xu L. 2008. Psychophysical assessment of stimulation sites in auditory prosthesis electrode arrays. Hear Res, 242, 172–183.
- Plant, K.L., Whitford, L.A., Psarros, C.E. & Vandali, A.E. 2002. Parameter selection and programming recommendations for the ACE and CIS speech-processing strategies in the Nucleus 24 cochlear implant system. Cochlear Implants Int, 3, 104–125.
- Qazi, O.R., van Dijk, B., Moonen, M. & Wouters, J. 2013. Understanding the effect of noise on electrical stimulation sequences in cochlear implants and its impact on speech intelligibility. Hear Res, 299, 79–87.
- Sagi, E., Fu, Q.J., Galvin, J.J. & Svirsky, M.A. 2010. A model of incomplete adaptation to a severely shifted frequency-to-electrode mapping by cochlear implant users. J Assoc Res Otolaryngol, 11, 69–78.
- Saleh, S.M., Saeed, S.R., Meerton, L., Moore, D.R. & Vickers, D.A. 2013. Clinical use of electrode differentiation to enhance programming of cochlear implants. Cochlear Implants Int, 14 Suppl 4, 16–18. S
- Shannon, R.V., Cruz, R.J. & Galvin, J.J. 2011. Effect of stimulation rate on cochlear implant users' phoneme, word and sentence recognition in quiet and in noise. Audiol Neurootol, 16, 113–123.
- Sharma, A., Nash, A.A. & Dorman, M.F. 2009. Cortical development, plasticity and re-organization in children with cochlear implants. J Commun Disord, 42, 272–279.
- Snik, A.F., Makhdoum, M.J., Vermeulen, A.M., Brokx, J.P. & van den Broek, P. 1997. The relation between age at the time of cochlear implantation and long-term speech perception abilities in congenitally deaf subjects. Int J Pediatr Otorhinolaryngol, 41, 121–131.
- Teoh, S.W., Pisoni, D.B. & Miyamoto, R.T. 2004. Cochlear implantation in adults with prelingual deafness. Part I. Clinical results. Laryngoscope, 114, 1536–1540.
- Tong, Y.C., Busby, P.A. & Clark, G.M. 1988. Perceptual studies on cochlear implant patients with early onset of profound hearing impairment prior to normal development of auditory, speech, and language skills. J Acoust Soc Am, 84, 951–962.
- Van den Broek, P., Admiraal, R.J., Brokx, J., Mens, L. & Spies, T. 1992. Results of cochlear implants in totally deaf subjects. Ned Tijdschr Geneeskd, 136, 1404–1409.
- van Wieringen, A. & Wouters, J. 2008. LIST and LINT: Sentences and numbers for quantifying speech understanding in severely impaired listeners for Flanders and the Netherlands. Int J Audiol, 47, 348–355.
- Won, J.H., Drennan, W.R., Rubinstein, J.T. 2007. Spectral-ripple resolution correlates with speech reception in noise in cochlear implant users. J Assoc Res Otolaryngol, 8, 384–392.
- Won, J.H., Jones, G.L., Drennan, W.R., Jameyson, E.M. & Rubinstein, J.T. 2011. Evidence of across-channel processing for spectral-ripple discrimination in cochlear implant listeners. J Acoust Soc Am, 130, 2088–2097.
- Xu, H., Kim, G. & Al, E. 2012. Multi-channel cochlear implant histopathology: Are fewer spiral ganglion cells really related to better clinical performance?. Acta Otolaryngol, 132, 482–490.
- Zwolan, T.A., Collins, L.M. & Wakefield, G.H. 1997. Electrode discrimination and speech recognition in postlingually deafened adult cochlear implant subjects. J Acoust Soc Am, 102, 3673–3685.