
Abstract
Objective: Sounds in the daily environment may cause loudness and annoyance. The present study investigated the perception of loudness and annoyance for eight different sounds present in a daily sound environment and at nine different levels varying by ±20 dB around the recorded level. The outcomes were related to tests of participants’ auditory and cognitive abilities. Design: The participants undertook auditory and working memory (WM) tests prior to ratings of everyday sounds previously shown to be disturbing for persons with hearing impairment (hearing aid users). Study sample: Twenty-one participants aged between 24 and 71 years, with normal hearing threshold levels. Results: Both perceived loudness and annoyance were primarily driven by the sound level. Sounds emitted from paper were rated as having greater loudness and being more annoying than the other sound sources at the same sound level. Auditory and cognitive abilities did not influence the perception of loudness and annoyance. Conclusions: Loudness and annoyance ratings were mainly driven by sound level. Expectations of a sound seemed to influence the assessment of loudness and annoyance while auditory performance and WM capacity showed no influence on the ratings.
Introduction
The daily acoustic environment contains sounds with large spectral and temporal variations (Raimbault & Dubois, Citation2005; Irwin et al, Citation2011). Many of those sounds can be described as noise. Noise is considered to be disturbing, as it affects the ability to perceive wanted signals, e.g. to understand speech. Most people are exposed to disturbing sounds and their negative effects (Laszlo et al, Citation2012; Sjodin et al, Citation2012). Some of the negative effects of disturbing sounds are masking of wanted sounds, stress, sound fatigue and distraction (Sjodin et al, Citation2012; Canlon et al, Citation2013). Skagerstrand et al. (Citation2014) showed that the majority of people with normal hearing or with hearing impairment who used hearing aids experience disturbing sounds in the daily environment. For hearing aid users, this may reduce hearing aid usage (Kochkin, Citation2005; McCormack & Fortnum, Citation2013; Skagerstrand et al, Citation2014) and thereby reduce the ability to perceive wanted signals. Sounds often mentioned as annoying in the study of Skagerstrand et al. (Citation2014) were verbal human sounds and sounds from TV/radio, vehicles/machines, and porcelain. These sounds were not disturbing or annoying all the time. The participants in the study of Skagerstrand et al. (Citation2014) did not rate the level of annoyance, they only judged if the sounds were perceived as annoying or not.
The perception of disturbing sounds can be affected by many parameters, both acoustical and psychological. Two perceptual aspects were chosen to be studied: loudness and annoyance. Berglund et al. (Citation1976) argued that there was a strong correlation between noisiness, loudness, annoyance and sound pressure level, although they also discussed the possibility of other factors affecting disturbance. It is generally accepted that the intensity of a sound has a large impact on loudness perception. Kumar et al. (Citation2008) argued that the unpleasantness of a sound is primarily associated with the intensity of the sound for frequencies between 2.4 and 5.5 kHz. Loudness is a commonly used concept with a variety of definitions, all describing the perception of sound magnitude. Fletcher & Munson (Citation1933) described loudness as a “psychological term used to describe the magnitude of an auditory sensation”, and pointed out the complexity in judgment of sounds. Loudness is here defined as “the attribute of auditory sensation in terms of which sounds can be ordered on a scale extending from quiet to loud” (Moore, Citation2004, p. 127). It is influenced by the spectral content and temporal variations of the sound as well as by intensity.
Annoyance is a psychological phenomenon vaguely defined in previous research as a reaction to noise but also as an issue of health, e.g. stress-related symptoms (Stansfeld & Matheson, Citation2003; Gidlöf-Gunnarsson & Öhrström, Citation2007; Basner et al, Citation2014). In this study, we use the definition in ISO 15 666 (SIS, Citation2002): “annoyance: a person’s individual adverse reaction to noise”. The term reaction to noise denotes an emotional response and may be related to dissatisfaction and bother due to the sound (Holm Pedersen, Citation2007).
The acoustics of a sound, degree of hearing impairment and cognition are factors that may influence the perception of loudness and annoyance. Schlittmeier et al. (Citation2015) showed that both attention and memory functions were affected by background noise. For a long duration sound, such as a sentence, Glasberg & Moore (Citation2002) argued that judgement of long-term loudness probably involved high-level cortical processes thereby involving memory functions. Lee & Jeon (Citation2013) found that annoyance from multiple noise sources correlated negatively with a free recall memory task while Alimohammadi et al. (Citation2013) did not find a correlation between rated annoyance from low-frequency noise and the speed on a Stroop test.
A cognitive ability shown to be affected by noise is working memory (WM) (Jahncke et al, Citation2011; Hua et al, Citation2014), a cognitive system that involves short time storage and processing with a limited capacity (Daneman & Carpenter, Citation1980). People with good WM capacity can expend more effort to extract a target signal in noise than people with poor WM capacity, resulting in better performance (Rönnberg et al, Citation2016). Moreover, people with good WM capacity are better at ignoring irrelevant signals than people with poor WM capacity (Sorqvist et al, Citation2012). The ability to attend to an auditory signal and supress unwanted sounds is influenced by both auditory factors and WM capacity (Mattys et al, Citation2012; Oberfeld & Klockner-Nowotny, Citation2016). Consequently, WM capacity may influence the ability to ignore surrounding sounds and thereby influence the annoyance caused by the sound. However, whether cognitive capacity, such as WM, interacts with perceived annoyance has not been reported.
In the study of Skagerstrand et al (Citation2014), sounds perceived as annoying were categorised into 18 groups. The sounds were reported to be annoying but were not rated for degree of annoyance and it was not obvious why some sounds were perceived as annoying or if some sounds were more annoying than others. To investigate this further, the eight sound sources most mentioned from that study, except verbal human sounds, were chosen to evaluate the perception of loudness and annoyance, the relationship between the two, and the possible influence of WM.
In summary, the aims of the study were to investigate the annoyance and loudness of eight everyday sound sources as a function of sound pressure level for participants with normal hearing and to explore if auditory tests and tests of WM were correlated with ratings of loudness and annoyance.
Method
The study was approved by the regional ethical committee in Uppsala, Sweden, Dnr 2008/059.
Participants
Inclusion criteria for participation were: age between 18 and 80 years, hearing threshold levels for the audiometric frequencies (0.125–8 kHz) 20 dB HL or better for both ears, and present transient otoacoustic emissions (TEOAEs) at frequencies between 1.0 and 4.0 kHz measured at 84 dB peSPL. Participants were recruited by an advertisement in the county daily newspaper. In total, 37 people expressed interest in participating, and 21 of these met the inclusion criteria and participated in the study. The excluded people (16) had a hearing loss exceeding 20 dB HL. Prior to inclusion, the baseline pure tone hearing thresholds were measured with the Hughson-Westlake procedure in a sound proof booth for both air and bone conduction using an Interacoustic AC40 audiometer calibrated according to IEC 60645-1 (IEC, Citation2012). To investigate the integrity of the outer hair cells, TEOAEs were measured bilaterally at 84 dB peSPL with an Otodynamics ILO OAE system version 6. The TEOAEs were measured in half-octave wide bands with centre frequencies 1.0, 1.4, 2.0, 2.8 and 4.0 kHz. Six of the participants were male and 15 were female and the participants had a mean age of 55 years (range 24-71 years). All participants gave informed consent prior to their participation in the study.
No reimbursements were made to the participants.
Measurements
Measurements are described according to the test order. The test sessions lasted between 2 and 3 hours, with the possibility of pausing when needed. Sensitivity to intense sounds was assessed by measuring uncomfortable levels for pure tones (UCL) at 0.25, 0.5, 1, 1.5, 2, 3 and 4 kHz. The maximum level used was 110 dB HL. The ability to understand speech in noise was estimated using the Swedish hearing in noise test (HINT) (Hällgren et al, Citation2006). This was done in a sound field with speech and noise from one loudspeaker at 0° azimuth using the AC40 audiometer. The speech signal was fixed at a level of 60 dB SPL and the noise level was adaptively varied in steps of 2 dB, as described in Hällgren et al. (Citation2006). To investigate subjective noise sensitivity, the Weinstein questionnaire was used (Weinstein, Citation1978). This consists of 20 statements with degrees of agreement graded from 1 to 6.
WM capacity was assessed by the Reading Span Test (Daneman & Carpenter, Citation1980). This test examines WM using a dual task. The participant is requested to process three-word sentences by judging them as semantically correct or not, e.g. “The ball bounced low” or “The chisel laughed quietly” (translated from Swedish). After a certain number of sentences (3–5), the participant is prompted to repeat either the first or last word in each sentence, in order of appearance. Before testing, a training session with two sentences was presented. In the current implementation, the number of sentences before word recall was 3, 4 and 5, each presented twice. Consequently, the maximum score for correct word recall was 24 (Rönnberg et al, Citation1989).
The loudness and annoyance of the sounds were assessed using rating tests (Cox et al, Citation1997). The tests were performed in an anechoic chamber at the Audiological Research Centre, Örebro, Sweden, and the sounds were presented via a Tannoy system 800 loudspeaker (frequency range 0.02–20 kHz) in front of the listener. The system was calibrated, both prior to and after testing, to ensure correct sound levels at the position of the centre of the participant’s head (with the listener absent). The participants rated loudness and degree of annoyance on labelled scales, as described in , where higher ratings indicate that the sound was perceived as louder or more annoying.
Table 1. Rating test labels.
The ratings were obtained for eight sounds each presented at nine levels. The sound types and levels were randomly ordered across participants. Each sound level was presented to each participant 3–4 times for estimation, as previous studies suggest that two to four estimates are adequate for a reliable result in loudness rating (Robinson & Gatehouse, Citation1996). The number of presentations at each level for an individual was based on the investigator’s assessment of the certainty of the participant. The ratings were made separately for loudness and annoyance. The participants were carefully instructed about the difference between loudness and annoyance (see definitions in the introduction). All participants received the same instructions and were allowed to ask questions if anything was unclear. The instructions, orally given separately for loudness and annoyance, were: “You will hear short audio examples, one type of sound at a time. There will be audio examples from documents, newspaper, traffic, electric mixer, power drill, porcelain, cutlery, and water. You will hear one sound sample at a time, each sound several times where the strength will vary. The strength of the sound will never be more intense than the uncomfortable level we measured earlier. For each short sound example, I want you to assess how loud you think that the sound is on this 7-point scale. Try to evaluate the sound just as a sound, and not on what kind of sound it is. In the next part, I want you to assess how annoying you experience the sounds, on this 7-point scale. If you find the sound annoying and, only if you perceive it as such, how annoying you find it. Try to ignore the loudness of the sound and just assess the annoyance”.
Stimuli
Eight of the sounds identified as disturbing by most participants in daily situations in a previous study (Skagerstrand et al, Citation2014) were chosen for the current study. These were sounds from: (1) flipping through documents, (2) turning pages in a newspaper, (3) traffic, (4) electric mixer, (5) power drill, (6) hitting porcelain, (7) clanging of cutlery and (8) running water in the sink. For high ecology, all stimuli were recorded in an authentic environment. The sound of traffic was recorded along a main road in a city of 100,000 inhabitants during an afternoon and the other sounds were recorded in a reverberant home environment with background sounds from e.g. ventilation and refrigerator allowed. The recordings and the sound measurements were made at the position of the ear of a listener. The levels of the sound sources at the time of recording were measured by a sound level metre (Brüel & Kjær 2260) with third-octave bandwidth resolution and fast time weighting (125 ms integration time). The recorded levels were used as the “normal” playback level during the sound ratings. The levels of the sounds were randomly varied over a range of ±20 dB around the recorded level in steps of 5 dB during the rating procedure. This resulted in nine levels for each sound, each presented repeatedly until the participant had rated the sound. To prevent uncomfortable and hazardous stimulation levels, the maximum level was set at 100 dB SPL (RMS). This meant that for three sounds (cutlery, electric mixer, power drill), the maximum level was 15 dB above the recorded level and eight levels were rated for those sounds.
Loudness predictions
To enable comparison between perceived loudness and predicted loudness the loudness of the sounds was estimated using the 2014TV Model, a loudness model for time varying sounds (Moore, Citation2014). The predictions of loudness were computed in MatLab R2008A (MathWorksTM) using the recorded waveform as input and scaled over the range of ±20 dB as for the rated sounds. In the model, the free-field frontal incidence function was used. No correction for the frequency response of the loudspeaker was used. For the analysis, the maximum value of the long-term loudness was used (Glasberg & Moore, Citation2002).
Acoustic features of the sound stimuli
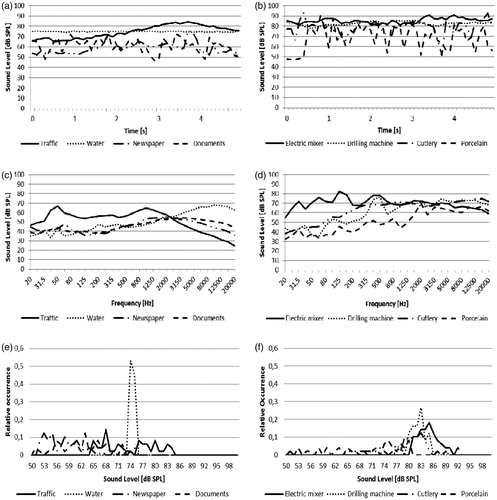
The temporal and spectral properties and the amplitude histograms of the sounds were analysed with the PULSE software from Brüel & Kjær. The results of the analysis are presented in .
Figure 1. (a and b) Temporal, (c and d) spectral and (e and f) relative occurrence of sound pressure level for the sound stimuli. The left panel shows sound from traffic, water, newspaper, and documents, and the right panel sound from electric mixer, drilling machine, cutlery and porcelain.
Statistical analysis
Statistical analysis was conducted to reveal associations, if any, between personal factors, audiological and cognitive outcomes, and ratings of loudness and annoyance. This was accomplished by grouping the participants according to age, speech in noise scores, sound sensitivity (Weinstein and UCL), and WM capacity (reading span test). The cut off points for subgroups were set to median values of the group except for UCL where the cut off was set to 100 dB SPL, the maximum RMS value of the used sound examples. The hypothesis was that subjects with high or no measureable UCL would, at high sound levels, rate the loudness as lower as and less annoying than subjects with lower UCLs. No analysis of gender was done due to the skewed distribution.
Data were analysed with several statistical approaches. A general overview of the data was given by descriptive statistics. Correlation analysis was performed in order to reveal associations between demographic data and auditory as well as cognitive test results. T-tests were used for paired comparisons between rating results for groups according to demographic, auditory and cognitive measurement results. Analysis of variance (ANOVA) was used to reveal associations between the ratings of loudness and annoyance and sound sources, sound pressure levels, and personal factors such as age and results on the auditory and WM tests. The statistical analysis was performed with IBM SPSS Statistics software, version 22 (Chicago, IL). Differences between groups were considered as statistically significant at p < 0.05. No corrections for multiple comparisons were used in the statistical analysis.
Results
Demographic data
The results of the auditory tests and the test of WM capacity are presented as means and standard deviations (SD) in . All participants had an auditory dynamic range exceeding 95 dB (computed as UCLtones – HTLtones) at all tested frequencies between 0.25 and 4 kHz. Increased subjective noise sensitivity according to the Weinstein questionnaire was found for three participants who had scores slightly over 96 (calculated as the mean +1SD according to Belojevic et al, Citation1992). Scores for the HINT test varied between –5.1 and –2.0 dB SNR (signal-to-noise ratio), with a mean value of –3.1 dB (SD 0.96), indicating normal speech perception (Hällgren et al, Citation2006). The HINT SNRs were correlated with age, r = 0.611, with higher SNRs being needed with increasing age, consistent with Fullgrabe et al. (Citation2015). The reading span test showed a mean value of 12.9 points (SD 3.1) out of a possible 24 points, indicating normal WM capacity (Rönnberg et al, Citation1989).
Table 2. Results of the auditory and cognitive tests for all participants and for the subgroups divided by median value.
When the participants were subgrouped according to age, the older participants had significantly higher PTAs, worse reading span scores, higher HINT SNRs and lower UCLs than the younger participants (). Only age was significantly different between groups when the participants were subgrouped based on the HINT scores while age and HINT scores were statistically different between the groups based on the reading span scores. The HINT scores were negatively correlated with the reading span scores, r = −0.44. Subgrouping the participants according to UCL indicated that participants with lower UCLs had better speech in noise perception.
Rating tests
The average loudness and annoyance ratings, as a function of sound pressure level, are presented in . For all stimuli, both loudness and annoyance increased, as expected, with increasing sound pressure level. The participants rated sounds from documents, newspapers and traffic as louder (by 0.5–1.0 units) than other sounds at the same sound pressure levels. The remaining five sounds (from porcelain, cutlery, water, power drill and electric mixer) were approximately equally rated as a function of sound pressure level. Depending on the sound source the participants rated a level between 55 and 65 dB SPL to be comfortably loud (). When the sound level reached 80 dB SPL it became very loud for all sound types.
Figure 2. Average (a) loudness and (b) annoyance ratings for the eight sounds as a function of absolute sound pressure level.
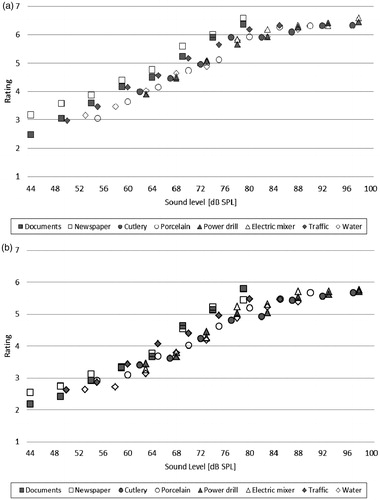
Sounds began to be perceived as annoying at 53–62 dB SPL depending on the sound type, and above 79 dB SPL they were perceived as very annoying (). The annoyance ratings followed the same pattern as the loudness ratings with increased annoyance at higher sound pressure levels. Overall, at the same sound pressure levels, sounds from newspaper and documents were rated as most annoying, followed by sounds from traffic. Sounds from porcelain were rated about 0.5 units below the most annoying sounds and sounds from water around 1 unit below the most annoying sounds, with sounds from the drill, electric mixer and cutlery in between these two.
A repeated measure ANOVA with sound source and level as within-factors for the rating of loudness at sound levels between 63 and 78 dB SPL, for which all sounds had been rated, showed main effects of sound pressure level (F(3,57) = 266.947, p < 0.001) and sound type (F(7,133) = 19.386, p < 0.001), but no significant interaction (p = 0.082). To reveal the source of the significant difference between sound types, paired t-tests were conducted between the ratings for all sound types at the same levels. These t-tests showed that sounds from newspaper, documents and traffic were rated significantly (p < 0.05) higher than remaining sound sources at all levels between 63 and 78 dB SPL for loudness (). Sounds from newspaper, documents and traffic were always ranked loudest with sounds from porcelain as number four (). The rank order of the remaining four sounds varied but the differences between the sounds were small.
Figure 3. (a) Average loudness and (b) annoyance ratings at sound pressure levels between 63 and 78 dB SPL. (c) Estimated loudness of the sounds at the sound pressure levels between 63 and 78 dB SPL based on the loudness model and (d) the geometric mean of the loudness ratings as a function of the geometric mean of the model predicted loudness.
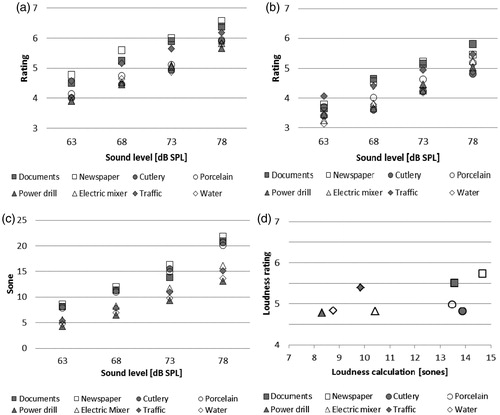
A repeated measure ANOVA with level and sound source as within-factors for the ratings of annoyance showed main effects of sound pressure level (F(3,57) = 249.328, p < 0.001) and sound type (F(7,133) = 10.05, p < 0.001). The interaction between sound pressure level and sound type was significant (F(21,399) = 2.327, p = 0.001). When the results were further analysed with paired t-tests it was shown that sounds from newspaper, documents and traffic were rated as significantly (p<.05) higher than remaining sound sources for levels between 68 and 78 dB SPL (). None of the other t-tests were significant.
The predictions of the loudness model (Moore, Citation2014) were calculated for levels between 63 and 78 dB SPL (). The model predicted the loudness of the newspaper sound to be slightly greater than the loudness for sounds from cutlery, porcelain and documents. The latter three were predicted to have similar loudness as a function of sound pressure level. Sounds from the electric mixer and traffic were predicted to be 3–5 sones less loud than the top four loudest sounds, but 1–2 sones louder than the two least loud sounds in the study, sounds from water and the drill.
The scale for the ratings is not directly comparable to the loudness in sones predicted by the loudness model, but the rankings of the sound can be analysed. For both predicted and rated loudness sounds from newspaper and documents were ranked as louder than the other sounds. The ratings placed the traffic sounds among the four loudest sounds, in contrast to the model, where the loudness of traffic sounds fell among the less loud sounds. Sounds from porcelain and cutlery were ranked among less loud sounds, but had predicted loudness similar to that for the loudest sounds according to the model.
The patterns of loudness were similar across levels for all sound types, both when rated and when estimated by the loudness model. To facilitate comparison of the rated and model estimated loudness for the sounds the geometric means of the loudness values for the four sound pressure levels were computed and shown in . Once again, the scales for rated and model predicted loudness are not directly comparable, but illustrates that sound from traffic is rated louder than predicted by the model, and that sound from cutlery and porcelain is rated softer than predicted by the model.
The influence of age, UCL, sound sensitivity, HINT scores and WM capacity on the ratings of loudness and annoyance was investigated by comparing the results between the subgroups (presented in ). Differences in ratings of loudness and annoyance between the groups were analysed with one-way ANOVAs. According to these analyses, significant differences were only found for the groups based on UCL, for whom both loudness and annoyance for sounds from newspaper and water were rated higher for the subgroup with lower UCL scores than for the subgroup with higher UCL scores.
Discussion
Previous studies of loudness and annoyance have often been performed in groups with narrow age ranges (e.g. in Kumar et al, Citation2008; Bolders et al, Citation2012; Schlittmeier et al, Citation2015). Here, the participants’ ages ranged between 24 and 71 years. A broad age range enabled analysis of age-related factors that could influence sound perception, but revealed no significant differences in the current rating result. The lack of men among the participants prohibited gender analysis of the data. Previously it has been shown that females were more disturbed by aircraft noise, especially for sleep quality (Janssen et al, Citation2014), whereas gender differences for cognitive performances were task dependent (Belojevic et al, Citation1992).
Acoustical factors
The results indicate that the recorded sounds, previously found as disturbing by hearing impaired subjects using hearing aids (Skagerstrand et al, Citation2014), are both loud and annoying for people with normal hearing when presented at their recorded levels. When a sound exceeds a certain level, regardless of spectrum and temporal pattern, the sound is perceived as loud and/or annoying (Björk et al, Citation2006; Muzet, Citation2007). In the present study, sound stimuli with peak levels close to 100 dB SPL and/or RMS-values above 75 dB SPL, were rated as both very loud and very annoying. The sounds in this study were presented over a limited range of levels around the recorded levels. However, when comparing ratings at the same absolute levels, the participants rated the sounds originating from paper as louder and being more annoying than the other sounds. This is in line with the predictions from the loudness model for time varying sounds (Moore, Citation2014). For that model, the overall long-term loudness can be estimated by either the maximum or the mean value. Both the mean (Glasberg & Moore, Citation2002) and the maximum value (Zorila et al, Citation2016) has been suggested as an estimate for loudness perception. In the current study, the maximum value was used since a stable mean was not obtained for the more time varying sounds, especially the sound from newspapers.
In this study, the sounds of the electric mixer, the power drill and cutlery had the highest recorded RMS levels, 82–83 dB SPL. Those sounds were expected to give the highest ratings for both loudness and annoyance, which they did when comparisons were made at the recorded levels, but when compared at the same absolute sound levels those sounds were perceived as the least loud sounds. This is in line with the loudness model predictions for the power drill and electric mixer (geometric means for the model of 8.3 and 10.4 sones and geometric mean of the ratings for both sounds of 4.8). Cutlery was predicted as the second loudest sound by the model (geometric mean of 13.9 sones) while it was rated as one of the least loud sounds (geometric mean of 4.8) ().
One sound that was rated as louder than predicted from the loudness model was traffic sounds (geometric mean for the model of 9.9 sones and geometric mean of the ratings of 5.5). Traffic sounds, typically representing sounds with a low frequency emphasis, are often perceived as annoying, at least for levels down to 45 dB SPL (Miedema & Oudshoorn, Citation2001; Torija & Flindell, Citation2014). In this study, the traffic sound was on average rated as comfortably loud for levels up to 59 dB SPL, a level slightly above the value of 55 dB SPL which is the recommended maximum level for traffic noise near buildings in Sweden. Even though the sound from traffic was rated as comfortably loud at that level, it was at the same time rated as annoying. This suggests that low-frequency dominated sounds, such as sounds from traffic, can be perceived as more annoying than loud. This is contrary to the notion that sounds with energy in the high-frequency region (above 2.5 kHz) are perceived as less pleasant and therefore more annoying than other sounds (Hall et al, Citation2013). Examples of high-frequency dominated sounds in this study are sounds originating from paper, porcelain and cutlery. Paper sounds were rated as significantly louder and more annoying than the other sounds at the same sound pressure levels. Porcelain and cutlery sounds were, in terms of annoyance at a given perceived loudness, rated as similar to the other sounds even though they had a high-frequency emphasis. Hall et al. (Citation2013) suggested that loudness, sharpness, and fluctuation strength affect the perception of annoyance. Here it seems that loudness is the most important of those factors.
It has been shown that the loudness of time-varying sounds is affected by changes in level over time (Neuhoff, Citation1998; Olsen et al, Citation2010). It is not clear if the loudness of time varying sounds is primarily driven by the maximum stimulus level, as suggested by e.g. Ponsot et al. (Citation2013) and Susini et al. (Citation2007), or by values closer to the RMS value (Glasberg & Moore, Citation2002). The sounds in the current study with the largest temporal variations were sounds from porcelain, cutlery, newspaper and documents. According to Ponsot et al. (Citation2013) and Susini et al. (Citation2007), these sounds should be rated as louder and more annoying than the other sounds at the same sound pressure level. Sounds from documents and newspaper were rated as both louder and more annoying than the other sounds at the same RMS level (), but sounds from porcelain and cutlery were rated as being similar to the other sounds. This indicates that sounds with high-frequency spectral content and temporal variations are not always perceived as louder and as more annoying than sounds that do not contain these features.
Auditory and cognitive factors
In the analysis, the participants were sub-grouped according to UCL (), and the cut-off point was set at 100 dB SPL. As stated in the methods, subjects with high or no measurable UCL were hypothesised to rate high sound levels as lower and less annoying than subjects with lower UCLs. This result was only found for the sounds from newspaper and water; otherwise, the ratings of loudness and annoyance were similar for the two groups. Some of the participants rated themselves as somewhat sensitive to sounds according to the Weinstein questionnaire. Even so, they rated neither loudness nor annoyance differently than the other participants. This may indicate that psychological factors not investigated in this study affected those participants’ responses to the Weinstein questionnaire.
The ratings of loudness and annoyance were not affected by WM capacity as measured by the reading span test according to a one-way ANOVA. It has been shown that WM capacity influenced performance on work-related tasks in background noise (Hua et al, Citation2014). Commonly, the influence of WM capacity is tested with a dual task, imposing a high load on the WM. One possible reason for the lack of influence of WM on ratings might be that a single task was used here that is less demanding on the WM capacity. Furthermore, the influence of cognition on speech perception is most important when testing close to speech reception thresholds (Akeroyd, Citation2008). When testing at supra-threshold levels, as was done here, the variation in WM capacity might have to be larger in order to show an observable effect. Loudness and annoyance perception may also be independent of WM capacity as found here.
Participants with higher WM capacity showed better speech perception in noise than participants with lower WM capacity. This is in line with several studies that have investigated the relation between WM capacity and speech perception under adverse conditions (Rönnberg et al, Citation2016). This study supports the idea that cognitive capacity is important for demanding tasks such as perception of speech in noise, than it is for loudness or annoyance perception.
Attitude biased factors
The attitude towards a sound source has previously been shown to be important for annoyance ratings (Maris et al, Citation2007). However, this study did not gather data on attitudes towards sounds, which might have influenced the perception of both loudness and annoyance (Stallen, Citation1999). For example, noise annoyance has been described in terms of a social psychological model (Maris et al, Citation2007) which incorporated both external processes (sound and sound management) and internal processes (perceived disturbance and/or control) for evaluation of annoyance. When the sound can be controlled and adjusted, the disturbance of the sound is often reduced (Maris et al, Citation2007). Another issue is that annoyance can be caused by broken concentration and/or changed attention due to the disturbance (Boman & Enmarker, Citation2004). This effect was not considered in the current study.
Contextual factors influencing the perception of sound
Human perception of unwanted sounds depends on context as well as personal factors of the individual exposed to the sound (Raimbault & Dubois, Citation2005). Sound disturbance is determined by more than the level of the sound. Therefore, to understand the perception of sound, studies need to combine measures of sound level and psycho-social effects. In this study, the participants were asked to disregard prior knowledge of the sound and the context in which the sound normally appears. However, the difference between loudness and annoyance ratings for sounds originating from documents and newspapers compared to the other sounds might be an effect of expectations of the sound. When paper sounds are compared to the sound of an electric mixer at a level of 60–65 dB SPL, the paper sounds are at the recorded level while the sound level of the electric mixer is approximately 20 dB lower than recorded. This may lead to a more annoying perception of the paper sounds than of the electric mixer, as the latter is less loud than expected. For people with normal hearing, our results indicate that, as for the perception of loudness, the perception of annoyance is primarily related to the sound pressure level. The results also indicate that factors other than sound level influence loudness and annoyance ratings.
Conclusions
Eight sounds, previously identified as disturbing, were rated for their loudness and annoyance for levels ranging by ±20 dB around the recorded levels. There was a clear influence of sound level on both loudness and annoyance perception. Sounds from documents and turning pages in a newspaper were rated as significantly louder and more annoying than the other sounds at the same RMS sound level. This finding may be related to spectral content and temporal variations. But other factors such as familiarity and expectations may have influenced the ratings of loudness and annoyance. The results indicate that WM capacity does not affect the perception of loudness and annoyance, at least for people with normal hearing. Neither age nor UCL or the results of the Weinstein questionnaire influenced the loudness and annoyance ratings. As the participants had normal hearing thresholds the variation in auditory measures was limited.
Declaration of interest
No potential conflict of interest was reported by the authors.
Acknowledgements
The authors thank Brian CJ Moore and two anonymous reviewers for helpful comments on the manuscript. Part of this work was presented at the Third International Conference on Cognitive Hearing Science for Communication, Linköping, Sweden 2015.
References
- Akeroyd, M.A. 2008. Are individual differences in speech reception related to individual differences in cognitive ability? A survey of twenty experimental studies with normal and hearing-impaired adults. Int J Audiol, 47, S53–S71.
- Alimohammadi, I., Sandrock, S. & Gohari, M.R. 2013. The effects of low frequency noise on mental performance and annoyance. Environ Monit Assess, 185, 7043–7051.
- Basner, M., Babisch, W., Davis, A., Brink, M., Clark, C., et al. 2014. Auditory and non-auditory effects of noise on health. Lancet, 383, 1325–1332.
- Belojevic, G., Ohrstrom, E. & Rylander, R. 1992. Effects of noise on mental performance with regard to subjective noise sensitivity. Int Arch Occup Environ Health, 64, 293–301.
- Berglund, B., Berglund, U. & Lindvall, T. 1976. Scaling loudness, noisiness, and annoyance of community noises. J Acoust Soc Am, 60, 1119–1125.
- Björk, J., Ardö, J., Stroh, E., Lövkvist, H., Östergren, P.-O., et al. 2006. Road traffic noise in southern Sweden and its relation to annoyance, disturbance of daily activities and health. Scand J Work Environ Health, 32, 392–401.
- Bolders, A.C., Band, G.P. & Stallen, P.J. 2012. Evaluative conditioning induces changes in sound valence. Front Psychol, 3, 106.
- Boman, E. & Enmarker, I. 2004. Factors affecting pupils' noise annoyance in schools: The building and testing of models. Environ Behav, 36, 207–228.
- Canlon, B., Theorell, T. & Hasson, D. 2013. Associations between stress and hearing problems in humans. Hear Res, 295, 9–15.
- Cox, R.M., Alexander, G.C., Taylor, I.M. & Gray, G.A. 1997. The contour test of loudness perception. Ear Hear, 18, 388–400.
- Daneman, M. & Carpenter, P.A. 1980. Individual differences in working memory and reading. J Verbal Learning Verbal Behav, 19, 450–466.
- Fletcher, H. & Munson, W.A. 1933. Loudness, its definition, measurement and calculation. Bell Syst Techn J, 12, 377–430.
- Fullgrabe, C., Moore, B.C.J. & Stone, M.A. 2015. Age-group differences in speech identification despite matched audiometrically normal hearing: Contributions from auditory temporal processing and cognition. Front Aging Neurosci, 6, 347. doi:10.3389/fnagi.2014.00347.
- Gidlöf-Gunnarsson, A. & Öhrström, E. 2007. Noise and well-being in urban residential environments: The potential role of perceived availability to nearby green areas. Landsc Urban Plan, 83, 115–126.
- Glasberg, B.R. & Moore, B.C.J. 2002. A model of loudness applicable to time-varying sounds. J Audio Eng Soc, 50, 331–342.
- Hall, D.A., Irwin, A., Edmondson-Jones, M., Phillips, S. & Poxon, J.E.W. 2013. An exploratory evaluation of perceptual, psychoacoustic and acoustical properties of urban soundscapes. Appl Acoust, 74, 248–254.
- Hällgren, M., Larsby, B. & Arlinger, S. 2006. A Swedish version of the Hearing In Noise Test (HINT) for measurement of speech recognition. Int J Audiol, 45, 227–237.
- Holm Pedersen, T. 2007. In: Holm Pedersen, T. (ed.) The “Genlyd” Noise Annoyance Model. Copenhagen, Denmark: Danish Electronics, Light & Acoustics, DELTA, p. 121.
- Hua, H., Emilsson, M., Kahari, K., Widen, S., Moller, C., et al. 2014. The impact of different background noises: effects on cognitive performance and perceived disturbance in employees with aided hearing impairment and normal hearing. J Am Acad Audiol, 25, 859–868.
- IEC. 2012. Electroacoustics – Audiometric equipment – Part 1: Equipment for pure-tone audiometry. Geneva: International Electrotechnical Commission.
- Irwin, A., Hall, D.A., Peters, A. & Plack, C.J. 2011. Listening to urban soundscapes: Physiological validity of perceptual dimensions. Psychophysiology, 48, 258–268.
- Jahncke, H., Hygge, S., Halin, N., Green, A.M. & Dimberg, K. 2011. Open-plan office noise: Cognitive performance and restoration. J Environ Psychol, 31, 373–382.
- Janssen, S.A., Centen, M.R., Vos, H. & van Kamp, I. 2014. The effect of the number of aircraft noise events on sleep quality. Appl Acoust, 84, 9–16.
- Kochkin, S. 2005. MarkeTrak. VII: Customer satisfaction with hearing instruments in the digital age. Hear J, 58, 30. 32–34, 38–40, 42–43.
- Kumar, S., Forster, H.M., Bailey, P. & Griffiths, T.D. 2008. Mapping unpleasantness of sounds to their auditory representation. J Acoust Soc Am, 124, 3810–3817.
- Laszlo, H.E., McRobie, E.S., Stansfeld, S.A. & Hansell, A.L. 2012. Annoyance and other reaction measures to changes in noise exposure — A review. Sci Total Environ, 435–436, 551–562.
- Lee, P.J. & Jeon, J.Y. 2013. Relating traffic, construction, and ventilation noise to cognitive performances and subjective perceptions. J Acoust Soc Am, 134, 2765–2772.
- Maris, E., Stallen, P.J., Vermunt, R. & Steensma, H. 2007. Noise within the social context: Annoyance reduction through fair procedures. J Acoust Soc Am, 121, 2000–2010.
- Mattys, S.L., Davis, M.H., Bradlow, A.R. & Scott, S.K. 2012. Speech recognition in adverse conditions: A review. Lang Cogn Process, 27, 953–978.
- McCormack, A. & Fortnum, H. 2013. Why do people fitted with hearing aids not wear them? Int J Audiol, 52, 360–368.
- Miedema, H.M.E. & Oudshoorn, C.G.M. 2001. Annoyance from transportation noise: Relationships with exposure metrics DNL and DENL and their confidence intervals. Environ Health Perspect, 109, 409–416.
- Moore, B.C.J. 2004. An Introduction to the Psychology of Hearing. London: Elsevier Academic Press.
- Moore, B.C.J. 2014. Development and current status of the “Cambridge” loudness models. Trends Hear, 18, 1–29.
- Muzet, A. 2007. Environmental noise, sleep and health. Sleep Med Rev, 11, 135–142.
- Neuhoff, J.G. 1998. Perceptual bias for rising tones. Nature, 395, 123–124.
- Oberfeld, D. & Klockner-Nowotny, F. 2016. Individual differences in selective attention predict speech identification at a cocktail party. Elife, 5, e16747. doi:10.7554/eLife.16747
- Olsen, K.N., Stevens, C.J. & Tardieu, J. 2010. Loudness change in response to dynamic acoustic intensity. J Exp Psychol Hum Percept Perform, 36, 1631–1644.
- Ponsot, E., Susini, P., Saint Pierre, G. & Meunier, S. 2013. Temporal loudness weights for sounds with increasing and decreasing intensity profiles. J Acoust Soc Am, 134, EL321–EL326.
- Raimbault, M. & Dubois, D. 2005. Urban soundscapes: Experiences and knowledge. Cities, 22, 339–350.
- Robinson, K. & Gatehouse, S. 1996. Test–retest reliability of loudness scaling. Ear Hear, 17, 120–123.
- Rönnberg, J., Arlinger, S., Lyxell, B. & Kinnefors, C. 1989. Visual evoked potentials: Relation to adult speechreading and cognitive function. J Speech Hear Res, 32, 725–735.
- Rönnberg, J., Lunner, T., Ng, E.H.N., Lidestam, B., Zekveld, A.A., et al. 2016. Hearing impairment, cognition and speech understanding: Exploratory factor analyses of a comprehensive test battery for a group of hearing aid users, the n200 study. Int J Audiol, 55, 623–642.
- Schlittmeier, S.J., Feil, A., Liebl, A. & Hellbruck, J. 2015. The impact of road traffic noise on cognitive performance in attention-based tasks depends on noise level even within moderate-level ranges. Noise Health, 17, 148–157.
- SIS. 2002. Acoustics – Assessment of noise annoyance by means of social and socio-acoustic surveys. Stockholm: Swedish Standards Institute.
- Sjodin, F., Kjellberg, A., Knutsson, A., Landstrom, U. & Lindberg, L. 2012. Noise exposure and auditory effects on preschool personnel. Noise Health, 14, 72–82.
- Skagerstrand, Å., Stenfelt, S., Arlinger, S. & Wikström, J. 2014. Sounds perceived as annoying by hearing-aid users in their daily soundscape. Int J Audiol, 53, 259–269.
- Sorqvist, P., Stenfelt, S. & Ronnberg, J. 2012. Working memory capacity and visual-verbal cognitive load modulate auditory-sensory gating in the brainstem: Toward a unified view of attention. J Cogn Neurosci, 24, 2147–2154.
- Stallen, P.J. 1999. A theoretical framework for environmental noise annoyance. Noise Health, 1, 69–80.
- Stansfeld, S.A. & Matheson, M.P. 2003. Noise pollution: Non-auditory effects on health. Br Med Bull, 68, 243–257.
- Susini, P., McAdams, S. & Smith, B.K. 2007. Loudness asymmetries for tones with increasing and decreasing levels using continuous and global ratings. Acta Acust United Acust, 93, 623–631.
- Torija, A.J. & Flindell, I.H. 2014. Listening laboratory study of low height roadside noise barrier performance compared against in-situ field data. Build Environ, 81, 216–225.
- Weinstein, N.D. 1978. Individual differences in reactions to noise: A longitudinal study in a college dormitory. J Appl Psychol, 63, 458–466.
- Zorila, T.C., Stylianou, Y., Flanagan, S. & Moore, B.C.J. 2016. Effectiveness of a loudness model for time-varying sounds in equating the loudness of sentences subjected to different forms of signal processing. J Acoust Soc Am, 140, 402.