
Abstract
Objective: To compare recordings of bone conduction (BC) stimulated auditory brainstem response (ABR) obtained using the newer BC transducer Radioear B81 and the conventional BC transducer Radioear B71. Balanced electromagnetic separation transducer (BEST) design found in the B81 may influence the ABR magnitudes and latencies, as well as electrical artefacts.
Design: ABRs to tone burst stimuli of 500 Hz, 2000 Hz, 4000 Hz, click stimulation, and broad-band chirp stimulation at 20 and 50 dB nHL were recorded. For each device, stimulus and intensity level, the ABR Jewett wave V amplitude and latency were obtained. The device-related electrical stimulus artefacts on the ABR recordings were also analysed by calculating the Hilbert envelope of the peri-stimulus recording segments.
Study sample: Twenty-three healthy adults with normal hearing were included in the study.
Results: The ABRs obtained by the B81 were similar to that of the B71 in terms of ABR wave V amplitude and latency. However, the B81 produced smaller electrical artefacts than B71 and this difference was statistically significant. Conclusions: The BC transducer Radioear B81 provides ABRs comparable to Radioear B71 while causing smaller artefacts.
Introduction
Auditory brainstem response (ABR) measurement is often used in the clinic as an objective measure to determine the hearing thresholds of the paediatric population and difficult-to-test adults, who are unable to respond behaviourally (Hall Citation2007). Bone conduction (BC) ABR is the essential procedure when air conduction (AC) ABR measurements indicate a hearing loss, as it provides information whether the hearing loss is purely conductive or has a sensorineural component (Hatton, Janssen, and Stapells Citation2012; Stapells Citation2011). This is particularly important for infants in order to diagnose the hearing loss and choose the amplification method for early intervention (American Academy of Pediatrics, Joint Committee on Infant Hearing Citation2007).
Bone conduction is based on vibrations primarily transmitted through the skull bone to the inner ear (Stenfelt and Goode Citation2005). Bone conduction ABR is usually obtained with a BC transducer placed on the surface of the skin at the mastoid. An alternative placement is to use the forehead. The conventional BC transducer has been the Radioear B71 (Radioear Corporation, Eden Pairie, MN) as calibration data are available and included in the standard (International Organization of Standardization Citation2016). The B71 has also been the recommended device for the hearing screening programmes and protocols such as Antenatal and Newborn Screening Programmes in England (NHSP Citation2013), Ontario Infant Hearing Program (IHP Citation2008), and British Columbia Early Hearing Programme (BCEHP Citation2012) in Canada.
Performance characteristics of the B71 and the behavioural thresholds obtained have been thoroughly documented in literature (Billings and Winter Citation1977; Dirks et al. Citation1979; Dirks and Kamm Citation1975; Eichenauer et al. Citation2014; Frank, Byrne, and Richards Citation1988; Jansson et al. Citation2015; Richards and Frank Citation1982). Physically, the B71 differed from its predecessor the B70 by its flat, circular contact tip, and from the B72 by its size and weight. Frequency response curves of the B71 shows three resonant peaks occurring at 450 Hz, 1500 Hz and 3800 Hz, amplitudes of which decrease as the frequency increases. Harmonic distortions were shown to affect the B71’s performance particularly at low frequencies (e.g. at 250 Hz) and the intensity of the second harmonic is close to the output at the fundamental frequency. When the harmonics have sufficient energy to stimulate the cochlea and the patient under test has better hearing at these harmonic frequencies, the obtained BC thresholds could be due to the perception of the harmonics rather than the perception of the fundamental frequency. Thus, the B71’s widespread use as the standard bone vibrator has set the low frequency limit for BC threshold measurements at 500 Hz.
Recently, a new BC transducer, Radioear B81 (Radioear Corporation, Eden Pairie, MN), was introduced for BC audiometry. With its new design, the B81 provides higher output with lower non-linear distortion at low frequencies and the ability to test audiometric BC thresholds in people with more severe levels of hearing loss (Hakansson Citation2003; Jansson et al. Citation2015). Performance characteristics of the B81 has been documented in detail by Jansson et al. (Citation2015). In short, the B81 resembles the B71 in its size and shape, gives a similar frequency response with three resonance peaks (at 425 Hz, 1300 Hz and 4125 Hz) and has similar electrical input impedance, which facilitates integration with existing audiometers. However, upon application of equal input voltage, the B81 produces 5.5 dB higher output at frequencies between 425 Hz and 1300 Hz, an important point to note for calibration. The B81 has less harmonic distortion for frequencies below 1000 Hz: the total harmonic distortion at 250 Hz being 1.88% compared to 28.07% for the B71 when driven by an input voltage of 1 VRMS. Furthermore, the B81 complies with the IEC 60645-1 (IEC Citation2012) requirement at 250 Hz by providing 52.6 dB maximum hearing level (dB HL), enabling threshold testing at 250 Hz. The improvement in the maximum stimulation level extends up to 1500 Hz. Details of the electroacoustic performance of the B81 compared to the B71 summarised here can be found in Jansson et al. (Citation2015). The B81 has been further evaluated in terms of harmonic distortion and tactile sensation, which are important for defining the upper limit of stimulus intensity for BC threshold measurements (Eichenauer et al. Citation2014). At the fundamental frequency of 250 Hz, the B81 provides a larger dynamic test range than the B71 as the second harmonic does not become audible until the input to the B81 is 30 dB HL (20 dB HL for the B71) and tactile sensation, which occurs at 35 dB HL is not a confounding factor (Eichenauer et al. Citation2014). The similarity of tactile thresholds at 500 Hz and 1000 Hz for both devices however, appear to limit the advantages of the B81 to only 250 Hz.
The aim of this study is to evaluate the performance of the BC transducer B81 in terms of ABR response amplitude, latency and electrical artefacts. This is accomplished by comparing the ABR recordings obtained using the B71 and the B81 from participants with normal hearing using sound stimuli at 20 dB nHL and 50 dB nHL consisting of tone bursts, click, and broad-band chirp.
Methods
Participants
Twenty-three participants with normal hearing (12 females) in the age range of 21 to 46 years (median 25 years) were tested. Pure-tone screening was performed to ensure that the participants had hearing thresholds better than 20 dB HL across the octave frequencies from 250 Hz to 8000 Hz. The participants did not have a history of hearing loss or ear disease and had normal otoscopy. The right ear was selected as the test ear. Informed consent was obtained from each participant. The study was approved by the local ethical committee and all the procedures conformed to the Declaration of Helsinki.
Setup and calibration
Stimulus generation and ABR recordings were conducted with the Interacoustics Eclipse ABR System EP25 with version 4.4 software (Interacoustics A/S, Assens, Denmark). The ABR system was interfaced with the OtoAccess™ software (v0.8, Interacoustics A/S, Assens, Denmark) on a laptop PC. Test stimuli were tone bursts of 500, 2000, and 4000 Hz, click, and broad-band chirp at 20 dB nHL and 50 dB nHL and all were generated within the Eclipse system. For 2000 Hz and 4000 Hz, stimuli were 5-cycle Blackman-enveloped tone bursts. Due to the length of the signal, 500 Hz stimulus was a 3-cycle Blackman-enveloped tone burst. The broadband signals were the default stimuli in EP25 where the click stimulation is based on a 100 µs rectangular electrical pulse clicks and a level-specific broadband chirp termed CE-Chirp® LS that incorporates frequency dependent time delays to achieve better neural synchronisation (Kristensen and Elberling Citation2012).
As the Eclipse EP25 system was calibrated for the B71 as default, it was necessary to adjust the electrical input to the B81 to obtain the same peak-to-peak vibration amplitude as for the B71. For each stimulus type at 50 dB nHL, the vibration outputs of the B71 and the B81 were measured on a Brüel and Kjær type 4930 artificial mastoid (Brüel and Kjær, Naerum, Denmark) with a static force of 5.4 Newtons. The voltage output of the artificial mastoid was fed to a data acquisition device (NI USB-6212; National Instruments, Austin, TX) via a charge amplifier B&K 2635 (Brüel and Kjær, Naerum, Denmark) and peak-to-peak vibration amplitudes were measured using Matlab® (MATLAB R2016b, The MathWorks Inc., Natick, MA). After calculating the calibration values, the electrical output of the Eclipse EP25 was adjusted for the B81 using the intensity dial setting of the software user interface. For the broadband stimuli (click and broad-band chirp) and 500 Hz tone bursts, adjusting the level by −2 dB and −4 dB, respectively, for the B81 produced the same vibration amplitude as for the B71. No adjustment was needed for tone bursts at 2000 and 4000 Hz. A single example of each BC transducer was used in the study under the assumption that the devices would be representative of their type.
Procedure
BC-ABR recordings were obtained with a two-channel ABR montage where the right ear ABR potentials were obtained between FPz (hairline) and A2 (right earlobe), the left ear potentials between FPz and A1 (left earlobe), and the ground electrode placed on the mid-forehead. The electrodes used were disposable wet gel surface electrodes (Ambu® BlueSensor BRS, Ambu A/S, Ballerup, Denmark). Electrode impedances were measured by the Eclipse system and required to be balanced and below 1 kOhm. The participants were seated in a reclining chair in a sound-proof and electrically shielded audiology test room and instructed to remain relaxed.
The ABR measurements with the B71 and the B81 were performed in two consecutive sessions. The device order was randomised while the stimuli order was fixed and each BC transducer was placed at a stable position, either posterior or superioposterior of the pinna without touching it. Care was taken to place the transducers on the same location on the right mastoid for each subject. The slight pressure mark of the former device on the scalp was used as the reference for the latter. The BC transducers were held in place by the standard spring steel headband Radioear P3333 (Radioear Corporation, Eden Pairie, MN) with 3.5–5.5 Newtons of static force, measured using a spring scale (part of the Brüel and Kjær type 4930 artificial mastoid setup) for each subject. Although the B81 is about 1.5 mm smaller in height, the static force applied by the headband was similar for the two devices.
The non-test ear was masked with band-limited white noise using the masking option of the Eclipse system (Nolan and Lyon Citation1981; Stenfelt Citation2012). The test-ear was open for tone burst stimuli at 500 and 2000 Hz to avoid the occlusion effect (Stenfelt and Reinfeldt Citation2007), while it was plugged at 4000 Hz to avoid the risk of radiated sound from the bone vibrator casing affecting the measurement (Lightfoot Citation1979). Insert earphones (3 M™ E-A-RTONE™, 3 M Company, Indianapolis, IN) with foam ear tips (ER-3 A, 3 M E-A-RLINK™, 3 M Company, Indianapolis, IN) were used for masking and the same ear tips were used for plugging the test ear at 4000 Hz tone burst. Masking noise levels was adjusted to be 30 dB above the stimulus level using the masking level calculator by Dr. Guy Lightfoot (Lightfoot Citation2013). The sound stimuli were delivered with alternating polarity at a rate of 37.2 Hz and 27 ms long sweeps were acquired using a bandpass filter between 33 and 3000 Hz and with a sampling frequency of 15,000 Hz. EP25 uses a dynamic gain-artefact rejection algorithm, where the amount of gain applied by the system also defines the rejection amplitude limits. For each participant, the gain was set at the maximum level at which the raw EEG (the ongoing activity without any stimulation, which is continuously acquired and visualised on the recording screen) is within the set rejection level i.e. raw EEG is not rejected. The gain was either 92 dB (rejection limit: ± 40 μV) or 98 dB (rejection limit: ± 20 μV) and once set, this subject-dependent gain was kept constant for all sessions. Rejection time range was adjusted to start at the sound stimulus offset to avoid rejection of sweeps due to electrical artefacts caused by the transducer. For each participant, two sets of 4000 sweeps for the tone bursts (a total of 8000 sweeps per stimulus) and two sets of 2000 sweeps for the broadband signals (a total of 4000 sweeps per stimulus) were obtained for each BC transducer and stimulus level. The overall test duration was about two hours including hearing screening.
Analyses
For each condition (stimulus type, intensity, and device type), the arithmetic means of the two set of sweeps of the ipsilateral recordings were visually inspected offline for the replicability of the response and subsequent analysis were done on the grand average waveform. Averaging was performed across a fixed number of sweeps and sweeps received equal weight (no weighted averaging (Bayesian) was used). Peak latency and peak-to-peak amplitude of the Jewett wave V were measured. Peak-to-peak amplitude was measured from the peak of wave V to the SN10 trough. Electrical stimulus artefacts imposed on the ABR recordings were quantified by calculating the Hilbert envelope of the time segment corresponding to the stimulus artefact on the average of single polarity (rarefaction) sweeps of 50 dB nHL condition ( inset). The peak value of the Hilbert envelope for each stimulus type was used for the analyses.
Statistical analyses were performed in SPSS (IBM® SPSS® Statistics Version 24). The ABR Wave V amplitude and latency values were analysed with a three-factor repeated measures analysis of variance (ANOVA) with factors being device type (B71, B81), stimulus intensity (20, 50 dB nHL), and stimulus type (500 Hz tone burst, 2000 Hz tone burst, 4000 Hz tone burst, click, and broad-band chirp). The purpose of building repeated-measures ANOVA tables was to be able to evaluate: (1) the main effect of device type over the whole data set regardless of any other parameter but taking into account the direction of the change (gain or loss) and (2) the possible interactions of device type with stimulus intensity and/or type, which might suggest an effect of BC transducer type that is too subtle to show up as a main effect.
For the evaluation of electrical stimulus artefacts on the ABR recordings, Hilbert envelope peak values were analysed with a two-factor repeated measures ANOVA with factors being device type (B71, B81) and stimulus type (500 Hz tone burst, 2000 Hz tone burst, 4000 Hz tone burst, click, and broad-band chirp). The main effects and interactions that include several levels were tested for sphericity using the Mauchly’s test and Greenhouse-Geisser corrections were applied for p-values of the subsequent ANOVA results when necessary. The post hoc comparisons of significant effects were performed using paired t-tests with Holm–Sidak corrections for multiple comparisons. An alpha level of 0.05 was adopted for significance. For further analysis of the main effects that did not reach significance: (1) median of percentage change values were calculated by the formula (XB81 –XB71)/XB71 * 100 to visualise whether a trend exists, and (2) power analysis of the obtained data set including estimation of sample size and minimum detectable differences were performed using R software (R Development Core Team Citation2016).
Results
Prominent auditory evoked responses were obtained from all participants for every stimulus condition. A sample trace showing the wave V response (asterix) and electrical artefact recorded using the B71 and 4000 Hz tone burst stimulus can be seen in the inset of .
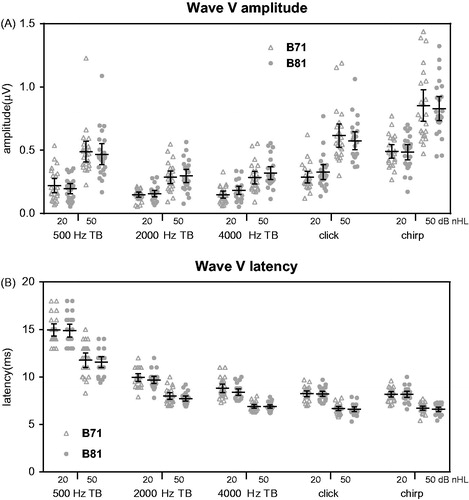
The grand average wave V amplitude values obtained with the B71 and the B81 for each stimulus condition are shown on a scatter-plot of individual measurements in (error bars denote 95% confidence intervals). The three-factor repeated measures ANOVA calculated to analyse ABR Wave V amplitudes showed that the B81 compared to the B71 did not have a significant effect on the ABR response amplitudes as there was no significant main effect of device type (F(1,22) = 0.017, p = 0.897) and the device type did not cause any significant interactions with the other factors examined such as stimulus intensity (F(1,22) = 0.063, p = 0.804), stimulus type (F(4,88) = 1.776, p = 0.166), or both (F(4,88) = 0.819, p = 0.482).
Figure 1. Mean and individual ABR Wave V amplitude (A) and latency (B) values obtained for tone bursts of 500 Hz, 2000 Hz, 4000 Hz, click and broad-band chirp stimuli by the B71 (triangles) and the B81 (circles). The data of the BC transducers are shown side by side for each stimuli level and the scatter plot shows individual values. Error bars represent 95% confidence intervals for the mean values. For the latency data (B), Wave V latency in response to broad-band chirp stimuli were adjusted by the Eclipse system to allow direct comparison with clicks (TB: tone burst).
The observed similarity between the two BC transducers in terms of evoked response amplitude was further investigated by computing the percentage change from the B71 values and comparing them to a hypothetical zero (= no change). The conversion to percentage change minimises the effect of the absolute values of the responses to various stimuli. The boxplot of the amplitude outcome for the B81 in shows that there is gain (positive values) as well as loss (negative values) for all stimuli and nearly all medians lie close to zero. The observed similarity between the two BC transducers in terms of evoked response amplitude was further investigated by power analysis of the data set. The power analysis showed that with an alpha =0.05 and power =0.80, the mean amplitude difference observed for the test stimuli are less than the minimum detectable difference (MDD) values calculated for a paired t-test. The MDD values are given in along with the mean differences in amplitude. With an alpha = 0.05 and power = 0.80, the estimated sample size to have all the observed differences to be statistically significant was calculated to be 2627 participants.
Figure 2. Boxplot of the observed differences in ABR wave V amplitudes calculated as percentage difference (see Methods section) for the B81 across the stimuli used. The lines mark the medians, the boxes extend from the 25th to 75th percentiles, and the whiskers extend from 10th to 90th percentiles. Symbols mark the outliers. (TB: tone burst).
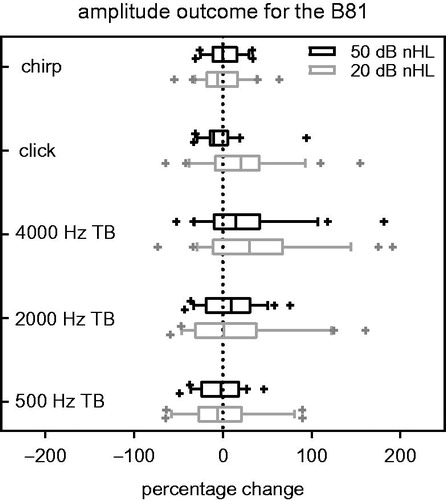
Table 1. Summary of the comparison of the ABR wave V amplitudes obtained by the B71 and the B81 for each sound stimulus and intensity level.
The Eclipse ABR system can automatically calculate the residual noise (RN) of an averaged ABR waveform by computing the sweep-to-sweep variance of a single time point in the response waveform (Elberling et al. Citation1994; Elberling and Don Citation1984). The residual noise across all tests was in the range of 20.04–167.9 nV. Median values across all the sessions obtained with the B71 and the B81 were 56.3 nV and 50.11 nV, respectively. The reasons for the wide range of residual noise was the fixed-number-of-sweeps approach with straightforward averaging, the differences in the total number of sweeps obtained for broadband (4000 sweeps) stimuli and tone bursts (8000 sweeps), and personalised artefact rejection limits.
For the ABR Wave V latency values (), the three-factor repeated measures ANOVA analysis did not show a significant effect of the B81 compared to the B71 as there was no significant main effect of device type (F(1,22) = 3.615, p = 0.07) and the device type did not cause any significant interactions with the stimulus intensity (F(1,22) = 0.022, p = 0.883), stimulus type (F(4,88) = 0.442, p = 0.638), or both (F(4,88) = 0.758, p = 0.490).
The overall consistency of the measured latency values as seen on the scatterplot in combined with the ANOVA results suggest the similarity of the performance of the two BC transducers. Therefore, no further analyses for the differences were performed except for the estimated sample, which was calculated to be 35308 with an alpha =0.05 and power =0.80, for all the observed differences to be statistically significant.
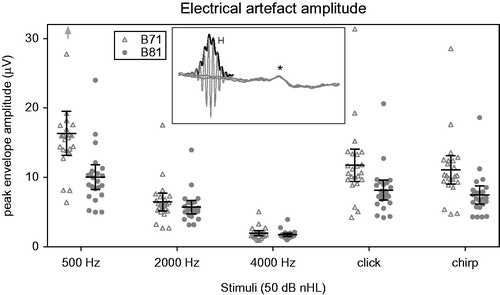
The peak values of the electrical stimulus artefact imposed on the ABR recordings are shown in and were analysed by a two-factor repeated measures ANOVA. The B81 compared to the B71 caused a significant main effect on the artefact amplitude (F(1,22) = 27.356, p < 0.001) and there was also a significant interaction with stimulus type (F(4,88) = 23.489, p < 0.001) that indicates that the effect of the device type differs between stimulus types. There was a significant main effect of stimulus type on the artefact amplitude (F(4,88) = 92.715, p < 0.001). The post-hoc analyses revealed that the stimulus artefact was significantly reduced by the B81 compared with the B71 for the stimulus types of 500 Hz tone burst (t(88) = 12.76, p = 0.000), click (t(88) = 6.587, p < 0.001), and broad-band chirp (t(88) = 7.286, p < 0.001). There was no significant difference in artefact amplitude for the 2000 Hz tone burst (t(88) = 2.04, p = 0.203) and 4000 Hz tone burst (t(88) = 0.452, p = 0.994).
Figure 3. The amplitude of the electrical stimulus artefact imposed on the ABR recordings for the B71 (triangles) and the B81 (circles). Mean of the peak values of Hilbert envelopes of single polarity sweeps are given side by side for the two BC transducers. Scatterplot shows the individual values. Only the sweeps recorded in response to 50 dB nHL stimulus level were analysed. Error bars represent 95% confidence intervals of the mean values. Arrow indicates an outlier with a value of 43.75 µV. Inset shows a sample trace recorded using the B71 and 4000 Hz tone burst stimulus. Hilbert envelope of the electrical artefact caused by the BC transducer is marked by the letter H. Asterix marks the wave V ABR response.
Discussion
The diagnosis of conductive and mixed hearing loss is based on measurements of bone conduction hearing thresholds either with behavioural audiometry or using electrophysiological methods. The accurate measurement of a conductive component in profound hearing loss, however, is a challenge.
Recently, a new design of a BC transducer has been suggested (Hakansson Citation2003) to enable higher output levels with acceptable non-linear distortion. The transducer in the Radioear B81 is based on this new design and claims to enable BC testing at low frequencies such as 250 Hz (Jansson et al. Citation2015). The increased testing level may also enable BC threshold testing in patients with severe hearing loss.
In this study, ABR recordings were investigated to reveal differences between the Radioear B81 and the conventional Radioear B71. The stimuli chosen include the ones usually used in clinical test procedures. As the test set-up was calibrated as default for the B71, the stimuli intensities for the B81 sessions were adjusted to enable accurate comparison of the two devices. The adjustment values were similar to the previously published data on the electro-acoustic performance of the B81 (Jansson et al. Citation2015).
The dimensions of the B81 are similar to the B71, except a small difference in height, and both can be used with the standard Radioear P3333 headband with similar static force. The testing was done with the BC transducers positioned on the mastoid. The position may have differed across participants (but not across the BC transducers) from posterior to superoposterior of the pinna, which were reported to be equally effective locations for stimulating the cochlea (Dobrev et al. Citation2016). Stimulus parameters for tone bursts were similar to the BC ABR studies published previously using the B71 (Elsayed et al. Citation2015; Gorga et al. Citation1993; Hatton, Janssen, and Stapells Citation2012; Small and Stapells Citation2003; Vander Werff, Prieve, and Georgantas Citation2009). shows a summary of stimulus parameters used in previous studies on different aspects of BC ABR using the B71 as BC transducer. The latency values obtained in this study to tone bursts, click, and broad-band chirp stimuli were comparable to previous studies using the B71 (Beattie Citation1998; Cobb and Stuart Citation2016; Gorga et al. Citation1993). shows the summary of latency values reported previously for adults using the B71.
Table 2. Summary of stimulus parameters utilised in previous bone conduction ABR studies on normal hearing adults using the B71.
Table 3. Summary of ABR Wave V latency values in normal hearing adults reported in previous studies using the B71.
The absence of a general tendency towards a gain or loss of the observed differences in the wave V amplitude and latency between the B71 and the B81 across various sound stimuli suggests similarity of the performance of the two BC transducers for ABR measurements.
Although the estimated MDD values may suggest that the sensitivity of the current test method is low, the estimated sample size to have all the observed differences to be statistically significant was 2627 for the amplitude measurements (35308 for the latency measurements). Even if such numbers of participants could be recruited, it would be impractical to undertake such a large study. However, the differences observed in this study do not identify one device as superior to the other (). In the test protocol, the order of BC transducers were randomised across the subjects while keeping the stimuli order fixed. Therefore, directional differences in response amplitude might reflect the SNR variations during the recording session.
The new BC transducer B81 can be introduced easily to the existing electrophysiology setups as soon as correct calibration data is available. The size and shape of the B81 almost replicates the B71 and, therefore, manipulation of the device especially for obtaining BC ABR in infants would not require additional training. However, future studies will determine whether the two devices perform similar in infants and whether the B81 would make it feasible to obtain ABR responses at 250 Hz.
As the two BC transducers produce similar responses, the correction factors for BC stimuli published previously for the B71 can be applied for the B81 for adults (Frank, Byrne, and Richards Citation1988). In terms of electrical stimulus artefact, the B81 creates a significantly smaller stimulus artefact on the recordings for 500 Hz tone burst, click, and broad-band chirp. The fact that these stimuli correspond to the stimuli that required modification of stimulus intensity shows the capacity of the new B81 to produce high-intensity vibrations with lower electromagnetic interference. The lower electrical artefact profile of the B81 is beneficial for systems which cannot configure the artefact reject region to avoid rejection due to large stimulus artefact as well as for continuous recordings like auditory steady state response (ASSR) measurements. A lower artefact profile would also be desirable for infant hearing screening considering the closeness of the recording electrodes and the BC transducer around the infant head.
In summary, the B81 performs similar to the B71 for tone bursts, clicks, and broad-band chirps at 20 dB nHL and 50 dB nHL stimulus intensity and gives a welcome reduction in electrical stimulus artefact.
Disclosure statement
No potential conflict of interest was reported by the authors.
| Abbreviations | ||
| ABR | = | auditory brainstem response |
| AC | = | air conduction |
| BC | = | bone conduction |
| BEST | = | balanced electromagnetic separation transducer |
Additional information
Funding
References
- American Academy of Pediatrics, Joint Committee on Infant Hearing. 2007. “Year 2007 Position Statement: Principles and Guidelines for Early Hearing Detection and Intervention Programs.” Pediatrics 120 (4): 898–921. doi:10.1542/peds.2007-2333.
- BCEHP. 2012. British Columbia Early Hearing Program. A service of BC Children’s Hospital and the Provincial Health Services Authority, Canada. http://www.phsa.ca/Documents/bcehpaudiologyassessmentpro-tocol.pdf.
- Beattie, R. C. 1998. “Normative Wave V Latency-Intensity Functions Using the EARTONE 3A Insert Earphone and the Radioear B-71 Bone Vibrator.” Scandinavian Audiology 27 (2): 120–126. doi:10.1080/010503998420360.
- Billings, B. L., and M. Winter. 1977. “Calibration Force Levels for Bone Conduction Vibrators.” Journal of Speech, Language, and Hearing Research 20 (4): 653–660. doi:10.1044/jshr.2004.653.
- Cobb, K. M., and A. Stuart. 2016. “Auditory Brainstem Response Thresholds to Air- and Bone-Conducted CE-Chirps in Neonates and Adults.” Journal of Speech, Language, and Hearing Research 59 (4): 853–859. doi:10.1044/2016_JSLHR-H-15-0182.
- Development Core Team. 2016. R: A Language and Environment for Statistical Computing. R Found. Stat. Comput. Vienna Austria 0, {ISBN} 3-900051-07-0. doi:10.1038/sj.hdy.6800737.
- Dirks, D., S. F. Lybarger, W. O. Olsen, and B. L. Billings. 1979. “Bone Conduction Calibration.” Journal of Speech and Hearing Disorders 44 (2): 143–155. doi:10.1044/jshd.4402.143.
- Dirks, D. D., and C. Kamm. 1975. “Bone-Vibrator Measurements: Physical Characteristics and Behavioral Thresholds.” Journal of Speech Language and Hearing Research 18 (2): 242. doi:10.1044/jshr.1802.242.
- Dobrev, I., S. Stenfelt, C. Roosli, L. Bolt, F. Pfiffner, R. Gerig, A. Huber, and J. H. Sim. 2016. “Influence of Stimulation Position on the Sensitivity for Bone Conduction Hearing Aids without Skin Penetration.” International Journal of Audiology 55 (8): 439–446. doi:10.3109/14992027.2016.1172120.
- Eichenauer, A., H. Dillon, B. Clinch, and T. Loi. 2014. “Effect of Bone-Conduction Harmonic Distortions on Hearing Thresholds.” The Journal of Acoustical Society of America 136 (2): EL96–EL102. doi:10.1121/1.4885771.
- Elberling, C., and M. Don. 1984. “Quality Estimation of Averaged Auditory Brainstem Responses.” International Journal of Audiology 13 (3): 187–197. doi:10.3109/14992028409043059.
- Elberling, C., D. Scand, M. Don, and C. Elberling. 1994. “Evaluating Residual Background Noise in Human Auditory Brain-Stem Responses.” Journal of Acoustical Society of America 96 (5): 2746–2757. doi:10.1121/1.411281.
- Elsayed, A. M., L. L. Hunter, D. H. Keefe, M. P. Feeney, D. K. Brown, J. K. Meinzen-Derr, K. Baroch, et al. 2015. “Air and Bone Conduction Click and Tone-Burst Auditory Brainstem Thresholds Using Kalman Adaptive Processing in Nonsedated Normal-Hearing Infants.” Ear Hear 36 (4): 471–481. doi:10.1097/AUD.0000000000000155.
- Frank, T., D. C. Byrne, and L. A. Richards. 1988. “Bone Conduction Threshold Levels for Different Bone Vibration Types.” Journal of Speech and Hearing Disorders 53 (3): 295–301. doi:10.1044/jshd.5303.295.
- Gorga, M. P., J. R. Kaminski, K. L. Beauchaine, and B. M. Bergman. 1993. “A Comparison of Auditory Brain Stem Response Thresholds and Latencies Elicited by Air- and Bone-Conducted Stimuli.” Ear Hear 14 (2): 85–94. doi:10.1097/00003446-199304000-00003.
- Hakansson, B. E. 2003. “The Balanced Electromagnetic Separation Transducer a New Bone Conduction Transducer.” Journal of Acoustical Society of America 113: 818–825. doi:10.1121/1.1536633.
- Hall, J. W. 2007. New Handbook of Auditory Evoked Responses. London, UK: Pearson Education.
- Hatton, J. L., R. M. Janssen, and D. R. Stapells. 2012. “Auditory Brainstem Responses to Bone-Conducted Brief Tones in Young Children with Conductive or Sensorineural Hearing Loss.” International Journal of Otolaryngology 2012: 284864. doi:10.1155/2012/284864.
- IHP. 2008. Ontario Infant Hearing Program, Audiologic Assessment Protocol. Version 3.1. Canada. https://www.mountsinai.on.ca/care/infant-hearing-program/documents/IHPAudiologicAssessmentProtocol3.1FinalJan2008.pdf.
- International Electrotechnical Commission (IEC). 2012. IEC 60645-1: 2012. Electroacoustics–Audiometric Equipment–Part 1: Equipment for Pure-Tone Audiometry. Geneva.
- International Organization of Standardization. 2016. Acoustics: Reference Zero for the Calibration of Audiometric Equipment—Part 3: Reference Equivalent Threshold Vibratory Force Levels for Pure Tones and Bone Vibrators.
- Jansson, K.-J. F., B. Håkansson, L. Johannsen, and T. Tengstrand. 2015. “Electro-Acoustic Performance of the New Bone Vibrator Radioear B81: A Comparison with the Conventional Radioear B71.” International Journal of Audiology 54 (5): 334–340. doi:10.3109/14992027.2014.980521.
- Kristensen, S. G., and C. Elberling. 2012. “Auditory Brainstem Responses to Level-Specific Chirps in Normal-Hearing Adults.” Journal of the American Academy of Audiology 23 (9): 712–721. doi:10.3766/jaaa.23.9.5.
- Lightfoot, G. 2013. ABR Masking Level Calculator [WWW Document]. Spreadsheet. http://abrpeerreview.co.uk/onewebmedia/ABRNoiseCalc2013b.xls.
- Lightfoot, G. R. 1979. “Air-borne radiation from bone conduction transducers.” British Journal of Audiology 13 (2): 53–56. doi:10.3109/03005367909078877.
- NHSP. 2013. Guidance for Auditory Brainstem Response Testing in Babies. Version 2.1, March 2013, England. Published by the British Society of Audiology. http://www.thebsa.org.uk/wp-content/uploads/2014/08/NHSP_ABRneonate_2014.pdf.
- Nolan, M., and D. J. Lyon. 1981. “Transcranial Attenuation in Bone Conduction Audiometry.” The Journal of Laryngology and Otology 95 (6): 597–608. doi:10.1017/S0022215100091155.
- Richards, W. D., and T. Frank. 1982. “Frequency Response and Output Variations of Radioear B-71 and B-72 Bone Vibrators.” Ear and Hearing 3 (1): 37–38. doi:10.1097/00003446-198201000-00008.
- Small, S. A., and D. R. Stapells. 2003. “Normal Brief-Tone Bone-Conduction Behavioral Thresholds Using the B-71 Transducer: three Occlusion Conditions.” Journal of the American Academy of Audiology 14 (10): 556–562. doi:10.3766/jaaa.14.10.4.
- Stapells, D. R. 2011. “Frequency-specific Threshold Assessment in Young Infants using the Transient ABR and the Brainstem ASSR.” In Comprehensive Handbook of Pediatric Audiology, edited by R. C. Seewald, and A. M. Tharpe, 409–448. San Diego, CA: Plural Publishing.
- Stenfelt, S. 2012. “Transcranial Attenuation of Bone-Conducted Sound When Stimulation Is at the Mastoid and at the Bone Conduction Hearing Aid Position.” Otology & Neurotology: Official Publication of the American Otological Society, American Neurotology Society [and] European Academy of Otology and Neurotology 33 (2): 105–114. doi:10.1097/MAO.0b013e31823e28ab.
- Stenfelt, S., and R. L. Goode. 2005. “Bone-Conducted Sound: Physiological and Clinical Aspects.” Otology & Neurotology: Official Publication of the American Otological Society, American Neurotology Society [and] European Academy of Otology and Neurotology 26 (6): 1245–1261. doi:10.1097/01.mao.0000187236.10842.d5.
- Stenfelt, S., and S. Reinfeldt. 2007. “A Model of the Occlusion Effect with Bone-Conducted Stimulation.” International Journal of Audiology 46 (10): 595–608. doi:10.1080/14992020701545880.
- Vander Werff, K. R., B. A. Prieve, and L. M. Georgantas. 2009. “Infant Air and Bone Conduction Tone Burst Auditory Brain Stem Responses for Classification of Hearing Loss and the Relationship to Behavioral Thresholds.” Ear Hear 30 (3): 350–368. doi:10.1097/AUD.0b013e31819f3145.