
Abstract
Objective: To examine the relationship between extended high-frequency pure tone hearing thresholds (frequencies 10 to 14 kHz) and working memory capacity (WMC), inhibitory control, and cognitive flexibility.
Design: Experimental study measuring correlations between different high-frequency hearing threshold measures and cognitive measures.
Study: Pure tone audiometry was assessed in the extended high-frequency (frequencies 10, 12.5 and 14 kHz). Subjects were also tested regarding WMC, inhibitory control (response inhibition), and cognitive flexibility (information updating and shifting ability).
Sample: Forty-three subjects between 20 and 29 years old with normal hearing (≤ 20 dB HL) in the frequency range between 0.125 to 8 kHz.
Results: No significant correlations were seen between high-frequency hearing thresholds defined as average best and worst ear high-frequency hearing thresholds and the cognitive measures. Differences between the best and the worst ear showed significant negative correlations with inhibitory control and global executive function (combination score for WMC, inhibitory control and cognitive flexibility).
Conclusions: The present study suggests that global executive functions, more specifically response inhibition, and hearing threshold asymmetry in the extended high-frequency range are interrelated.
Introduction
Hearing thresholds and cognitive functions seem related. Increased pure tone hearing threshold average (PTA; frequencies 0.5, 1, 2, and 4 kHz) in the better ear correlates to poorer executive function in individuals older than 54 years after controlling for confounding factors such as age (Lin et al. Citation2011). Other literature suggests a relationship between sensory input and cognitive performance in older adults in such manner that poorer hearing thresholds are related to poorer cognitive functions (Lindenberger, Scherer, and Baltes Citation2001; Humes et al. Citation2010; Lin Citation2011; Lin et al. Citation2013; Harrison Bush et al. Citation2015; Sheft et al. Citation2015). Lin et al. (Citation2013) showed an independent relationship between poorer hearing thresholds and increased cognitive decline in older adults. Hearing loss is generally caused by lesions in the peripheral auditory pathways and seems not to be influenced by neuropathological conditions related to cognitive decline (Lin et al. Citation2013). Therefore, it is possible that the mechanisms behind the relationship is caused by the effects of hearing loss. Indeed, there are previous studies showing that hearing loss is associated with decreased grey matter volume (Eckert et al. Citation2012; Peelle and Wingfield Citation2016). It has also been suggested that hearing loss results in increased cognitive load and social isolation (Weinstein and Ventry Citation1982; Rabbitt Citation1990; Strawbridge et al. Citation2000; Tun, McCoy, and Wingfield Citation2009). Humes et al. (Citation2010) suggest that cognitive abilities mediate age-related sensory deficits.
Extended high-frequency hearing thresholds deteriorate with increasing age in otologically normal individuals (Jilek, Suta, and Syka Citation2014). Age-related deterioration of hearing thresholds begins at the highest frequencies and progresses to lower frequencies over time with a more rapid deterioration seen among men (ISO 7029 Citation2000; Jilek, Suta, and Syka Citation2014). Previous literature suggests that age-related decline in hearing thresholds are related to the age-related general decline of cells in the cochlea such as reduction of the number of functioning hair cells, shrinking of auditory ganglion nerve cells, and degeneration of stria vascularis (Schmiedt Citation2010). Poorer extended high-frequency pure tone hearing thresholds (frequencies 9 to 14 kHz) correlate to less subcallosal grey matter in subjects with normal or close to normal hearing for frequencies up to 8 kHz (Melcher, Knudson, and Levine Citation2013). As the subcallosal region is also related to cognitive processes involved in for example attention (Diamond Citation2013), it is possible that measures of cognitive functions involved in attention, such as core executive functions, are related to extended high-frequency pure tone hearing thresholds in subjects with normal hearing up to 8 kHz. Furthermore, as speech signal content extends to 16 kHz (Byrne et al. Citation1994), the presence of high-frequency hearing threshold asymmetry could indicate that explicit processing of is required to match for example the incoming speech signals to their long-term representations. Explicit processing requires use of more cognitive resources leaving less for understanding and storing of information (Rönnberg et al. Citation2013), which in turn may reduce the available cognitive resources. If the cognitive resources are used to aid communication over longer periods of time, it is possible that these functional changes result in structural brain changes (Eckert et al. Citation2012; Peelle and Wingfield Citation2016).
Behaviour associated with attention is related with both higher-level executive functions and core executive functions (Diamond Citation2013). The abilities to process, plan, and organise are considered to be higher-level core executive functions. Working memory, inhibitory control, and cognitive flexibility are considered to be core executive functions which are required for higher-level executive functions (Miyake et al. Citation2000; Diamond Citation2013). Simultaneous processing and storing occur in the working memory and is involved in short-term goal maintenance. When assessing working memory capacity it is important to assess the effect of increasing cognitive load so that the task is not too easy or too difficult. The N-back estimates working memory performance by increasing the load in steps while performing the task (Braver et al. Citation1997). It also assesses the ability to do mental arithmetic (Hubber, Gilmore, and Cragg Citation2014). This type of task has previously been used to for example demonstrate that increasing load is related to larger reduction of auditory brainstem responses (Sörqvist, Stenfelt, and Rönnberg Citation2012). Brännström and Waechter (Citation2018) showed that better average high-frequency hearing thresholds in the better ear were related to increased susceptibility to the detrimental effects of noise on reading comprehension in a group of subjects with and without tinnitus and normal hearing. Inhibitory control is used to reduce memory intrusions, reduce interference from irrelevant input, and inhibit behaviour. Inhibitory control seems important in listening task where the listener needs to suppress task-irrelevant sounds (Stenbäck et al. Citation2015; Stenbäck, Hällgren, and Larsby Citation2016). One aspect of inhibitory control can be assessed using the sustained attention response test (SART). SART has been shown to be related to perceived listening effort in subjects with normal hearing (Hua Emilsson, Ellis, et al. Citation2014; Brännström et al. Citation2017). Increased perceived listening effort can be considered to reflect the increased use of cognitive resources when listening in adverse listening conditions (Larsby et al. Citation2005). Inhibitory control supports working memory processing as it removes unnecessary information which in turn facilitates goal maintenance. In a similar fashion, working memory supports inhibitory control by providing information on what is the goal which in turn facilitates decision on what is irrelevant to process. Cognitive flexibility refers to the ability to update information, see things from different perspective and to shift from one task to another. In subjects with normal hearing, those with better cognitive flexibility experienced less perceived listening effort for easier listening tasks in noise (Hua Emilsson, Ellis, et al. Citation2014). Cognitive flexibility requires involvement of both working memory and inhibitory control (Diamond Citation2013). In an experimental set-up where tasks assessing these three core executive function it would be expected to see some relationship between their outcome variables in such manner that higher performance in one task is related to higher performance in another task.
Humes et al. (Citation2010) suggest that cognitive abilities mediate age-related sensory deficits. As both hearing thresholds and cognitive function deteriorates with increasing age (Salthouse Citation1994a, Citation1994b; Salthouse and Coon Citation1994; ISO 7029 Citation2000), it is important to control for the confounding influence age has on the potential relationship between extended high-frequency hearing thresholds and core executive functions. If such a relationship exists in young healthy individuals, it could suggest that cognitive abilities mediate not only age-related auditory deficits. The aim of the present study is to examine the relationship between extended high-frequency pure tone hearing thresholds (frequencies 10 to 14 kHz) and working memory capacity (WMC), inhibitory control and cognitive flexibility in young adult subjects with normal hearing (frequency range 0.125 to 8 kHz).
Method
Initially, 57 participants (students, colleagues, and friends of the authors) were recruited and tested. Of these 43 met the inclusion criteria for the study which were to be between 20 and 29 years old and to have pure tone hearing thresholds in both ears equal to or better than 20 dB HL (frequencies 0.125, 0.250, 0.5, 1, 1.5, 2, 3, 4, 6, and 8 kHz). The age limitation was applied to reduce the risk of detecting age dependent changes in hearing thresholds and cognitive function (Salthouse Citation1994a, Citation1994b; Salthouse and Coon Citation1994; ISO 7029 Citation2000). The study sample consisted of 8 males and 35 females (average age 25.8 years; range 22–29 years). All subjects stated vision that were normal or corrected to normal. The Regional Ethics Board in Lund, Sweden, approved this study (approval number 2014/95).
Pure tone audiometry
Pure tone air conduction audiometry was measured separately in each ear for frequencies 0.125, 0.25, 0.5, 1, 1.5, 2, 3, 4, 6, 8, 10, 12.5, 14, and 16 kHz) using a GN Otometrics Astera2 and circumaural sound-attenuating Sennheiser HDA200 earphones. Pure tone hearing thresholds were measured according to the Hughson-Westlake method as stated in ISO 8253-1 (Citation1998) in a sound treated booth that complied with ISO 8253-1 (Citation1998) regarding the maximum permissible background noise levels. The equipment was calibrated in accordance with ISO 8253-1 (ISO 8253-1 Citation1998), ISO 389-5 (ISO 389-5 Citation2006) and ISO 389-8 (ISO 389-8 Citation2004). As ISO 389-5 does not provide a reference equivalent threshold level for the frequency 16 kHz, this frequency was excluded from analysis.
Working memory
A visual N-back test was used to assess WMC (Kirchner Citation1958; Braver et al. Citation1997). In this test, stimuli are presented sequentially one stimulus at a time. In each trial, the subject’s task is to decide whether the stimulus currently shown at the computer screen is identical to the stimulus presented N trials ago. In the N-back test used in the present study, three N’s were used: 0-back, 1-back, and 2-back. In 0-back, the task was to decide whether a specific stimulus was presented or not. In 1-back, the task was to decide whether the present stimulus was identical to the latest stimulus presentation or not. In 2-back, the task was to decide whether the present stimulus was identical to the penultimate stimulus presentation. The N-back test by Ben Robinson and Becky Fuller (http://step.psy.cmu.edu/scripts-plus/) for E-Studio 2.0 (E-Prime Professional) was used in the present study (Swedish version). Stimulus presentations were made on a computer screen using E-Run 2.0 (E-Prime Professional). Stimuli were letters in upper case that were presented one at a time. The presentation order of the letters was randomised. Thirty trials were used in a run and each run was repeated twice for each N-back condition. In each trial, a single letter was presented during 500 ms. After the presentation of the letter, a white screen was presented during 3000 ms. Subject responses were allowed within these 3500 ms. In a run, 30% of the trials included target stimuli, that is where the N-back condition was met according to the instructions. Responses were made by pressing one keyboard key for target stimuli and another for non-target stimuli. Prior to each N-back condition, subjects made a practice run consisting of 20 trials with seven targets. WMC in each N-back condition was calculated by dividing the accuracy scores by the average response times for target trials (Stenbäck, Hällgren, and Larsby Citation2016). The WMC scores for three N-back conditions were combined into a single variable by calculating the average to reduce the overall number of variables in the study. A higher score indicates higher WMC.
Inhibitory control
SART was used to measure response inhibition (Manly et al. Citation1999). In a trial, a single random number between one (1) and nine (9) was presented on a computer screen and the subject was instructed to press spacebar once on a computer keyboard as fast as possible as a number appeared with one exception: if the target stimulus number three (3) was presented the subject was instructed to withhold response. Each trial had a duration of 1000 ms or until the subject responded. Each trial was followed by 500 ms white screen before the presentation of the next trial. One-hundred and twenty trials were made in a single run and 24 of these trials contained number three (3). The SART was written in E-Studio 2.0 (E-Prime Professional) and tested using E-Run 2.0 (E-Prime Professional). Response inhibition was calculated by dividing the proportion correctly withheld responses by the average response times for non-target trials. A higher score indicates better inhibitory control.
Cognitive flexibility
Cognitive flexibility was assessed using two measures: the Number-Letter task and the Keep Track task (Miyake et al. Citation2000; Hua et al. Citation2014a, Citation2014b). Shifting ability was assessed using the Number-Letter task where each trial was a pair consisting of one number (odd or even) and one letter (upper or lower case). Trials were presented in a clockwise manner with the first trial presented in the upper left corner of a computer screen, the second in upper right corner, third in lower right corner, the fourth in the lower left corner, the fifth in the upper left corner, etc., thus repeating this presentation pattern again. The subjects were instructed to decide if the trials presented in the upper part of the computer screen were “odd” or “even” and if the trials presented in the lower part of the computer screen were “upper” or “lower” case. Subjects responded by pressing the designated keyboard keys (one for “odd”, for “even”, one for “upper”, and one for “lower”). Each trial had a duration of 10,000 ms or until the subject responded. Subjects made 12 practice trials followed by 38 actual trials. The Number Letter task was written in in E-Studio 2.0 (E-Prime Professional) and tested using E-Run 2.0 (E-Prime Professional). Shifting ability was calculated in two steps. First, the accuracy scores for shift trials (i.e. the preceding trial was a no-shift trial) were divided by the average response times for shift trials. Second, the accuracy scores for no-shift trials (i.e. the preceding trial was a shift trial) were divided by the average response times for no-shift trials. Third, the combined scores for shift-trials were subtracted from the combined scores for no-shift trials. Finally, this shifting ability variable was inverted (1/x) to remove the reverse coding. Thus, a higher score indicates better shifting ability.
The ability to update information was assessed using the Keep Track task (Miyake et al. Citation2000; Hua Emilsson, Ellis, et al. Citation2014; Hua, Emilsson, Kähäri et al. Citation2014). Four of six possible word categories (“Countries”, “Animals”, “Colors”, “Metals” “Fruits”, and “Relatives”) were presented in each trial at the top of a computer screen. Twelve content words were selected from all six categories (e.g. “Norway”, “Cat”, “Grey”, “Gold”, “Kiwi”, “Brother”). These content words were then presented in random order and one at a time. Content words were displayed on the screen during 3000 ms followed by 500 ms white screen containing only the four categories. In each trial, one content word represented the first category, two content words represented the second category, three content words represented the third category and four content words represented the fourth category. The remaining two content words in a trial were selected from two other categories not presented at the top of the screen. After the final content word in a trial had been presented, subjects were instructed to report the last content word in each category. Responses were made using paper and pen. Prior to the testing the task was demonstrated to the subjects and they performed two complete practice trials. The actual testing consisted of six trials. Microsoft PowerPoint 2010 (version 14.0) was used to generate and present the task. The proportion correctly recalled content words in these six trials was used as a measure of information updating. A higher score indicates higher ability for information updating.
Overall procedures
This study is a part of a larger project where subjects with hearing loss participate and are compared with subjects with normal hearing. Since at least working memory resources seems to be shared across modalities (Salmela, Moisala, and Alho Citation2014; Quak, London, and Talsma Citation2015) and to avoid audibility concerns in subjects with hearing loss visual cognitive tasks were selected in the larger project. Each subject was tested individually at one session lasting approximately 75 minutes. When required, breaks were allowed. Twenty-nine subjects performed the test in the same predetermined order: otoscopy, pure tone audiometry, N-back, SART, the Number-Letter task, and finally the Keep Track task. This is a design similar to previous studies (Nilsson et al. Citation1997; Enmarker, Boman, and Hygge Citation2006). However, fourteen subjects performed the cognitive tasks in a counterbalanced order to test the potential effects of test order. An additional test not reported on here was also performed. Pure tone audiometry was conducted in a sound treated booth. Subjects performed the cognitive tests in a quiet room while wearing sound attenuating Sennheiser HDA200 earphones to block out any unwanted external noise.
Data analysis
Data are reported as average best ear high-frequency hearing thresholds (BEHFPTA; frequencies 10, 12.5, and 14 kHz), average worst ear high-frequency hearing thresholds (WEHFPTA; frequencies 10, 12.5, and 14 kHz), high-frequency hearing threshold difference score (HFPTAasymmetry), WMC, inhibitory control, shifting ability and information updating, and age. HFPTAasymmetry was calculated as the difference score between BEHFPTA and WEHFPTA as a measure of ear asymmetry. This was done by subtracting BEHFPTA from WEHFPTA. Prior to any analyses, the values in each variable were converted to z-scores. This was done to allow for (1) the combination of shifting ability and information updating into a single variable named cognitive flexibility and (2) the combination of all cognitive variables into a single variable named global executive function. The combinations were made on the assumption that the individual core executive functions are theoretically interrelated. The shifting variable was inverted (1/x) to remove the reverse coding before conversion into z-scores. This means that higher z-scores for the cognitive variables always indicate better performance. All statistical tests were made using the z-scores.
Independent samples t-tests were used to assess differences between the group that made the cognitive tasks in a predetermined order and the group that made the tasks in a counterbalanced order. With a standardised standard deviation of 0.5, an alpha level of 0.05 and a beta level of 0.2, the study has 80% power to detect an effect size of about 0.5.
Pearson’s partial correlation coefficients (r) were calculated between all variables to assess potential relationships. Correlation coefficients of 0.50 with an alpha level of 0.05 and a beta level of 0.20) yielded a sample size of 29 (Hulley et al. Citation2013). In each analysis, an alpha level of 0.05 was considered statistically significant after using Benjamini and Hochberg’s (Citation1995) false discovery rate to calculate a corrected alpha level to adjust for multiple tests.
Parametric statistics were used since the majority of the variables (after conversion to z-scores) were considered to be normally distributed as assessed using the one-sample Kolgomorov-Smirnov test.
Results
Initially, several t-tests were performed to compare performance on the cognitive tasks between the group that made the tasks in a predetermined order and the group that made the tasks in a counterbalanced order. shows average performance along with standard deviations, minima and maxima for the two groups. In the table, the results are reported as unconverted “raw” scores. As shown in the table, the t-test revealed no significant differences in the cognitive tasks between the groups. Based on this analysis, it was assumed that there were no significant test order or fatigue effects for the cognitive tasks and the data from these two groups were pooled together in all following analyses. shows average performance as “raw” scores along with standard deviations, minima and maxima for all subjects. and shows mean and standard deviation for hearing thresholds in right and left ear, respectively, for all subjects at all frequencies. The mean BEHFPTA, WEHFPTA, and HFPTAasymmetry were 1.0 dB HL (standard deviation 8.5, minimum −10.0, maximum 26.7), 5.7 dB HL (standard deviation 9.4, minimum −6.7, maximum 30.0), and 4.7 dB HL (standard deviation 4.9, minimum −0.0, maximum 25.0), respectively.
Figure 1. Mean and standard deviation for pure tone hearing thresholds in right ear for all subjects at all frequencies. N = 43.
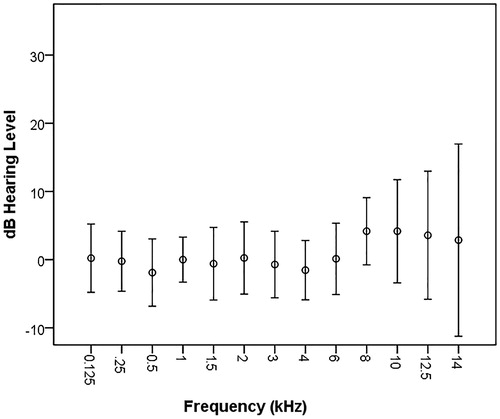
Figure 2. Mean and standard deviation for pure tone hearing thresholds in left ear for all subjects at all frequencies. N = 43.
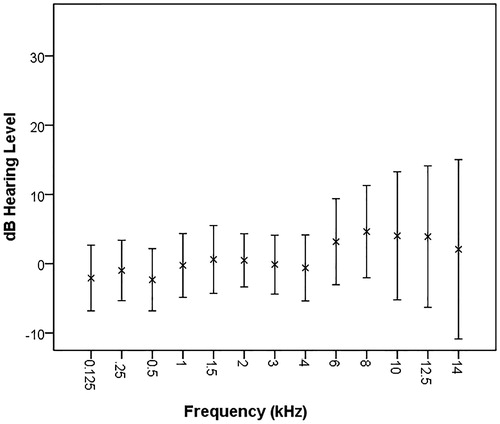
Table 1. Raw mean WMC (average accuracy scores for the three N-back conditions divided by response times for the same conditions), inhibitory control (the proportion correctly withheld responses divided by the average response times for non-target trials), shifting ability (the combined scores for shift-trials subtracted from the combined scores for no-shift trials, see text for more details), and information updating (proportion correctly recalled content words) performance along with standard deviations and minima and maxima.
Table 2. Performance for all subjects pooled together. Otherwise as in .
Correlations between hearing thresholds and core executive functions
First, Pearson’s correlation coefficients were calculated between age and all other variables. Age was not significantly associated with any of the other variables (degrees of freedom, DF = 41, r < ±0.274, p ≥ 0.075). Based on this finding, age was removed from the all following analyses.
Pearson’s correlation coefficients were then calculated between BEHFPTA, WEHFPTA, and HFPTAasymmetry and WMC, inhibitory control, cognitive flexibility, and global executive function. The results are shown in . A strong significant positive correlation was seen between BEHFPTA and WEHFPTA indicating that better hearing thresholds in the best ear were related to better hearing thresholds in the worst ear. WEHFPTA showed a significant positive correlation with HFPTAasymmetry indicating that poorer hearing thresholds in the worst ear were related to larger differences between the best and worst ear. HFPTAasymmetry showed a significant negative correlation with inhibitory control indicating that larger difference between best and worst ear was related to poorer inhibitory control. Inhibitory control showed a significant positive correlation with WMC (see ). This indicates that higher inhibitory control is related to higher WMC. HFPTAasymmetry had a significant negative correlation with global executive function indicating that larger differences between the best and the worst ear was related to poorer global executive function (see ). Since the global executive function was calculated as the sum of the three core executive functions, it showed significant positive correlations with these three individual functions.
Table 3. Pearson's correlation coefficients (r) between BEHFPTA, WEHFPTA, and HFPTAasymmetry and WMC, inhibitory control, cognitive flexibility, and global executive function. Benjamini and Hochberg’s (Citation1995) false discovery rate was used to calculate a corrected alpha level to adjust for the multiple correlations calculated (N = 43).
Figure 3. Scatter plot showing the relationship between HFPTAasymmetry (dB) and inhibitory control (filled circles) and global executive function (open triangles) and shifting ability for individual subjects. The lines represent the linear interpolation for inhibitory control (drawn line) and global executive function (dashed line). A higher score indicates better performance. N = 43.
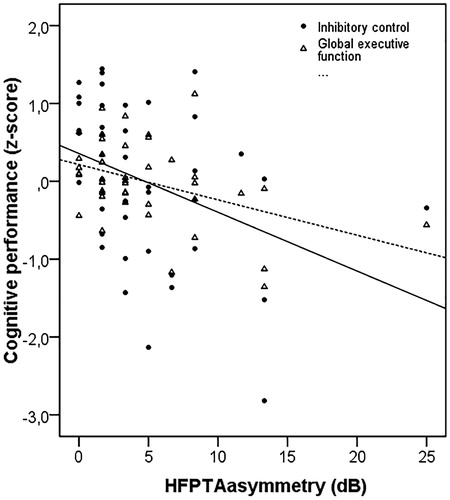
Inhibitory control was correlated to WMC. Therefore, a partial correlation analysis was conducted between inhibitory control and HFPTAasymmetry while controlling for WMC. The correlation remained significant (DF = 40, r = −0.308, p = 0.047). Both inhibitory control and global executive function was correlated with HFPTAasymmetry. z-scores for inhibitory control were first subtracted from the global executive function and then Pearson’s correlation coefficient was calculated between this new variable and HFPTAasymmetry to see if the significant correlation between HFPTAasymmetry and global executive function was driven by inhibitory control. A significant negative correlation was still found (DF =40, r = −0.308, p = 0.044). Taken together, the present findings suggest that increasingly poorer inhibitory control and global executive function are related to increasing differences in high-frequency hearing thresholds between the best and the worst ear.
Discussion
Previous studies suggest that hearing thresholds and cognitive functions are related in individuals older than 54 years in such manner that poorer hearing thresholds are related to poorer cognitive functions (Lindenberger, Scherer, and Baltes Citation2001; Humes et al. Citation2010; Lin Citation2011; Lin et al. Citation2011; Lin et al. Citation2013; Harrison Bush et al. Citation2015; Sheft et al. Citation2015). In the present study, we explored the relationship between core executive functions and high-frequency hearing thresholds in the better and the worst ear in young healthy subjects with normal hearing. Contrary to previous studies (not measuring high-frequency hearing thresholds) we found no significant association between poorer high-frequency hearing thresholds, defined as average pure-tone hearing thresholds, and poorer cognitive abilities. However, we found that increasingly larger differences between the best and the worst ear were related to poorer inhibitory control and global executive function in young healthy adults with normal hearing in the frequency range 0.125 to 8 kHz.
BEHFPTA and WEHFPTA were found to not be directly related to cognitive abilities. It is possible that there is no relation between these measures and cognitive abilities in young healthy subjects with normal hearing. The included subjects in the present study were highly selected. The subjects had hearing thresholds equal to or better than 20 dB HL for frequencies 0.125 to 8 kHz and represented a small age range between 20 and 29 years old. Therefore, it is possible that the use of cognitive resources to aid communication over longer periods of time have not had the time to manifest themselves as structural brain changes (Eckert et al. Citation2012; Peelle and Wingfield Citation2016). Furthermore, the lack of association between BEHFPTA, WEHFPTA, and the different core executive functions may depend on the precision of the pure tone audiometry conducted which may have been too poor. In the present study, pure tone audiometry was conducted using a 5 dB step size and the modified Hughson-Westlake procedure (SAME Citation1993; ISO 8253-1 Citation1998). This procedure results in relatively large test-retest differences. The use of Békésy audiometry with a smaller step size may have increased variance in the sample and revealed relationships that the present hearing threshold measurement did not allow for.
The cognitive tests may not have been precise and accurate enough to measure the hypothesised core executive functions. Two thirds of the subjects made the cognitive tasks in a predetermined test order. This may result in order and fatigue effects that will influence the analysis. The remainder of the subjects made them in a counterbalanced order. The analysis showed that there were no significant differences between the cognitive performance in these two groups which suggests that the test order seems to have only marginal if any influence on the findings. It is possible that more training and familiarisation with the cognitive tasks would have decreased response times and improved accuracy. However, additional training would have increased the test session length and potentially resulted in fatigue effects. Future studies examining training effects in the present test set-up is required. The three core executive functions should not be viewed as three separate cognitive processes: inhibitory control supports working memory processing as it removes unnecessary information which in turn facilitates e.g., goal maintenance, working memory supports inhibitory control by providing information on what is the goal which in turn facilitates decision on what is irrelevant to process, and cognitive flexibility requires involvement of both working memory and inhibitory control (Diamond Citation2013). Therefore, we would expect that these measures covariate. The present findings lend support to the notion that working memory and inhibitory control are interrelated and may support each other during task execution. However, the shared variance was relatively small (less than 10%) suggesting that the present N-back scores and the SART scores to a large extent represent separate functions. WMC and inhibitory control were not related to cognitive flexibility which therefore also seems to represent a separate function. In addition, we examined performance on visual tasks taxing core executive functions. This minimised the possible confounding factors (e.g. audibility) on cognitive performance that would have been encountered if auditory stimuli had been used. Furthermore, inhibitory control was assessed by a test that evaluates response inhibition. Response inhibition can be considered a subcomponent in inhibitory control. Additional tests that assess the other subcomponent interference control (Diamond Citation2013) could provide a more complete examination of the relationship between extended high-frequency hearing thresholds and core executive functions.
Despite a lack of association between the actual measures of high-frequency pure tone hearing thresholds, the present findings showed that increasingly larger differences between the best and the worst ear were related to poorer inhibitory control and global executive function. Since speech signal content extends into the high-frequency range (Byrne et al. Citation1994), the presence of high-frequency hearing threshold asymmetry could indicate that explicit processing of is required to match e.g., the incoming speech signals to their long-term representations. More cognitive resources are required for this explicit processing which in turn leaves less resources available for understanding and storing of information (Rönnberg et al. Citation2013). It is possible that there is an increased use of cognitive resources to aid communication in the presence of ear asymmetry. This would be in line with previous studies showing that inhibitory control and working memory are related to e.g., speech reception performance in noise (Stenbäck et al. Citation2015; Stenbäck, Hällgren, and Larsby Citation2016). It is also possible that the presence of ear asymmetry is a more sensitive measure of high-frequency hearing thresholds when exploring the association between these thresholds and cognitive abilities in young healthy individual with normal hearing. A major limitation of the present study is that it does not provide any information on the mechanisms behind this relationship. These mechanisms are not known, but the findings by Humes et al. (Citation2010) suggest that cognitive abilities can mediate age-related sensory deficits. Based on this, the present findings could suggest that cognitive abilities such as core executive functions mediate not only age-related sensory deficits but also asymmetrical sensory deficits in young healthy individuals.
The present findings suggest that extended high-frequency hearing threshold asymmetry seem related to cognitive function rather than age in the present sample. There is always a risk that age-related changes in both hearing thresholds and cognitive abilities have influenced the present findings. However, to minimise this risk, the age range of the included subjects was limited to 20 to 29 years old. Furthermore, the correlation analysis revealed no relationship between age and any of the measured variables suggesting that the significant correlations seen were not driven by age.
The present findings indicate that even slight changes in hearing in the extended high-frequency region may be related to cognitive abilities. If replicated. this finding may be of importance when e.g., informing about indirect hazards of noise exposure.
Conclusions
The present study suggests that global executive functions, more specifically response inhibition, and hearing threshold asymmetry in the extended high-frequency range are interrelated.
Notification of ethical adherence
The study received approval from the regional ethics committee. The study adhered to the Declaration of Helsinki ethical principles.
Disclosure statemant
The authors alone are responsible for the content and writing of the article. The authors confirm this manuscript is an original contribution, not previously published and not under consideration for publication elsewhere.
| Abbreviations | ||
| WMC | = | working memory capacity |
| PTA | = | pure tone hearing threshold average |
| BEHFPTA | = | best ear high-frequency hearing thresholds. |
References
- Benjamini, T., and Y. Hochberg. 1995. “Controling the False Discovery Rate: A Practical and Powerful Approach to Multiple Testing.” Journal of the Royal Statistical Society Series B 57: 289–300.
- Brännström, K. J., and S. Waechter. 2018. “Reading Comprehension in Quiet and in Noise: Effects on Immediate and Delayed Recall in Realtion to Tinnitus and High-Frequency Hearing Thresholds.” Journal of the American Academy of Audiology 29: 503–511. doi:10.3766/jaaa.16174.
- Brännström, K. J., E. Karlsson, S. Waechter, and T. Kastberg. 2017. “Listening Effort: order Effects and Core Executive Functions.” Journal of the American Academy of Audiology E-pub ahead of print: 1–13. doi:10.3766/jaaa.17024.
- Braver, T. S., J. D. Cohen, L. E. Nystrom, J. Jonides, E. E. Smith, and D. C. Noll. 1997. “A Parametric Study of Prefrontal Cortex Involvement in Human Working Memory.” Neuroimage 5 (1): 349–362. doi:10.1006/nimg.1996.0247.
- Byrne, D., H. Dillon, K. Tran, S. Arlinger, K. Wilbraham, R. Cox, B. Hagerman, et al. 1994. “An International Comparison of Long-Term Average Speech Spectra.” The Journal of the Acoustical Society of America 96 (4): 2108–2120. doi:10.1121/1.410152.
- Diamond, A. 2013. “Executive Functions.” Annual Review of Psychology 64: 135–68. doi:10.1146/annurev-psych-113011-143750.
- Eckert, M. A., S. L. Cute, K. I. Vaden Jr, S. E. Kuchinsky, and J. R. Dubno. 2012. “Auditory Cortex Signs of Age-Related Hearing Loss.” Journal of the Association for Research in Otolaryngology: JARO 13 (5): 703–713. doi:10.1007/s10162-012-0332-5.
- Enmarker, I., E. Boman, and S. Hygge. 2006. “Structural Equation Models of Memory Performance across Noise Conditions and Age Groups.” Scandinavian Journal of Psychology 47 (6): 449–460. doi:10.1111/j.1467-9450.2006.00556.x.
- Harrison Bush, A. L., J. J. Lister, F. R. Lin, J. Betz, and J. D. Edwards. 2015. “Peripheral Hearing and Cognition: Evidence from the Staying Keen in Later Life (SKILL) Study.” Ear and Hearing 36 (4): 395–407. doi:10.1097/AUD.0000000000000142.
- Hua, H., M. Emilsson, R. Ellis, S. Widén, C. Möller, and B. Lyxell. 2014. “Cognitive Skills and the Effect of Noise on Perceived Effort in Employees with Aided Hearing Impairment and Normal Hearing.” Noise and Health 16 (69): 79–88. doi:10.4103/1463-1741.132085.
- Hua, H., M. Emilsson, K. Kähäri, S. Widén, C. Möller, and B. Lyxell. 2014. “The Impact of Different Background Noises: effects on Cognitive Performance and Perceived Disturbance in Employees with Aided Hearing Impairment and Normal Hearing.” Journal of the American Academy of Audiology 25 (9): 859–868. doi:10.3766/jaaa.25.9.8.
- Hubber, P. J., C. Gilmore, and L. Cragg. 2014. “The Roles of the Central Executive and Visuospatial Storage in Mental Arithmetic: A Comparison across Strategies.” Quarterly Journal of Experimental Psychology 67 (5): 936–954. doi:10.1080/17470218.2013.838590.
- Hulley, S. B., S. R. Cummings, W. S. Browner, D. Grady, and T. B. Newman. 2013. Designing Clinical Research: An Epidemiologic Approach. 4th ed. Philadelphia, PA: Lippincott Williams & Wilkins.
- Humes, L. E., D. Kewley-Port, D. Fogerty, and D. Kinney. 2010. “Measures of Hearing Threshold and Temporal Processing across the Adult Lifespan.” Hearing Research 264 (1–2): 30–40. doi:10.1016/j.heares.2009.09.010.
- ISO 8253-1 1998. Acoustics: Audiometric Test Methods Part 1: Basic Pure Tone air and Bone Conduction Threshold Audiometry. Geneva: International Organization for Standardization.
- ISO 7029 2000. Acoustics: Statistical Distribution of Hearing Thresholds as a Function of Age. Geneva: International Organization for Standardization.
- ISO 389-8 2004. Acoustics: Reference Zero for the Calibration of Audiometric Equipment. Part 8: Reference Equivalent Threshold Sound Pressure Levels for Pure Tones and Circumaural Earphones. Geneva: International Organization for Standardization.
- ISO 389-5 2006. Acoustics: Reference Zero for the Calibration of Audiometric equipment. Part 5: Reference Equivalent Threshold Sound Pressure levels for Pure Tones in the Frequency Range 8 kHz to 16 kHz. Geneva: International Organization for Standardization.
- Jilek, M., D. Suta, and J. Syka. 2014. “Reference Hearing Thresholds in an Extended Frequency Range as a Function of Age.” The Journal of the Acoustical Society of America 136 (4): 1821–1830. doi:10.1121/1.4894719.
- Kirchner, W. K. 1958. “Age Differences in Short-Term Retention of Rapidly Changing Information.” Journal of Experimental Psychology 55 (4): 352–358. doi:10.1037/h0043688.
- Larsby, B., M. Hällgren, B. Lyxell, and S. Arlinger. 2005. “Cognitive Performance and Perceived Effort in Speech Processing Tasks: Effects of Different Noise Backgrounds in Normal-Hearing and Hearing-Impaired Subjects.” International Journal of Audiology 44 (3): 131–143. doi:10.1080/14992020500057244.
- Lin, F. R. 2011. “Hearing Loss and Cognition among Older Adults in the United States.” The Journals of Gerontology. Series A, Biological Sciences and Medical Sciences 66 (10): 1131–1136.
- Lin, F. R., L. Ferrucci, E. J. Metter, Y. An, A. B. Zonderman, and S. M. Resnick. 2011. “Hearing Loss and Cognition in the Baltimore Longitudinal Study of Aging.” Neuropsychology 25 (6): 763–770. doi:10.1037/a0024238.
- Lin, F. R., K. Yaffe, J. Xia, Q.-L. Xue, T. B. Harris, E. Purchase-Helzner, S. Satterfield, H. N. Ayonayon, L. Ferrucci, and E. M. Simonsick. 2013. “Hearing Loss and Cognitive Decline in Older Adults.” JAMA Internal Medicine 173 (4): 293–299. doi:10.1001/jamainternmed.2013.1868.
- Lindenberger, U., H. Scherer, and P. B. Baltes. 2001. “The Strong Connection between Sensory and Cognitive Performance in Old Age: not Due to Sensory Acuity Reductions Operating during Cognitive Assessment.” Psychology and Aging 16 (2): 196–205. doi:10.1037/0882-7974.16.2.196.
- Manly, T., I. H. Robertson, M. Galloway, and K. Hawkins. 1999. “The Absent Mind: further Investigations of Sustained Attention to Response.” Neuropsychologia 37 (6): 661–670. doi:10.1016/S0028-3932(98)00127-4.
- Melcher, J. R., I. M. Knudson, and R. A. Levine. 2013. “Subcallosal Brain Structure: correlation with Hearing Threshold at Supra-Clinical Frequencies (>8 kHz), but Not with Tinnitus.” Hearing Research 295: 79–86. doi:10.1016/j.heares.2012.03.013.
- Miyake, A., N. P. Friedman, M. J. Emerson, A. H. Witzki, A. Howerter, and T. D. Wager. 2000. “The Unity and Diversity of Executive Functions and Their Contributions to Complex “Frontal Lobe” Tasks: A Latent Variable Analysis.” Cognitive Psychology 41 (1): 49–100. doi:10.1006/cogp.1999.0734.
- Nilsson, L.-G., L. Bäckman, K. Erngrund, L. Nyberg, R. Adolfsson, G. Bucht, S. Karlsson, M. Widing, and B. Winblad. 1997. “The Betula Prospective Cohort Study: Memory, Health, and Aging.” Aging, Neuropsychology, and Cognition 4 (1): 1–32. doi:10.1080/13825589708256633.
- Peelle, J. E., and A. Wingfield. 2016. “The Neural Consequences of Age-Related Hearing Loss.” Trends in Neurosciences 39 (7): 486–497. doi:10.1016/j.tins.2016.05.001.
- Quak, M., R. E. London, and D. Talsma. 2015. “A Multisensory Perspective of Working Memory.” Frontiers in Human Neuroscience 9: 197.
- Rabbitt, P. 1990. “Mild Hearing Loss Can Cause Apparent Memory Failures Which Increase with Age and Reduce with IQ.” Acta Oto-Laryngologica. Supplementum 476: 167–175. discussion 176.
- Rönnberg, J., T. Lunner, A. Zekveld, P. Sörqvist, H. Danielsson, B. Lyxell, O. Dahlström, et al. 2013. “The Ease of Language Understanding (ELU) Model: theoretical, Empirical, and Clinical Advances.” Frontiers in Systems Neuroscience 7: 31.
- Salmela, V. R., M. Moisala, and K. Alho. 2014. “Working Memory Resources Are Shared across Sensory modalities.” Attention, Perception & Psychophysics 76 (7): 1962–1974. doi:10.3758/s13414-014-0714-3.
- Salthouse, T. A. 1994a. “Age-Related Differences in Basic Cognitive Processes: implications for Work.” Experimental Aging Research 20 (4): 249–255. doi:10.1080/03610739408253974.
- Salthouse, T. A. 1994b. “Aging Associations: influence of Speed on Adult Age Differences in Associative Learning.” Journal of Experimental Psychology. Learning, Memory, and Cognition 20 (6): 1486–1503. doi:10.1037/0278-7393.20.6.1486.
- Salthouse, T. A., and V. E. Coon. 1994. “Interpretation of Differential Deficits: The Case of Aging and Mental Arithmetic.” Journal of Experimental Psychology. Learning, Memory, and Cognition 20 (5): 1172–1182. doi:10.1037/0278-7393.20.5.1172.
- SAME 1993. “Statistical Aspects on Measurement Accuracy.” Chapter 3 in Manual of practical audiometry, edited by S. D. Arlinger, 24–30. Volume 2. London: Whurr Publishers Ltd.
- Schmiedt, R. A. 2010. The physiology of cochlear presbyacusis. In The Aging Auditory System, edited by Gordon-Salant, R., D. Frisina, R. R. Fay and A. N. Popper, 9–38. New York: Springer Science.
- Sheft, S., V. Shafiro, E. Wang, L. L. Barnes, and R. C. Shah. 2015. “Relationship between Auditory and Cognitive Abilities in Older Adults.” PLoS One 10 (8): e0134330. doi:10.1371/journal.pone.0134330.
- Stenbäck, V., M. Hällgren, and B. Larsby. 2016. “Executive Functions and Working Memory Capacity in Speech Communication under Adverse Conditions.” Speech, Language and Hearing 19 (4): 218–226. doi:10.1080/2050571X.2016.1196034.
- Stenbäck, V., M. Hällgren, B. Lyxell, and B. Larsby. 2015. “The Swedish Hayling Task, and Its Relation to Working Memory, Verbal Ability, and speech-recognition-in-noise.” Scandinavian Journal of Psychology 56 (3): 264–272. doi:10.1111/sjop.12206.
- Strawbridge, W. J., M. I. Wallhagen, S. J. Shema, and G. A. Kaplan. 2000. “Negative Consequences of Hearing Impairment in Old Age: A Longitudinal Analysis.” The Gerontologist 40 (3): 320–326. doi:10.1093/geront/40.3.320.
- Sörqvist, P., S. Stenfelt, and J. Rönnberg. 2012. “Working Memory Capacity and Visual-Verbal Cognitive Load Modulate Auditory-Sensory Gating in the Brainstem: Toward a Unified View of Attention.” Journal of Cognitive Neuroscience 24 (11): 2147–2154. doi:10.1162/jocn_a_00275.
- Tun, P. A., S. McCoy, and A. Wingfield. 2009. “Aging, Hearing Acuity, and the Attentional Costs of Effortful Listening.” Psychology and Aging 24 (3): 761–766. doi:10.1037/a0014802.
- Weinstein, B. E., and I. M. Ventry. 1982. “Hearing Impairment and Social Isolation in the Elderly.” Journal of Speech and Hearing Research 25 (4): 593–599. doi:10.1044/jshr.2504.593.