
 ?Mathematical formulae have been encoded as MathML and are displayed in this HTML version using MathJax in order to improve their display. Uncheck the box to turn MathJax off. This feature requires Javascript. Click on a formula to zoom.
Abstract
Self speech recognition tests in quiet and noise at home are compared to the standard tests performed in the clinic. Potential effects of stimuli presentation modes (loudspeaker or audio cable) and assessment (clinician or self-assessment at home) on test results were investigated. Speech recognition in quiet was assessed using the standard Dutch test with monosyllabic words. Speech recognition in noise was assessed with the digits-in-noise test. Sixteen experienced CI users (aged between 44 and 83 years) participated. No significant difference was observed in speech recognition in quiet between and presentation modes. Speech recognition in noise was significantly better with the audio cable than with the loudspeaker. There was no significant difference in speech recognition in quiet at 65 dB and in speech recognition in noise between self-assessment at home and testing in the clinic. At 55 dB, speech recognition assessed at home was slightly but significantly better than that assessed in the clinic. The results demonstrate that it is feasible for experienced CI users to perform self-administered speech recognition tests at home. Self-assessment by CI users of speech recognition in quiet and noise within the home environment could serve as an alternative to the tests performed in the clinic.
Introduction
The care of cochlear implant (CI) patients is intensive, and it is provided by specialised cochlear implant centres. Throughout the first year of implantation, CI users visit their implant centres frequently, often followed by annual visits. The Netherlands has eight cochlear implant centres (one in each university medical centre), all located in larger cities. A substantial number of patients must travel considerable distances to reach their cochlear implant centres. The number of newly implanted CI users is increasing rapidly due to changing regulations, expanding candidacy criteria and technical improvements in CI, which results in an increase in the number of CI candidates. In the Netherlands, the number of CI users has increased from approximately 1500 patients in 2005 to 7000 patients in 2016, while the number of cochlear implant centres has remained the same (OPCI, Citation2018). The growing number of CI users (both new and experienced) is increasing the workload of cochlear implant centres. Remote testing and programming or self-administered home testing could result in both time and cost savings for cochlear implant centres, as well as for patients. Various applications of remote tests have been studied in the past, including intraoperative testing (Shapiro et al. Citation2008) and programming (Botros, Banna, and Maruthurkkara Citation2013; McElveen et al. Citation2010; Ramos et al. Citation2009; Wesarg et al. Citation2010). Hughes et al. (Citation2012) and Goehring et al. (Citation2012) demonstrated that testing of speech recognition at remote sites yield unreliable test results. The objective of the current study is to compare newly developed self-administered tests of speech recognition abilities in quiet and in noise within a home environment to standard clinical tests.
Speech recognition testing is part of a clinical routine for CI users, and it is typically performed in a soundbooth. Speech recognition can be assessed in quiet and in noise. In the Netherlands, such tests are based on sentences (Plomp and Mimpen Citation1979; Versfeld et al. Citation2000), monosyllabic words (Bosman and Smoorenburg Citation1995), or digit-triplets (Smits, Goverts, and Festen Citation2013). In newly implanted users, speech recognition is assessed approximately six times during the intensive rehabilitation programme (i.e. the first 3–6 months after implantation). For experienced CI users, it is assessed annually, in order to monitor either progress or decline. Speech recognition tests are typically performed with stimuli presented through a loudspeaker, after which the CI patient is asked to verbally repeat what he or she has heard. A clinician judges the correctness of the response and registers the score.
Self-administered home testing of speech recognition abilities in CI users requires technical adjustments if it is to become a viable alternative for testing in the clinic. First, the consistent and accurate presentation of stimuli is of paramount importance to the ability of detecting changes in speech recognition scores and meeting clinical standards. In studies by Hughes et al. (Citation2012) and by Goehring et al. (Citation2012), poorer speech recognition scores were obtained for stimuli presented with a loudspeaker when assessed in remote sites (e.g. a small conference room with videoconference technology), when compared to regular testing in a soundbooth. Background noise and reverberation were the most important factors that had a negative influence on speech recognition in the remote condition. Second, the home tests require the CI patients to connect the audio cable and type their responses on the tablet computer. It is therefore important that the automated evaluation of the response by the application is similar to the manual evaluation by clinicians when scoring verbal responses in the clinic (Francart, Moonen, and Wouters Citation2009). The algorithms used to judge the patient’s response in self-administered home tests should distinguish between deviations of the target word and the typed response due to misunderstandings of phonemes and those due to the individual’s spelling ability.
To overcome the challenges identified in the studies by Goehring et al. (Citation2012) and Hughes et al. (Citation2012), the use of an audio cable for sound delivery to the CI in speech recognition testing was examined (De Graaff et al. Citation2016). An audio cable was used to create a direct coupling between the sound processor and the audio port of a tablet computer. It provided a direct mode for presenting the stimuli to the CI without the interference of background noise and reverberation. The study showed that stimuli can be presented at predefined levels using an audio cable. Although the study revealed a slight difference in frequency response between the microphone input and audio cable input, this difference did not have any significant effect on speech recognition scores in quiet or in noise. The authors therefore concluded that the use of an audio cable is a viable alternative to the use of a loudspeaker and that it can thus be used to detect changes in speech recognition scores.
The study by De Graaff et al. (Citation2016) focussed on the technical setup, calibration and the use of an audio cable instead of a loudspeaker to present stimuli during speech recognition testing. The objective of the current study was to compare the outcomes of self-administered home tests of speech recognition abilities in quiet and in noise to the outcomes of standard tests in the clinic. We hypothesised that the results of the home speech recognition tests would not be significantly different from the results of tests performed in the clinic. Potential effects of different stimuli presentation modes (i.e. loudspeaker or audio cable) and test format (soundbooth testing by a clinician or self-administered home testing) were investigated separately.
Materials and methods
Study participants
A power analysis (G*Power 3.1) showed that a minimum of 12 participants were needed to detect a 1 dB difference in speech recognition in noise (based on the SEM of 1.1 dB for the digits-in-noise test in CI users by Kaandorp et al. (Citation2015)) between conditions (power = 0.82). Sixteen adult unilateral CI users (eight males; eight females) participated in this study. The average age was 64 years (range: 44 to 83 years). All participants were native speakers of Dutch. All CI users were postlingually deaf, with the onset of severe bilateral hearing impairment after the age of seven years. As a criterion for inclusion, all participants must have scored at least 60% on the consonant-vowel-consonant (CVC) test (phoneme scoring) during the last annual visit to the clinic. This inclusion criterion was set because a minimum speech recognition score in quiet is required to be able to assess speech recognition in noise with the digits-in-noise test (Kaandorp et al. Citation2015; Smits, Goverts, and Festen Citation2013). No selection criteria were set in terms of experience with the use of computers. All CI users had at least one year of experience with the CI, and all were using the CochlearTM Nucleus® CP910 sound processor. Participants enrolled in the study voluntarily and provided informed consent in the beginning of the study. The participants received a fee of €7.50 per hour and were reimbursed for their travel expenses. The study was approved by the Medical Ethics Committee of VU University Medical Center. lists the demographic characteristics of the participants.
Table 1. Demographic characteristics of the participants.
Study design
This study was conducted as a prospective within-subject repeated measures study, in which the individual subjects served as their own controls. Speech recognition performance was assessed in three test sessions. The first and third sessions took place in the clinic, and the second session took place at the participants’ home. The three sessions were completed within 1–2 weeks. Details of the three test sessions are described in the following paragraphs and listed in . All participants completed the entire study protocol across the three sessions.
Table 2. Summary of test procedures and standard errors of measurements (SEM) for speech recognition in quiet (65 and 55 dB) and noise (adaptive and fixed procedures).
The data acquired in the first two sessions were used to investigate the potential effect of stimuli presentation mode (loudspeaker or audio cable) and test format (soundbooth testing by a clinician or self-administered home testing). The third session was added as a control condition to identify potential learning effects for speech recognition in quiet. Speech recognition in noise was also assessed in the third session. However, the tests were performed with a different type of masking noise. These data were described elsewhere (De Graaff et al. Citation2016). The order of the test sessions was not counterbalanced across the participants, but it did follow a sequence that could easily be implemented in a standard clinical setting. The majority of the participants needed guidance and training in the use of the audio cable and tablet computer to self-administer the speech recognition tests. Therefore, the first session not only served as a test session, but also served as a training session for the self-assessment of the tests to be performed at home.
In the remainder of this article, the tests with the loudspeaker in the clinic will be referred to as clinic + loudspeaker, with the terms clinic + audio cable and home + audio cable referring to the tests performed with an audio cable in the clinic and at home, respectively.
Test procedures
Speech recognition was assessed using monosyllabic words in quiet and digit-triplets in noise. The order of the tests was fixed, and each test was performed three times in each session.
Speech recognition in quiet
The monosyllabic words in the speech recognition tests have a CVC structure and were pronounced by a female Dutch speaker (Bosman and Smoorenburg Citation1995). The CVC words were presented in quiet at 55 and 65 dB SPL. The two different presentation levels of 55 and 65 dB SPL were selected, as they are most representative of speech levels in daily life and are commonly used to assess speech recognition in quiet within the context of clinical practice in the Netherlands. At each presentation level, three lists of 12 CVC words were presented in each condition. Different lists were used for each test in a different condition, but they were the same for all participants. The subjects were instructed to repeat or enter everything they understood, even if it was a single phoneme or a nonsense word. The response on the first word was not included in the calculation of the test score. Scores for speech recognition in quiet were calculated as the percentage of 33 phonemes that had been recognised correctly.
The responses were typed by the CI patient on the tablet computer and were automatically compared to the presented CVC word. Firstly, the software identified the middle phoneme by selecting it from a list of all the possible vowels and vowel combinations, and then scored it by comparing it to the middle phoneme of the presented word. Finally, the first and last phonemes were identified and scored. A set of rules was defined in order to allow the software application to determine the correctness of the typed responses, allowing for specific deviations in the spelling of the target response. For example, graphemes that represented the same phoneme in Dutch (e.g. “ei” and “ij” for the diphthong /ɛi/, or “d” and “t” for the word final consonant /t/) were both assessed as correct representations of the target phoneme.
Speech recognition in noise
The standard digits-in-noise speech recognition test (Smits, Goverts, and Festen Citation2013) uses 24 digit-triplets (e.g. 6-5-2) presented in steady-state speech-shaped noise. The digit-triplets are selected at random from a list of 120 digit-triplets. The test is designed to estimate the speech reception threshold (SRT), which represents the signal-to-noise ratio (SNR) at which the listener can recognise 50% of the triplets correctly.
The digit-triplets were presented at varying SNRs following an adaptive strategy, with the overall presentation level fixed at 65 dBA (i.e. the level of the mixed speech and noise signals was kept constant). The current study used masking noise which was presented continuously throughout the test. The initial SNR was set at 0 dB SNR. The SNR of each digit-triplet depended on the correctness of the response on the previous digit-triplet, with the subsequent digit-triplet presented at a two dB higher SNR after an incorrect response, and at a two dB lower SNR after a correct response. To be scored as a correct response, all three digits must be repeated in the order presented.
In this study, the actual test was preceded by two dummy digit-triplets with a fixed SNR of 0 dB in order to ensure that the noise reduction algorithms of the sound processor had settled, while maintaining the attention of the test subject. Each test thus consisted of a total of 26 digit-triplets. The SNR of the virtual 27th digit-triplet was based on the SNR and correctness of the response of the 26th digit-triplet. The SRT was calculated as the average SNR of digit-triplets 7 to 27, omitting the first six digit-triplets of the test (two dummy digit-triplets and the first four digit-triplets of the test). In each condition, three digits-in-noise tests were performed. The first measurement was a practice list, which was not included in the final analysis, and the final two measurements were treated as test and retest.
A fixed SNR procedure was used in addition to the standard adaptive procedure. This procedure uses a fixed SNR to assess the percentage of correctly recognised digit-triplets. The average SRT of the test and retest of the adaptive digits-in-noise tests in the clinic + loudspeaker condition was used as the fixed SNR, for all conditions and was therefore different for each participant. The fixed SNR procedure was chosen because the speech recognition score is most sensitive to change around 50% speech recognition (i.e. the SRT measured with the adaptive procedure). At this point, the slope of the psychometric curve is at its steepest.
The score of the fixed procedure was calculated as the percentage of correctly identified digit-triplets in the series of digit-triplets 7-27 (see description above). In this context as well, three measurements of the digits-in-noise test were administered, with the first measurement (i.e. the practice test) excluded from the analyses.
Technical setup
The speech recognition tests were administered with a tablet computer (Lenovo ThinkPad 10, Lenovo) using software developed by Cochlear Technology Center (Mechelen, Belgium). A visual cue was provided along with the presentation of the stimulus, in order to alert the participant to the digit-triplets or words. The loudspeaker and the audio cable setups were calibrated to ensure equal presentation levels, regardless of presentation mode (De Graaff et al. Citation2016). Briefly, the accuracy of the internal sound level metre of the CP910 sound processor was determined by comparing the sound pressure levels read out directly from the internal sound level metre to those measured with a Bruël and Kjaer Type 2250 sound level metre. Pure tones and speech-shaped noise were used as calibration signals. The differences that were found were all within 1 dB. The internal sound level metre of the sound processor was subsequently used to adjust the output signal of the tablet computer in order to achieve the designated level in the CP910 sound processor. The loudspeaker set-up was calibrated at the distance where CI patients are seated during testing (approximately 70 cm). The calibration procedure ensured that the intensity of the internal signals in the sound processor were identical to the acoustic signals delivered through the loudspeaker and the electrical signals delivered through the audio cable. For the CI user, therefore, an acoustic signal of 65 dB SPL delivered through the loudspeaker should be equal to the 65 dB signal delivered through the audio cable. Throughout this article, the levels of the signals delivered through the loudspeaker and audio cable are expressed in dB, thus corresponding to the assumed equivalence in signal level for the CI user.
For the tests with the loudspeaker, the tablet computer was connected to an external sound card (Creative Sound Blaster X-FI HD SB1240, Creative Labs) which was connected to a loudspeaker (Genelec HT 205). The tablet computer was connected to a monitor screen to ensure that the participants could see the visual cue on the monitor screen, while the clinician used the tablet computer to record the participant’s responses. For the tests with the audio cable, the tablet computer was disconnected from the external sound card and monitor screen. The participants could look at the tablet computer screen to see the visual cue. The audio cable was connected to the tablet computer and inserted into the accessory socket of the CI.
Prior to the measurements, the participants were asked about the programme and volume settings they preferred in daily life. If a participant used multiple programmes and/or changed volume and sensitivity settings, a single programme with defined volume and sensitivity settings was chosen for the assessment of all speech recognition tasks. Participants were instructed to use the same settings throughout the different test conditions. To ensure that the participants received sound only through the audio cable and not mixed with sound received through the microphones when using the audio cable, the accessory mixing ratio was set to “accessory only”. Finally, the microphone covers of each participant’s CI were replaced before testing. The CI users who used contralateral hearing aids in daily life did not use them during the tests. The contralateral ear was not occluded, but thresholds were at a level at which no contribution to speech recognition could be expected from the unaided ear.
Experimental setup: Clinic
The tests in the clinic were performed in a soundbooth with a clinician, who typed the responses of the participant. In the clinic, the participants were tested in two conditions. First, the tests were performed with a loudspeaker, with the participants seated in front of the loudspeaker at a distance of approximately 70 cm. The audio cable was subsequently connected to the sound processor and tablet computer, in order to perform the same tests with the audio cable.
Experimental setup: Home
At home, participants connected the audio cable to the tablet computer and their CI processor, and then launched the application. Participants entered their responses on the tablet computer. To overcome potential problems with the use of the tablet computer or the execution of the tests in the home environment, the participants received manual and brief instructions during their first session in the clinic.
Results
Reliability
The test–retest reliability of the tests in the various conditions was assessed according to the standard error of measurement (SEM) for a single test, which reflects the agreement between measurements. The sum of squares of the standard deviations (SD) of the different measurements for each subject was divided by the number of test subjects (n). Subsequently, the SEM was calculated by taking the square root of this number.1 The SEM for the adaptive digits-in-noise test (1.2 dB, 1.7 dB and 1.2 dB for the clinic + loudspeaker, clinic + audio cable, and home + audio cable conditions, respectively) is similar to the value of 1.1 dB observed in the study by Kaandorp et al. (Citation2015). The SEM values for speech recognition in quiet and noise are listed in .
Speech recognition in quiet
For statistical analyses, the speech recognition in quiet scores were transformed to rationalised arcsine units (RAU) (Sherbecoe and Studebaker Citation2004; Studebaker Citation1985) to normalise variance across the range of scores. Paired samples t tests were conducted to test the significant differences between speech recognition in quiet scores in various conditions for 65 and 55 dB presentation levels separately. First, the outcome of the self-administered home test for speech recognition in quiet was compared to the standard test in the clinic. Speech recognition in quiet assessed with a loudspeaker and audio cable at 65 dB did not differ significantly from each other. At 55 dB, speech recognition in quiet in the clinic + loudspeaker condition were slightly but significantly lower than the scores in the home + audio cable condition.
Because of the significant difference between the clinic + loudspeaker and home + audio cable condition with regard to speech recognition in quiet at 55 dB, subsequent t tests for paired samples were conducted for 55 dB. A Bonferroni correction for multiple comparisons was used, with a p-value less than 0.05/3 = 0.017 regarded as statistically significant. First, a paired samples t test was conducted to investigate potential effects of presentation mode (loudspeaker or audio cable). No significant difference in speech recognition in quiet at 55 dB between clinic + loudspeaker and clinic + audio cable was observed. Second, a paired samples t test was conducted to investigate potential effects of the test format (soundbooth testing by a clinician or self-administered home testing). Speech recognition in quiet assessed in the home + audio cable condition was significantly better than the CVC recognition assessed in the clinic + audio cable condition.
Finally, speech recognition in quiet assessed in the first and third session in the clinic with a loudspeaker were compared for the sound pressure levels of 55 dB and 65 dB, separately. For both presentation levels, speech recognition in quiet assessed in the first clinic + loudspeaker condition was significantly lower than speech recognition in quiet assessed in the third session. The mean (±SD) and individual scores for speech recognition in quiet at 65 dB and 55 dB presentation levels in different conditions, and the results of the statistical analyses are depicted in and listed in .
Figure 1. Speech recognition in quiet measured in four different conditions across the three test sessions. In each test condition, CVC words were presented at 65 dB (left panel) and 55 dB (right panel), respectively. The symbols represent individual scores and the horizontal lines represent mean and ±1 standard deviations.
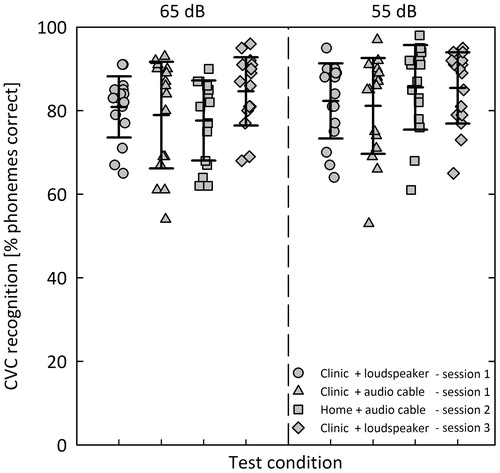
Table 3. Means and standard deviations (SD), and summary of paired samples t test results for speech recognition in quiet and in noise.
Speech recognition in noise
Digits-in-noise adaptive procedure
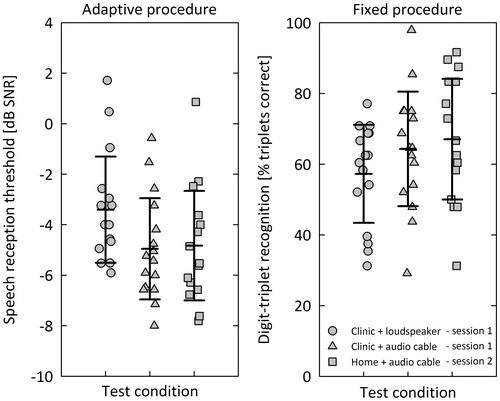
A paired samples t test was conducted to compare the mean SRT assessed in the clinic and at home. The SRT assessed in the clinic + loudspeaker condition was significantly lower (i.e. better) than the SRT assessed in the home + audio cable condition.
Paired samples t tests were conducted to investigate potential differences in presentation mode (loudspeaker or audio cable) and test format (soundbooth testing by a clinician or self-administered home testing). A Bonferroni correction for multiple comparisons was used, with a p-value smaller than 0.05/3 = 0.017 regarded as statistically significant. The SRT assessed in the clinic + loudspeaker condition was significantly higher (i.e. worse) than the SRT assessed in the clinic + audio cable condition. No significant difference in SRT between soundbooth testing by a clinician and self-administered home testing was observed. The mean (±SD) and individual scores for the adaptive and fixed digits-in-noise test procedures are presented in . The results of the statistical analyses are summarised in .
Figure 2. Speech recognition in noise measured in three different conditions using the adaptive (left panel) and fixed (right panel) procedures. The digits-in-noise test was used to obtain speech reception thresholds in dB SNR from the adaptive procedure and % triplets correct scores from the fixed procedure. The symbols represent individual scores and the horizontal lines represent mean and ±1 standard deviations.
Digits-in-noise fixed procedure
Before the statistical analyses were performed, the digit-triplet recognition scores were transformed to RAU scores. A t test for paired samples was conducted to compare the digit-triplet recognition assessed in the clinic and at home. The digit-triplet recognition was not significantly different between the clinic + loudspeaker and home + audio cable conditions.2
Discussion
The objective of this study was to compare the outcomes of self-administered home tests of speech recognition abilities in quiet and in noise to the outcomes of standard tests performed in the clinic. We investigated potential effects of stimuli presentation modes (loudspeaker or audio cable) and test format (soundbooth testing by a clinician or self-administered home testing). We hypothesised that the results of the home speech recognition tests would not be significantly different from the results of tests performed in the clinic. The study revealed no significant difference between measurements taken with a loudspeaker and those taken with an audio cable for speech recognition in quiet. The measurements for speech recognition in noise, however, were significantly lower (i.e. better) with the audio cable than they were with the loudspeaker, but there was no significant difference between the SRT assessed in the clinic or at home.
Despite the fact that more than half of our participants were 60 years or older, all were able to perform the self-administered home tests without any reported problems. All of the participants reported positive experiences with the self-administered home tests: they considered it easy to connect the audio cable, launch the application and perform the tests. The results are thus promising, and they indicate that self-administered home testing is a feasible option for the standard clinical adult CI population. Several patients indicated that they were not proficient in the use of computers. Even though we emphasised to prospective candidates that participation in the study did not require any experience in computer use, bias might have been present in terms of cooperation, intelligence and computer use, as all of the participants of this study were volunteers. In addition, all of our study participants had relatively good average SRTs. The average SRT −3.4 (±2.2) dB SNR in the loudspeaker condition is lower (i.e. better) than the average SRT of −1.8 (±2.7) dB SNR reported by Kaandorp et al. (Citation2015) for a group of 18 adult CI users. The average monaural SRT for a group of 12 normal-hearing adults was −9.3 (±0.7) dB SNR (Kaandorp et al. Citation2015). Kaandorp et al. (Citation2015) presented the stimuli with a loudspeaker and, in contrast to our study, they used discontinuous noise with silent periods after each digit-triplet. The relatively slow-acting advanced sound processing features (i.e. noise reduction and adaptive algorithms) incorporated into CI devices need time to become fully active during speech recognition testing. The results of speech recognition tests with discontinuous noise may be affected by these sound processor features.
The test–retest reliability was assessed by means of the SEM, which reflects the agreement between measurements. The SEM values were calculated separately for all conditions, and showed good overall agreement between measurements (). Most importantly, the SEM values indicate that the test–retest reliability of the home tests is in no way inferior to the test–retest reliability of the measurements taken in the clinic.
The first part of this study concerns the evaluation of potential effects of stimuli presentation modes on speech recognition scores. Contrary to our hypothesis, significantly lower (i.e. better) SRTs (digits-in-noise, adaptive procedure) were observed in the clinic + audio cable condition than in the clinic + loudspeaker condition. In a previous study, De Graaff et al. (Citation2016) found lower (i.e. better) SRTs measured in the audio cable condition with original signals compared to SRTs measured in the audio cable condition with signals that were shaped to match the exact frequency characteristic of the loudspeaker condition exactly. The difference, however, was not significant. This finding does not support the hypothesis of this study that the presentation modes (loudspeaker or audio cable) yield equal results. It is likely that many factors make some individual contribution to the difference in SRT scores assessed with the loudspeaker and those assessed with the audio cable. The acoustics of the soundbooth may have had a slight negative effect, and the aforementioned difference in frequency characteristics may also have had an effect. Larger differences between audio cable input and microphone input could arise between individuals due to head movements and differences in head diffraction. No significant differences were found for different presentation modes for the fixed digits-in-noise test procedure, or for CVC recognition at 65 and 55 dB SPL.
Given the significant difference in the SRT scores obtained with the loudspeaker and those obtained with the audio cable in the present study, the SRT results obtained in the clinic cannot be compared directly to those obtained at home through self-assessment with an audio cable. A reference measurement with the home setup is therefore needed in order to compare the speech recognition assessed at home to the speech recognition assessed in the clinic. This reference measurement should be obtained in the clinic with an audio cable. One benefit of using an audio cable to assess speech recognition in the clinic is that it eliminates the necessity of taking the measurements in soundbooths. Furthermore, the use of an audio cable bypasses the possible negative effects of the environmental characteristics that were identified in the studies by Hughes et al. (Citation2012) and by Goehring et al. (Citation2012). One possible disadvantage of the direct administration of sound through an audio cable is that it is not possible to assess the functionality of the microphone or to demonstrate the advantage of directional microphones. Microphone covers are likely to become dirty, thereby negatively affecting speech recognition in daily life. If an audio cable is used to assess speech recognition, therefore bypassing the microphone, this could result in speech recognition scores that are more favourable than those produced with a loudspeaker. It is thus possible that the speech recognition assessed with an audio cable may not always reflect actual speech recognition in daily life.
The second part of this study concerns the evaluation of potential effects of test format (soundbooth testing by a clinician or self-administered home testing) on speech recognition. No significant differences in speech recognition were identified between these two formats for speech recognition in noise (both adaptive and fixed procedures) or quiet at 65 dB. At 55 dB, however, the results indicate that the home tests generate slight, but significantly better speech recognition scores than did the tests performed at the clinic. This effect was unexpected, particularly in light of the lack of significant differences for any of the other conditions. It is therefore unlikely that the observed difference was caused by differences in test format, test environment or stimuli presentation mode. Two factors that could potentially explain the significant difference are: (1) the list equivalence of the CVC words and (2) learning effects.
The CVC lists were originally created with equal intelligibility for normal hearing individuals (Bosman and Smoorenburg Citation1995). However, it is unclear whether the CVC lists are equally intelligible for CI users as well. Exploration of the data revealed that, within the same condition, measurements of speech recognition with different lists systematically yielded significantly different outcomes. In line with findings reported by Bierer et al. (Citation2016) for the CNC word lists, this observation may suggest that the lists are not equally intelligible for CI users.
Another factor that was explored was the occurrence of either procedural learning effects (e.g. effects associated with increasing familiarity with the task, listening environment, and the speaker’s voice) or content learning effects. Results from previous studies have been inconclusive regarding content and procedural learning effects in speech recognition tests. Wilson et al. (Citation2003) found procedural learning effects with the repeated use of sentences to assess speech recognition in quiet. In contrast, Yund and Woods (Citation2010) found limited procedural learning effects, but found that content learning significantly improved speech recognition in noise with the repeated use of sentences (Yund and Woods Citation2010). In the present study, participants performed CVC tests that are also used to assess speech recognition ability in the standard care setting. Because we included experienced CI users in our study, the participants were familiar with the task, the listening environment and the speaker’s voice. The likelihood of any procedural learning effects in this study is therefore quite small.
The observed significant improvement in speech recognition in quiet between session 1 and session 3 suggests a content learning effect. In all, 45 lists are available for the use with CVC tests, with only 15 of these lists containing unique words. The remaining lists contain the same words as the first 15 lists, but in a different order. In the present study, 24 lists were used, the first 15 of which were unique (see for an overview of the lists used for each condition). The lists of words that were used within the home + audio cable condition at 55 dB had already been used in a previous condition, albeit with the words in a different order. Unfortunately, it is not possible to test for actual differences in speech recognition in quiet, because the set of CVC lists used in this study was not counterbalanced across the conditions and participants. Nonetheless, further exploration of the data revealed that the repeated use of a combination of words within lists (e.g. lists 1–3 vs. lists 16–18) yielded better speech recognition in quiet, as compared to the use of lists with unique words. This finding persisted independent of test condition and stimulus presentation level. The repeated use of the same words in session 3 might also explain the significantly better speech recognition in quiet obtained in session 3 as compared to session 1.
In summary, the significant improvement in speech recognition in quiet, assessed in the 55 dB at home condition, could be explained by the fact that the lists were not equally intelligible and/or by content learning effects relating to the CVC lists. Based on these results, it would be advisable either to counterbalance lists across the participants or to randomise the order of presenting the lists when using the current set of Dutch CVC lists. This is an important recommendation for future research, as well as for formal audiological testing in the clinical setting. It might be worthwhile to either construct CVC lists that are both phonetically balanced and have equal intelligibility for CI users and normal hearing individuals. Another option could be to omit certain lists when testing CI users. Still, it should be noted that the significant differences in speech recognition in quiet observed between some conditions are small and approximately half the SEM for a single test.
The set of rules defined for speech recognition in quiet testing, allowed specific deviations in the spelling of the target response (e.g. graphemes that represent the same phoneme in Dutch), appeared to return a correct assessment of the majority of the typed responses. Upon further investigation, however, a few cases occurred in which the scoring of the typed response by the algorithm was not in accordance with the expected score that a clinician would have recorded if the response had been given verbally. A common substitution occurred with the stimulus “tien” (/tin/), to which participants responded “team” (/tim/). Because the grapheme “ea” was not defined as a valid alternative for the grapheme “ie”, the remote assessment tool assessed the response as containing only one correct phoneme, instead of two. Another response that was not scored in accordance with the expected scoring by a clinician was the response “gym” (/ɣιm/) to the stimulus “ging” (/ɣιŋ/). In this case as well, the response was assessed as only one correct phoneme instead of two.
As illustrated by the examples presented above, defining rules of exception at both word level (e.g. “team”) and grapheme/phoneme level (e.g. “i” and “y”) would increase the accuracy of the scoring procedure for the typed responses in the CVC task. Given the possibility of an unlimited set of responses, however, slight discrepancies in scoring between the algorithm and a clinician seem inevitable. Even though the scoring by clinicians is considered the gold standard, it is plausible that there are differences in scoring between clinicians as well (e.g. due to a certain extent of subjectivity in the auditory assessment of verbal responses).
We are currently conducting a clinical study in which the speech recognition tests are offered to the newly implanted CI users in a home environment, in order to monitor the progression in speech recognition closely during the first few months after cochlear implantation. The results of the speech recognition tests are visible to both the patients and clinicians. In the future, the self-administered home tests could be used to gather information prior to the regular clinical appointments of CI users, or to gather additional test results independent of scheduled appointments. The scores obtained could be forwarded to the cochlear implant centres for review, enabling appropriate action in the event of deterioration. This could lead to patients visiting the CI centres only when there is a clinical need. In the near future, digital wireless streaming of stimuli to the processor will become available. This could further increase the ease of self-administered home tests of speech recognition. In addition, self-administered home tests of speech recognition could be combined with remote programming in order to enhance self-care for CI users.
Conclusions
In conclusion, the results of this study indicate that there are no differences in speech recognition in quiet between measurements taken with a loudspeaker and those taken with an audio cable. In noise, the speech recognition scores obtained with the audio cable were significantly better than those obtained with the loudspeaker, but home self-assessment had no significant effect on speech recognition in noise. The results indicate that it is feasible for experienced CI users to perform speech recognition tests in the home environment, in both quiet and noise. Self-administered home testing for adult CI users could be of great use in daily clinical practice as a comparative assessment when a reference measurement in the clinic with the home test setup is available.
Acknowledgements
The authors would like to thank A. de Bolster, S. Lievens, O. u. R. Qazi, and F. Vanpoucke from Cochlear Technology Center, Mechelen, for their contributions.
Disclosure statement
No potential conflict of interest has been reported by the authors.
Notes
Additional information
Funding
Notes
1
2 The fixed SNR in all conditions was based on the SRT of the adaptive digits-in-noise tests in the clinic + loudspeaker condition. This results in higher percentages of correct scores for the audio cable conditions compared to the loudspeaker conditions. The SRT in the cable conditions were almost 1.5 dB better than those of the SRT in the clinic + loudspeaker condition. Given the 20%/dB slope of the psychometric curve for normal hearing subjects (Smits et al. Citation2013), a 15-20% higher score for the cable conditions could be expected. Although the data suggests a trend, it was not significant.
References
- Bierer, J. A., E. Spindler, S. M. Bierer, and R. Wright. 2016. “An Examination of Sources of Variability across the Consonant-Nucleus-Consonant Test in Cochlear Implant Listeners.” Trends in Hearing 20: 233121651664655–233121651664658. doi:10.1177/2331216516646556.
- Bosman, A. J., and G. F. Smoorenburg. 1995. “Intelligibility of Dutch CVC Syllables and Sentences for Listeners with Normal Hearing and with Three Types of Hearing Impairment.” Audiology : Official Organ of the International Society of Audiology 34 (5): 260–284. doi:10.3109/00206099509071918.
- Botros, A., R. Banna, and S. Maruthurkkara. 2013. “The Next Generation of Nucleus® Fitting: A Multiplatform Approach towards Universal Cochlear Implant Management.” International Journal of Audiology 52 (7): 485–494. doi:10.3109/14992027.2013.781277.
- De Graaff, F., E. Huysmans, O. U R. Qazi, F. J. Vanpoucke, P. Merkus, S. T. Goverts, and C. Smits. 2016. “The Development of Remote Speech Recognition Tests for Adult Cochlear Implant Users: The Effect of Presentation Mode of the Noise and a Reliable Method to Deliver Sound in Home Environments.” Audiology and Neurotology 21(Suppl. 1): 48–54. doi:10.1159/000448355.
- Francart, T., M. Moonen, and J. Wouters. 2009. “Automatic Testing of Speech Recognition.” International Journal of Audiology 48 (2): 80–90. doi:10.1080/14992020802400662.
- Goehring, J. L., M. L. Hughes, J. L. Baudhuin, D. L. Valente, R. W. McCreery, G. R. Diaz, T. Sanford, and R. Harpster. 2012. “The Effect of Technology and Testing Environment on Speech Perception Using Telehealth with Cochlear Implant Recipients.” Journal of Speech Language and Hearing Research 55 (5): 1373–1386. doi:10.1044/1092-4388(2012/11-0358).
- Hughes, M. L., J. L. Goehring, J. L. Baudhuin, G. R. Diaz, T. Sanford, R. Harpster, and D. L. Valente. 2012. “Use of Telehealth for Research and Clinical Measures in Cochlear Implant Recipients: A Validation Study.” Journal of Speech Language and Hearing Research 55 (4): 1112–1127. doi:10.1044/1092-4388(2011/11-0237).
- Kaandorp, M. W., C. Smits, P. Merkus, S. T. Goverts, and J. M. Festen. 2015. “Assessing Speech Recognition Abilities with Digits in Noise in Cochlear Implant and Hearing Aid Users.” International Journal of Audiology 54 (1): 48–57. doi:10.3109/14992027.2014.945623.
- McElveen, J. T., E. L. Blackburn, J. D. Green, Jr, P. W. McLear, D. J. Thimsen, and B. S. Wilson. 2010. “Remote Programming of Cochlear Implants: A Telecommunications Model.” Otology &Amp; Neurotology : Official Publication of the American Otological Society, American Neurotology Society [and] European Academy of Otology and Neurotology 31 (7): 1035–1040. doi:10.1097/MAO.0b013e3181d35d87.
- OPCI 2018. www.opciweb.nl. Accessed on February 2 2018.
- Plomp, R., and A. Mimpen. 1979. “Improving the Reliability of Testing the Speech Reception Threshold for Sentences.” International Journal of Audiology 18 (1): 43–52. doi:10.3109/00206097909072618.
- Ramos, A., C. Rodríguez, P. Martinez-Beneyto, D. Perez, A. Gault, J. C. Falcon, and P. Boyle. 2009. “Use of Telemedicine in the Remote Programming of Cochlear Implants.” Acta Otolaryngol 129 (5): 533–540. doi:10.1080/00016480802294369.
- Shapiro, W. H., T. Huang, T. Shaw, J. T. Roland, Jr, and A. K. Lalwani. 2008. “Remote Intraoperative Monitoring during Cochlear Implant Surgery Is Feasible and Efficient.” Otol Neurotol 29 (4): 495–498. doi:10.1097/MAO.0b013e3181692838.
- Sherbecoe, R. L., and G. A. Studebaker. 2004. “Supplementary Formulas and Tables for Calculating and Interconverting Speech Recognition Scores in Transformed Arcsine Units.” Int J Audiol 43 (8): 442–448. doi:10.1080/14992020400050056.
- Smits, C., S. T. Goverts, and J. M. Festen. 2013. “The Digits-in-Noise Test: assessing Auditory Speech Recognition Abilities in Noise.” The Journal of the Acoustical Society of America 133 (3): 1693–1706. doi:10.1121/1.4789933.
- Studebaker, G. A. 1985. “A rationalized arcsine transform.” Journal of Speech and Hearing Research 28 (3): 455–462. doi:10.1044/jshr.2803.455.
- Versfeld, N. J., L. Daalder, J. M. Festen, and T. Houtgast. 2000. “Method for the Selection of Sentence Materials for Efficient Measurement of the Speech Reception Threshold.” The Journal of the Acoustical Society of America 107 (3): 1671–1684. doi:10.1121/1.428451.
- Wesarg, T., A. Wasowski, H. Skarzynski, A. Ramos, J. C. Falcon Gonzalez, G. Kyriafinis, F. Junge, A. Novakovich, H. Mauch, and R. Laszig. 2010. “Remote Fitting in Nucleus Cochlear Implant Recipients.” Acta Otolaryngol 130 (12): 1379–1388. doi:10.3109/00016489.2010.492480.
- Wilson, R. H., T. S. Bell, and J. A. Koslowski. 2003. “Learning Effects Associated with Repeated Word-Recognition Measures Using Sentence Materials.” The Journal of Rehabilitation Research and Development 40 (4): 329. doi:10.1682/JRRD.2003.07.0329.
- Yund, E. W., and D. L. Woods. 2010. “Content and Procedural Learning in Repeated Sentence Tests of Speech Perception.” Ear and Hearing 31 (6): 769–778. doi:10.1097/AUD.0b013e3181e68e4a.