
Abstract
Objective: To evaluate a system – “the service” – designed to improve mobile telephone communication for people with hearing loss.
Design: Each participant registered online and took an online hearing test using their own mobile telephone held in the position of their choice. The test assessed the combined effects of the telephone, the hearing loss of the participant and the hearing aid of the participant (if worn). The results were stored as a “hearing profile” and used to set up frequency-dependent amplification and multichannel amplitude compression. The signal processing was performed in the telephone network and applied to all calls of the participant. Participants completed four questionnaires about their listening experiences using the telephone, one before using the service, two while using the service and one after using the service. Also, the ability to understand speech was measured using challenging sentences.
Study sample: Fifty-three participants with varying degrees of hearing loss.
Results: The great majority of participants indicated that call clarity was improved and that listening difficulty was reduced when using the service. Speech intelligibility scores were significantly improved when using the service.
Conclusions: The service appears to be effective in improving phone communication for people with hearing loss.
Introduction
Hearing impairment is associated with poorer quality of life, difficulties with functional activities, lower work productivity, reduced income and increased comorbidities, including dementia (Lin et al. Citation2011; Curhan and Curhan Citation2016; Livingston et al. Citation2017). The link to dementia is especially important, since the incidence of dementia is increasing and it poses a major health and economic problem. It has not yet been established whether there is a causal link between hearing loss and dementia, but it is plausible that hearing loss leads to social isolation and that this in turn contributes to dementia (Dawes et al. Citation2015). An important contributor to social isolation is difficulty in using the telephone, and especially the mobile telephone (hereafter simply called the “phone”). According to the Eurotrak survey conducted in 2015, 56% of hearing impaired people indicated that it was important for them to hear well when having a phone conversation, and 24% indicated that they were dissatisfied with the performance of their hearing aids when using the phone (Bisgaard and Ruf Citation2017). An unpublished survey conducted by Ideas for Ears and Goshawk Communications in the UK showed that of 999 respondents, 71% had mild to profound hearing loss and of these 76% said that they strongly agreed or agreed that they would like a solution that could improve their experiences of phone calls.
Difficulty in using the phone has several causes. First, the frequency range most commonly used with telephone signals, about 500–3500 Hz, was chosen based on experiments showing that this was just adequate to give good intelligibility of conversational speech with contextual cues for young people with normal hearing (Fletcher Citation1953). However, people with hearing loss have reduced auditory processing abilities, so this limited bandwidth may not be adequate for them (Moore Citation2007; Moore Citation2014). In addition, the ability to understand speech declines with increasing age even when the audiogram remains normal (Füllgrabe, Moore, and Stone Citation2015). Second, to reduce the bit rate in the digital transmission of phone signals, the signals are processed via perceptual coders, which degrade sound quality (Rix et al. Citation2001). Third, the miniature loudspeakers used in mobile phones may have a non-flat frequency response, which can also degrade sound quality (Moore and Tan Citation2003, Citation2004).
Other causes of difficulty depend on whether or not a hearing aid is used during a phone conversation. Many people with mild or moderate hearing loss do not use hearing aids (Curhan and Curhan Citation2016), and some people remove their hearing aid for phone use. If a person uses a phone without a hearing aid, then they will lack the benefits that are usually provided by hearing aids, including frequency-dependent amplification and multi-channel compression tailored to their hearing loss (Villchur Citation1973; Laurence, Moore, and Glasberg Citation1983). This may compromise the audibility of parts of the speech signal, even when the phone volume is set to a high value.
If a person does use a hearing aid for phone conversations, then the degree of difficulty can be affected by the type of aid that is used. Currently, the most common style of hearing aid is behind-the-ear with either a slim tube or a receiver in the canal, often with an open dome to reduce the occlusion effect (Dillon Citation2012; Moore and Popelka Citation2016; Bisgaard and Ruf Citation2017). The user of such a device can hold the phone earpiece close to the entrance to the ear canal in the conventional way. However, in that case, very little of the phone signal reaches the behind-the-ear microphones in the hearing aid, and the benefits of the hearing aid are lost. Alternatively, the user may hold the phone earpiece above the pinna, close to the hearing aid microphones. In that case, they will benefit from the signal processing in the hearing aid. However, this strategy has several disadvantages. First, the audibility of frequencies below about 800 Hz will be low, because open-fitting hearing aids do not generally provide significant output below 800 Hz (Aazh, Moore, and Prasher Citation2012; Kates Citation2008; Dillon Citation2012); usually, such frequencies are heard via leakage of sound past the open dome. The reduced audibility of frequencies below 800 Hz will lead to poor sound quality (Moore and Tan Citation2003) and to reduced speech intelligibility, given that frequencies between 500 and 800 Hz contribute significantly to intelligibility (ANSI Citation1997; Hornsby and Ricketts Citation2003, Citation2006). Second, aligning the phone earpiece with the hearing aid microphone is difficult, leading to variable coupling between the phone earpiece and the hearing aid microphones. Third, this position of the earpiece increases the likelihood of acoustic feedback. Finally, holding the earpiece above the pinna leads to reduced pick up of the voice of the user, resulting in a poorer signal for the conversant at the far end.
Goshawk Communications and Manx Telecom, Isle of Man, developed a service that is intended to improve mobile phone communication for people with hearing loss. The user registers online and takes an online hearing test with the test signals delivered via their own mobile telephone held in the position that is normally used. The test assesses the combined effects of the telephone network, the telephone, the hearing loss of the individual and the hearing aid of the individual (if worn for phone use). The results are stored as a “hearing profile” and are used to set up frequency-dependent amplification and multichannel amplitude compression based on that profile. The signal processing is performed in the telephone network and is applied to all calls employing the phone used for the hearing test. The rest of this article describes a trial evaluating this service. The day-to-day running of the trial and the collation of the data were conducted by an experimenter (author SS) who was independent of Goshawk Communication and of Manx Telecom.
Method
Participants
Participants were recruited from a list of people who had already indicated an interest in testing the service following a survey and through invitations issued to relevant Isle of Man organisations and groups. This included the Isle of Man Government, Nobles Hospital Audiology Clinic, the Manx Deaf Society (a registered charity) and Manx Telecom. Potential participants were sent information about the trial and were asked to complete a short questionnaire to check that they met the trial criteria. Participants had to:
Be aged 18 years or older.
Have mild, moderate or severe hearing loss.
Have no history of neurological illness (including stroke, epilepsy and dementia).
Be a mobile phone user.
Be a Manx Telecom pay monthly customer, or be happy to create a temporary pay-monthly account for the purposes of the trial (the Goshawk Service could only be accessed by people with a Manx Telecom pre-paid SIM card in their mobile phone; the cost of a temporary account, if required, was covered by the Manx Deaf Society).
Those meeting the criteria and wishing to get involved were sent more detailed information about the study and their formal consent to participate was obtained. A total of 83 people enquired about taking part in the trial. Sixteen dropped out before giving consent, and 13 dropped out before or during the trial period for reasons such as being on holiday, being unavailable or having poor health. Fifty-three participants completed the trial; 32 were female. Their ages ranged from 41 to 91 years, and 43 were in the age range 50–79 years. Participants self-reported their degree of hearing loss in their preferred “telephone ear”. The type of hearing loss (sensorineural, conductive or mixed) was not assessed. Seven participants reported severe hearing loss, 12 reported moderately severe loss, 20 reported moderate loss and 12 reported mild loss. Two participants were cochlear implant users. Thirty-nine participants used “conventional” hearing aids, two used bone-anchored hearing aids and 10 did not use hearing aids.
Ethical approval for the trial was obtained from The Isle of Man Research Ethics Committee (approval number IOMREC-001).
Registration and hearing test
Each participant was required to register using an online system. The registration form required information about age, gender and self-assessed degree of hearing loss. The participant then took an online hearing test with test signals delivered via their own phone held in its usual position (informal reports suggest that the great majority held the earpiece close to the entrance of the ear canal). The test measured the combined effects of their phone and their hearing loss at each of several frequencies (and their hearing aid, if used). Before starting the hearing test, the participant was presented with a speech signal and was asked to adjust the volume on their phone, when listening with their preferred ear, so that this signal was at a comfortable listening level. The participant was also asked to check that reception was good. If not, the participant was instructed to take the test later or in another place where reception was good.
The hearing test involved a series of trials. On each trial, three successive bursts of 1/3-octave-wide noise were presented. Noise bands were used rather than tones to avoid the effects of minor irregularities in the frequency response of the phones. Three bursts were used to help participants distinguish the test signals from any tinnitus that they might have. Also, three bursts provided a pattern that was readily distinguished from any noise occurring in the telephone system. Each burst had 20-ms ramps and a steady portion of 250 ms (total duration of each burst = 290 ms). The silent interval between bursts was 50 ms, giving a total duration of 970 ms per trial. The instructions that appeared on the screen were as follows:
Find somewhere quiet for the assessment and hold your mobile phone in the way that you normally would when making and receiving calls. If you are a hearing aid user, you can take your hearing aid our or you can leave it in – it’s up to you. During the assessment you will hear various different noises over your phone. They could sound like tones or whistles or beeps. When you hear one, however quietly, click the button that will be in the middle of the page.
The centre frequencies of the noises used were 500, 1000, 2000 and 3000 Hz, in that order. For each centre frequency, the starting level was chosen based on the age and gender of the participant and their self-reported hearing loss. The aim was to present the first stimulus for a given centre frequency at a level that was perceived as soft but clearly audible. The procedure for determining the detection threshold for each centre frequency was similar to the manual procedure recommended by the British Society of Audiology (Citation2011), but the procedure here was conducted fully under computer control. The time interval between stimulus presentations was randomly varied to prevent the participant responding “yes” at an anticipated time. The level was initially varied in 10-dB steps and then in 5-dB steps.
Typically, the test took less than 5 min, and repeats of the test took about 3 min. The results of the test are referred to as a “hearing profile”, although it should be remembered that the results actually reflect the combined effects of the participant’s hearing, the characteristics of the telephone network, the participant’s phone, the position of their phone and their hearing aid (if used), including partial occlusion of the ear canal by their hearing aid.
Signal processing
The hearing profile was used to set up participant-specific signal processing that was implemented in the phone network. This processing was applied to all calls involving that participant. The measured threshold at a given frequency, f, is denoted Abs(f). This is specified in dB, relative to an arbitrary reference, R(f). The arbitrary reference R(f) was chosen so that the absolute threshold in dB HL, AbsHL(f) was approximately equal to Abs(f).
For people with mild to moderate hearing loss, the root-mean-square (rms) level of the speech in a given frequency band was mapped to a level that was at least 20 dB above the measured threshold at that centre frequency. This ensured that the speech was fully audible in that band (since the effective dynamic range extends from about 10 dB above the rms level to 20 dB below it) (ANSI Citation1969; Moore et al. Citation2008). For frequencies, where there was little or no hearing loss, the rms level was mapped to a level that was 40–50 dB above the measured threshold, so as to achieve satisfactory loudness and sound quality. For frequencies, where the hearing loss was severe, the rms level was mapped to a level that was less than 20 dB above the measured threshold, in order to avoid excessive output levels and uncomfortable loudness. The following mapping rule was used, assuming that AbsHL(f) ≈ Abs(f): mapped level = Abs(f) + 45 – 0.56Abs(f) = 0.44Abs(f) + 45.
Essentially, this led to full restoration of audibility for a mild hearing loss (the rms level was mapped to a level slightly more than 20 dB above the absolute threshold), while for a severe hearing loss only partial restoration of audibility was achieved (the rms level was mapped to about 3 dB above the absolute threshold).
The mapping was achieved using an “equalisation filter” that was applied to the broadband signal, followed by four-channel compression. The signal processing was similar to that used previously in simulated multi-channel compression hearing aids (Moore, Peters, and Stone Citation1999; Moore, Füllgrabe, and Stone Citation2010; Moore, Füllgrabe, and Stone Citation2011; Stone et al. Citation1999). The equalisation filter allowed the frequency-dependent gain to be set for a speech-spectrum noise with a level of 65 dB SPL. This noise had the spectrum described by Moore et al. (Citation2008).
The compression ratio for a channel centred at frequency f was set to be CR(f) = 100/(100 – Abs(f)). This meant that very little compression was applied when Abs(f) was small and CR(f) increased progressively as Abs(f) increased. For example, when Abs(f) = 50 dB, CR(f) was equal to 2.
The signal processing was performed using the overlap-add method (Allen Citation1977). The sample rate was 8000 Hz and processing was performed using 64-sample frames with 50% overlap. A Hamming window was applied to each frame before calculation of a fast Fourier transform (FFT) to convert the time signal to the frequency domain. The spacing of the FFT bins was 125 Hz. The gain required to implement the equalisation filter described above was calculated for the frequency of each of the bins in the FFT. This gain array was applied to every frequency-domain frame.
The compression channels were centred on frequencies of 500, 1000, 2000 and 3000 Hz and had band edges at 63.5, 812.5, 1562.5, 2562.5 and 3937.5 Hz. The attack and release times of the compressor in each channel were 150 and 1500 ms, respectively, leading to relatively slow-acting compression. In addition, each channel incorporated a fast-acting limiter that was activated when the short-term level was 15 dB or more above a running estimate of the level in each channel. This limiter had little or no effect on momentary peaks in speech signals, since the short-term level of speech is very rarely more than 15 dB above the rms level (Moore et al. Citation2008). The main role of the limiter was to avoid loudness discomfort from extraneous sounds that can occur during phone reception.
The gain signal for each channel determined by application of the slow compressor and fast limiter was smoothed across frequency to avoid step changes in level at the boundaries between channels and applied to the frequency bins for a given frame. An inverse FFT was applied to convert the processed frame back to the time domain and the time signal was Hamming windowed again. The output time series was generated by overlapping the current frame with the preceding frame by 50%.
Fine tuning
After completing the hearing test, the participant was given the opportunity to listen to speech processed according to their hearing profile and to compare it to unprocessed speech. They could first adjust the overall level up or down until their preferred loudness was achieved. The instructions that appeared on the screen were:
Using the buttons here you can preview a sentence with and without your new personal profile applied. If you have taken the hearing assessment before, you can also listen to the sentence with the earlier profile. When you have heard the hearing options, select the one that sounds clearest and click Save. At this point the phone call will end and your chosen hearing option will be applied to your mobile phone service.
Once a satisfactory outcome had been obtained, there was no need for the participant to repeat the hearing test, unless they changed their phone, their hearing aid, the position in which the phone was held or the ear used. In practice, while a few participants reported initially trying different positions of their phone, they all chose one position and stuck to it after this initial exploration. No participants reported changing their hearing aid or their phone during the trial period. However, they were free to repeat the test at any time if they became dissatisfied with phone call quality after a period of experience or if they wanted to try to achieve an improved outcome or to try listening with the other ear.
After the hearing test had been completed, the participant was asked to indicate if they could hear the difference between the unprocessed and processed sounds and if they were satisfied with the processed sound. They were also asked to rate how easy they found the hearing test.
Trial structure and tests
Each participant completed four questionnaires, one before starting the trial, one after a few days of using the service, one after a few weeks of using the service and one after five days of not using the service. The time period of using the service was at least 28 d. The questionnaires were administered online using “Survey Monkey” (San Mateo, CA), which provides a convenient platform for creating surveys and collecting the data. The questionnaires differed depending on the time point. Questionnaire 1 asked the participant to focus on their use of the mobile phone in normal circumstances in the weeks and months before using the service. Questionnaire 2 asked the participant to focus on their use of the mobile phone over the last few days, while using the service. Questionnaire 3 asked the participant to focus on their use of the mobile phone since starting to use the service. Questionnaire 4 asked the participant to focus on experiences of hearing on their mobile phone since they stopped using the service and to compare this experience with that while using the service. The questions included in the questionnaires are given in the Results section of this article, together with the distribution of responses to those questions.
A sentence intelligibility test was administered at four-time points within two days of the time when each questionnaire was completed. Each test was initiated by an experimenter (SS) calling the participant on their mobile phone. The test was conducted using live voice. This was done rather than using recorded materials and conducting the test online because it was necessary to ensure that the participant was in a quiet location and that they were not experiencing problems with poor reception due to a weak signal. If either of these was the case, the experimenter arranged to call at a slightly later time. The experimenter first asked the participant to adjust the volume of their phone to a comfortable level. Then the participant was asked to repeat back each sentence after it was spoken by the experimenter. The experimenter tried to maintain a consistent speaking level during each test. Responses were recorded and scored by the experimenter.
The sentence materials were the phonetically balanced “Harvard Sentences”, also called the IEEE sentences (Rothauser et al. Citation1969). Four blocks of 10 sentences were used at each time point, each with five keywords per sentence, giving a maximum score of 50 words correct per block. The order of the four blocks was varied across participants so that each block was used a roughly equal number of times at each time point. These sentences were chosen since they are harder to understand than the BKB or ASL sentences, and, for hearing impaired people listening on the phone, they often lead to scores below the maximum even when presented in quiet. Complete speech intelligibility data were obtained for 50 participants. There were some missing data for three participants due to problems in obtaining good reception, non-availability or, in one case, a problem with their hearing aid.
Results
Ease of and satisfaction with the hearing test
The majority of participants completed the registration, hearing test and fine tuning without difficulty. One participant without internet access was provided with assistance from a support officer with a laptop. One participant required personal support to deal with issues that appeared related to her hearing aids and her psychological adjustment to sudden and severe hearing loss. Three participants required help in taking the hearing test and achieving a satisfactory outcome, primarily because of problems in using a computer. Three participants required support in using a computer but did not have difficulty in getting a satisfactory outcome from the hearing test. One participant struggled due to mobility/dexterity issues and one found the recorded instructions too fast to follow. However, with help in these cases, all participants completed the hearing test. Sixty percent of participants took the hearing test in only one session, but 15% took it two sessions, 13% took it three and 11% took it in four or more sessions.
Eighty-nine percent of participants reported that they could hear the difference between the processed and unprocessed sound, 83% reported being satisfied with the processed sound, and 94% indicated that the hearing test was reasonably or very straightforward.
Questionnaire outcomes
Questionnaires 1–3
The pattern of the results was very similar for questionnaires 2 and 3, which both addressed experiences while using the service. Therefore, in what follows, the mean results for questionnaires 2 and 3, designated “Processed” are compared with those for questionnaire 1, which addressed experiences prior to using the service, designated “Unprocessed”. There were very minor changes of wording across the questionnaires, but the meaning was essentially as specified below. In what follows, each of the main questions is specified, and the distributions of responses are illustrated. Captions at the top of each figure indicate the essence of the question that was posed.
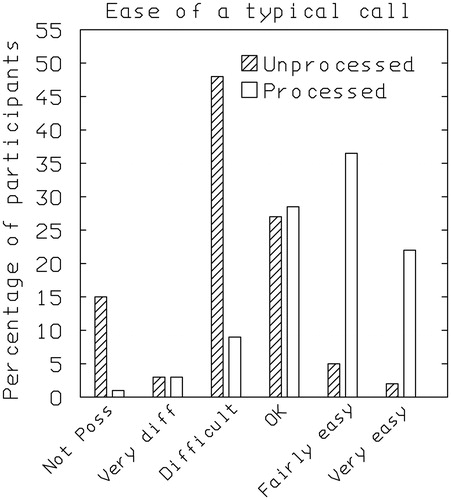
How easy do you find it to hear and understand people on the phone on a typical call?
(Not possible, very difficult, fairly difficult, OK, reasonably easy and very easy).
The responses are shown in . Without processing, 66% of participants gave a response in the range not possible to fairly difficult, whereas with processing only 12% of participants gave responses in this range. The distribution of responses was significantly different for the unprocessed and processed conditions (χ2 (5) = 39.7, p < 0.001).
Figure 1. Distribution of responses to the question “How easy do you find it to hear and understand people on the phone on a typical call?” without the service (Unprocessed, questionnaire 1) and with the service (Processed, mean for questionnaires 2 and 3). Response alternatives were: not possible, very difficult, fairly difficult, OK, reasonably easy and very easy).
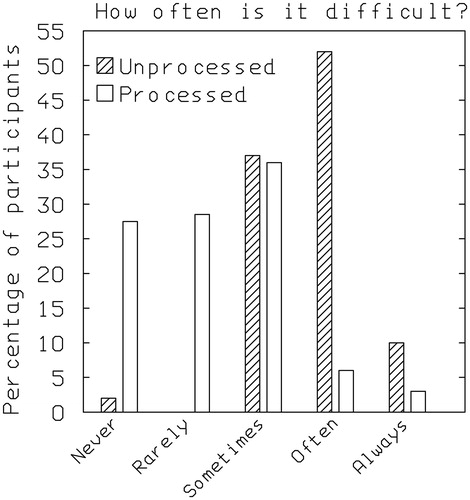
Do you ever find it difficult to hear and understand what is being said on a mobile phone call, for reasons that are not about a poor or interrupted mobile phone signal?
(never, rarely, sometimes, often and always).
The responses are shown in . Without processing, 62% of participants gave a response of often or always, whereas with processing only 8% of participants gave responses in these categories. The distribution of responses was significantly different for the unprocessed and processed conditions (χ2 (4) = 46.8, p < 0.001).
Figure 2. Distribution of responses to the question “Do you ever find it difficult to hear and understand what is being said on a mobile phone call, for reasons that are not about a poor or interrupted mobile phone signal?” without the service (Unprocessed, questionnaire 1) and with the service (Processed, mean for questionnaires 2 and 3). Response alternatives were: never, rarely, sometimes, often and always.
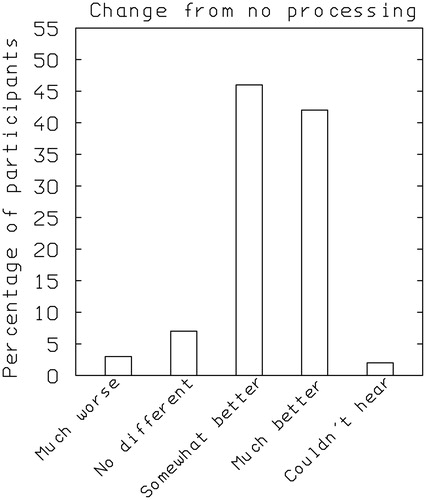
Since using the enhanced service, has speech sounded clearer and easier to hear?
(Questionnaires 2 and 3 only, response alternatives: much worse, no different, somewhat better, much better and could not hear previously).
The responses are shown in . With processing, 88% of participants responded somewhat better or much better, whereas only 3% responded much worse.
Figure 3. Distribution of responses to the question “Since using the enhanced service, has speech sounded clearer and easier to hear?”. Response alternatives were much worse, no different, somewhat better, much better and could not hear previously.
Questionnaire 4
This questionnaire asked participants to judge their experiences since they stopped using the service relative to those while they were using the service. In what follows, each of the main questions is specified, and the distributions of responses are illustrated.
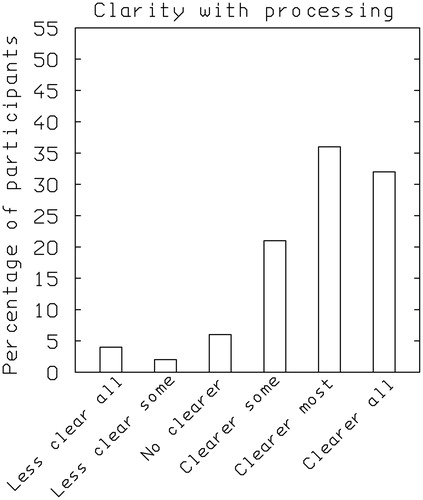
When you were using the service, what was speech clarity like generally? Please base your answer on calls where there was no signal/sound interference.
(Less clear on all calls, less clear on some calls, no clearer, clearer on some calls, clearer on most calls and clearer on all calls).
The responses are shown in . Eighty-nine percent of participants rated calls with the service as clearer on some to all calls, whereas only 6% rated calls with the service as less clear on some or all.
Figure 4. Distribution of responses to the question “When you were using the service, what was speech clarity like generally?”. Response alternatives were: less clear on all calls, less clear on some calls, no clearer, clearer on some calls, clearer on most calls and clearer on all calls.
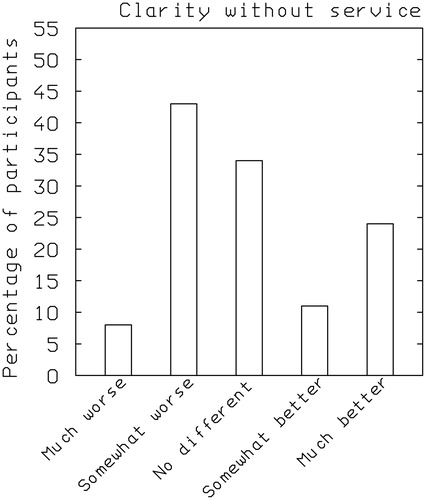
Since the service stopped, has speech sounded clearer and easier to hear and understand?
(much worse, somewhat worse, no different, somewhat better and much better).
The responses are shown in . Fifty-one percent of participants responded much or somewhat worse, whereas 35% responded somewhat better or much better. The responses in this case were less positive with regard to the service than those for question (1). This might reflect some degree of confusion, since for the present question “better” meant that the service was perceived as worse.
Figure 5. Distribution of responses to the question “Since the service stopped, has speech sounded clearer and easier to hear and understand?”. Response alternatives were: much worse, somewhat worse, no different, somewhat better and much better.
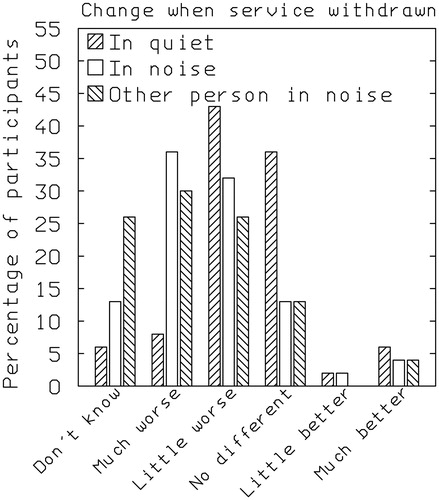
How has speech clarity on calls changed since you stopped using the service? This was asked for three situations: calls from quiet locations with no background noise; when you are in a noisy place; when the person you are speaking to is in a noisy place.
(do not know/not applicable, much worse, a little worse, no different, a little better and much better).
The responses are shown in . Disregarding responses of do not know/not applicable, 54, 78 and 76% of participants responded much or a little worse in quiet, in noise, and when the other person was in a noisy place, respectively. Hence, the benefits of the service appear to be greater when one or the other of the people making a call is in a noisy situation than when both are in a quiet situation.
Figure 6. Distribution of responses to the question “How has speech clarity on calls changed since you stopped using the service?”, for three situations: calls from quiet locations with no background noise; when you are in a noisy place; when the person you are speaking to is in a noisy place. Response alternatives were: do not know/not applicable, much worse, a little worse, no different, a little better and much better.
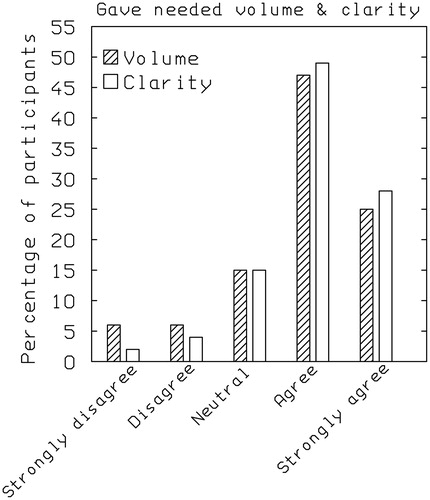
Regarding your experiences of using the service, how much do you agree with the following?: It gave me the volume I needed, It gave me the clarity I needed.
(for each: strongly disagree, disagree, neutral, agree and strongly agree).
The results are shown in . Seventy-two percent of participants agreed or strongly agreed that the service gave them the volume they needed and 77% agreed or strongly agreed that the service gave them the clarity they needed.
Figure 7. Distribution of responses to the question “Regarding your experiences of using the service, how much do you agree with the following?: It gave me the volume I needed, It gave me the clarity I needed.” Response alternatives for each were: strongly disagree, disagree, neutral, agree and strongly agree.
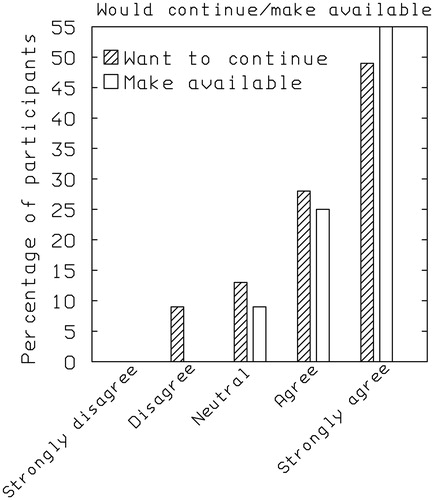
Thinking about the service, how much do you agree with the following?: I would like to continue to use the service; I believe the service should be made available to everyone who has a hearing need.
(for each: strongly disagree, disagree, neutral, agree, and strongly agree).
The results are shown in . Seventy-seven percent of participants agreed or strongly agreed that they would like to continue the service and 91% agreed or strongly agreed that the service should be made available to everyone who has a hearing need.
Figure 8. Distribution of responses to the question “Thinking about the service, how much do you agree with the following?: I would like to continue to use the service; I believe the service should be made available to everyone who has a hearing need”. Response alternatives for each were: strongly disagree, disagree, neutral, agree and strongly agree.
How likely is it that you would recommend the service to a friend or colleague?
(responses on a scale from 0 to 10 with 0 labelled “Not at all likely” and 10 labelled “Extremely likely”).
Eighty-one percent of participants gave ratings of 8, 9 or 10, with 53% giving the highest possible rating.
Regarding your experiences of using the service, how much do you agree with the following?
(for each statement: strongly disagree, disagree, neutral, agree and strongly agree).
For the statement “It had a positive impact on my life”, 58% of participants agreed or strongly agreed and 4% disagreed or strongly disagreed. For the statement “It made longer calls less taxing or tiring”, 53% of participants agreed or strongly agreed and 8% disagreed or strongly disagreed. For the statement “I felt more confident in using the phone”, 68% of participants agreed or strongly agreed and 8% disagreed or strongly disagreed. For the statement “I felt more relaxed when using the phone”, 66% of participants agreed or strongly agreed and 8% disagreed or strongly disagreed.
Overall, the responses to the questionnaires indicated that the great majority of the participants felt that the service led to improved clarity of calls, and that they wished to continue using the service and would recommend it to others.
Speech intelligibility scores
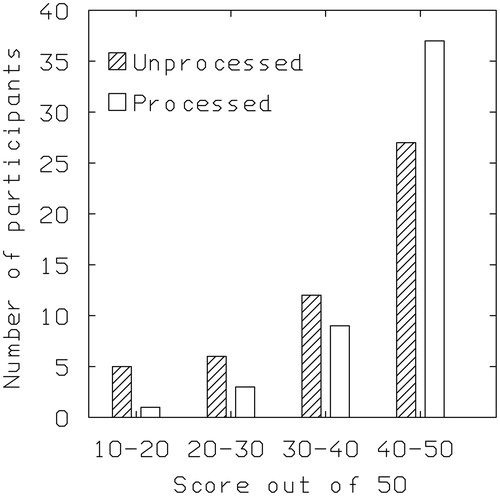
The pattern of results was very similar for the first and fourth speech intelligibility tests, which were both obtained using unprocessed signals, and for the second and third tests, which were both obtained using signals processed via the service. Therefore the scores for each participant were averaged across the first and fourth tests and across the second and third tests. The results are shown as histograms in . The figure shows the number of participants with scores falling in the following ranges: 10–20, 20.5–30, 30.5–49 and 40.5–50. With the processing (open bars), fewer participants had scores below 40 and more participants had scores of 40.5 and above, relative to no processing (shaded bars). Of the 50 participants who completed all four speech intelligibility tests, three showed slightly poorer performance with the processing (by up to 6% points) and 47 showed better performance (by up to 27% points). The three poorer scores could be the result of random errors of measurement. The mean improvement in score with the processing was 10.6% points. The improvement was limited by ceiling effects, since 13 participants achieved scores of 49/50 or more with the processing, while only three did without the processing. A Wilcoxon matched-pairs signed-ranks test showed that the effect of condition (processed versus unprocessed) was highly significant (T = 6, p < 0.001).
Figure 9. Distribution of scores for the speech intelligibility tests averaged for tests 1 and 4 (without the service, Unprocessed) and for tests 2 and 3 (with the service, Processed). The scores were grouped into the following ranges: 10–20, 20.5–30, 30.5–49 and 40.5–50.
Discussion
Overall, the results of the trial were very positive. Most participants found the online hearing test to be easy to take, although a few required assistance, mostly because of problems using a computer. Eighty-nine percent of participants reported that they could hear the difference between the processed and unprocessed sound at the end of the hearing test(s), 83% reported being satisfied with the processed sound and 94% indicated that the hearing test was reasonably or very straightforward. The results for questionnaires 1–4 indicated that the great majority of the participants felt that the service led to improved clarity of calls, and that they wished to continue using the service and would recommend it to others. A majority of participants felt that the service made phone calls less tiring and that they felt less tired and more relaxed when using the phone.
The results of the speech intelligibility tests showed rather consistent but modest improvements with the service. The small magnitude of the improvements is not surprising given that the ability to understand speech is affected only slightly by changes in frequency-gain response and by the application of multi-channel compression unless the changes lead to marked alterations in audibility (van Buuren, Festen, and Plomp Citation1995; van Buuren, Festen, and Houtgast Citation1999). Indeed much of the benefit for speech intelligibility and clarity found in this study probably resulted from the improved audibility provided by the frequency-response shaping and multi-channel compression that is incorporated in the service.
The reported benefits of the service were greater when one or the other of the people making a call was in a noisy situation than when both were in a quiet situation. This is important, since calls are often made or received in noisy situations, such as when on a busy street, on public transport or in a restaurant. The greater benefit in noisy situations may reflect the fact that hearing loss is often greater at high frequencies than at low frequencies, and hearing impaired people are often especially susceptible to the “upward spread of masking” from lower frequencies towards higher frequencies (Tyler et al. Citation1984; Glasberg and Moore Citation1986). The frequency-response shaping provided by the service usually resulted in more gain being applied at high frequencies than at low frequencies, helping to overcome the upward spread of masking. In addition, the benefit when the participant was receiving a call in a noisy situation can be partly attributed to the fact that the multi-channel compression processing would have helped to bring the lower-level portions of the speech above the level of the background noise, hence increasing their audibility.
Not all participants found that the service led to improved clarity. There may be several reasons for this. First, two participants were users of cochlear implants, and these usually provide adequate audibility; the problem is one of discrimination rather than audibility. Of these two participants, one reported that the service led to improved clarity on most or all calls, while the other reported no improvement. The latter also reported difficulty in achieving a satisfactory hearing profile during the hearing test. The dissatisfied cochlear-implant user wrote that “I can HEAR ok but the problem is CLARITY” (their use of capitals).
Second, for some participants with severe hearing loss it may not have been possible to set the output of their phone high enough to restore audibility if they used the phone without a hearing aid, and if they used a hearing aid with a closed fitting and held the phone close to the hearing aid microphone, the signal-processing in their hearing aid would have been applied, rendering the service largely unnecessary. Of the six participants who reported difficulty in achieving a satisfactory hearing profile during the hearing test, four had self-rated severe hearing loss, one had a moderate loss and one was a cochlear-implant user. Of the seven participants in total with severe hearing loss, two reported that the service led to improved clarity, three were neutral and two reported that the service did not improve clarity, an outcome that is less favourable than for the participants as a whole. One participant with severe loss wrote that “I find the new sound to be more ‘tinny’ than the previous sound, and therefore prefer the original sound”. This report may reflect a lack of acclimatisation to the processed sound or it may reflect the presence of strong loudness recruitment at high frequencies for that participant.
Third, audibility may have been adequate even without the service for some participants with mild hearing loss. However, of the 12 participants with self-reported mild hearing loss, 10 were broadly positive about the service and two were neutral, so it appears that the service was of benefit for the majority of participants with mild hearing loss. Overall, it seems likely that the service is of most benefit for people with mild to moderately severe hearing loss who either listen unaided when using the phone or who use a behind-the-ear aid with an open fitting. However, some people with severe hearing loss may also benefit.
Some modern hearing aids offer the possibility of wirelessly streaming a phone signal either directly to the hearing aid or via an intermediary device (Mecklenburger and Groth Citation2016). Such streaming might be considered as an alternative to the service, since in principle it can lead to lead to good audibility and quality for a person with a closed-fitting hearing aid. Closed fittings are typically used for people with severe-to-profound hearing loss, to reduce acoustic feedback (Dillon Citation2012). However, as noted in the Introduction, if a behind-the-ear hearing aid with an open fitting is used, the output of the hearing aid is usually inadequate to restore audibility for frequencies below about 800 Hz, and this can lead to poor sound quality and reduced speech intelligibility. Thus, for a person with an open-fitting behind-the-ear aid, the service should lead to higher sound quality and intelligibility than obtained by streaming of the phone signal to the hearing aid.
Some limitations of the trial should be acknowledged. First, neither the participants nor the experimenter was blinded to the condition that was being used at a given time (service versus no service). For the questionnaires, the non-blinding of the experimenter was not an issue, since all questionnaires were administered online, and scoring was automatic. However, the non-blinding of the participants may have led them to favour the service, since any form of new technology tends to be viewed favourably (Bentler et al. Citation2003; Dawes, Powell, and Munro Citation2011). The trial was conducted in a non-blinded manner because it would have been technically difficult and expensive to enable/disable the service in a way that was blind to both the participant and the experimenter. For the speech tests, the non-blinding of the experimenter could have led to biases in scoring the results. Also, the speech intelligibility tests were conducted using live voice, which can lead to some uncontrolled variability. However, the speech intelligibility tests were administered and scored by a person (author SS) who was independent of Goshawk Communications and of Manx Telecom, which should have reduced any biases. A future trial with a double-blind design and with recorded speech stimuli would be desirable. Finally, the quality of calls received by the participants might have varied from time-to-time depending on the distance of the phone from the nearest transmission tower and on the load on the network. This would have introduced some uncontrolled variability, but it should not have systematically affected the outcomes.
Conclusions
Most participants found the online hearing test to be easy to take, although a few required assistance, mostly because of problems using a computer. Eighty-nine percent of participants reported that they could hear the difference between the processed and unprocessed sound at the end of the hearing test(s), 83% reported being satisfied with the processed sound and 94% indicated that the hearing test was reasonably or very straightforward. The results for questionnaires 1–4 indicated that the great majority of the participants felt that the service led to improved clarity of calls, and that they wished to continue using the service and would recommend it to others. The reported benefits of the service were greater when one or the other of the people making a call was in a noisy situation than when both were in a quiet situation. The results of the speech intelligibility tests showed consistent and highly significant but modest improvements with the service. The service is likely to be of most benefit for people with mild to moderately severe hearing loss.
Disclosure statement
Authors BCJM and MAS are shareholders in and consultants for Goshawk Communications. ZS is a consultant for Goshawk Communications and SS was paid by Goshawk Communications to oversee the study.
Additional information
Funding
References
- Aazh, H., B. C. J. Moore, and D. Prasher. 2012. “The Accuracy of Matching Target Insertion Gains with Open-Fit Hearing Aids.” American Journal of Audiology 21 (2): 175–180. doi:10.1044/1059-0889(2012/11-0008).
- Allen, J. B. 1977. “Short Term Spectral Analysis, Synthesis and Modification by Discrete Fourier Transform.” IEEE Transactions on Acoustics, Speech, and Signal Processing 25 (3): 235–238. doi:10.1109/TASSP.1977.1162950.
- ANSI. 1969. ANSI S3.5. Methods for the Calculation of the Articulation Index. New York, NY: American National Standards Institute.
- ANSI. 1997. ANSI S3.5-1997. Methods for the Calculation of the Speech Intelligibility Index. New York, NY: American National Standards Institute.
- Bentler, R. A., D. P. Niebuhr, T. A. Johnson, and G. A. Flamme. 2003. “Impact of Digital Labeling on Outcome Measures.” Ear and Hearing 24 (3): 215–224. doi:10.1097/01.AUD.0000069228.46916.92.
- Bisgaard, N., and S. Ruf. 2017. “Findings from Eurotrak Surveys from 2009 to 2015: Hearing Loss Prevalence, Hearing Aid Adoption, and Benefits of Hearing Aid Use.” American Journal of Audiology 26 (3S): 451–461. doi:10.1044/2017_AJA-16-0135.
- British Society of Audiology. 2011. Pure-Tone Air-Conduction and Bone-Conduction Threshold Audiometry with and without Masking: Recommended Procedure. Reading, UK: British Society of Audiology.
- Curhan, G., and S. Curhan. 2016. “Epidemiology of Hearing Impairment.” In Hearing Aids, edited by G. R. Popelka, B. C. J. Moore, R. R. Fay and A. N. Popper, 21–58. New York, NY: Springer.
- Dawes, P., R. Emsley, K. J. Cruickshanks, D. R. Moore, H. Fortnum, M. Edmondson-Jones, A. McCormack., et al. 2015. “Hearing Loss and Cognition: The Role of Hearing Aids, Social Isolation and Depression.” PLoS One 10 (3): e0119616. doi:10.1371/journal.pone.0119616.
- Dawes, P., S. Powell, and K. J. Munro. 2011. “The Placebo Effect and the Influence of Participant Expectation on Hearing Aid Trials.” Ear and Hearing 32 (6): 767–774. doi:10.1097/AUD.0b013e3182251a0e.
- Dillon, H. 2012. Hearing Aids. 2nd ed. Turramurra, Australia: Boomerang Press.
- Fletcher, H. 1953. Speech and Hearing in Communication. New York, NY: Van Nostrand.
- Füllgrabe, C., B. C. J. Moore, and M. A. Stone. 2015. “Age-Group Differences in Speech Identification Despite Matched Audiometrically Normal Hearing: Contributions from Auditory Temporal Processing and Cognition.” Frontiers in Aging Neuroscience 6: 347. doi:10.3389/fnagi.2014.00347.
- Glasberg, B. R., and B. C. J. Moore. 1986. “Auditory Filter Shapes in Subjects with Unilateral and Bilateral Cochlear Impairments.” Journal of the Acoustical Society of America 79 (4): 1020–1033. doi:10.1121/1.393374.
- Hornsby, B. W., and T. A. Ricketts. 2003. “The Effects of Hearing Loss on the Contribution of High- and Low-Frequency Speech Information to Speech Understanding.” Journal of the Acoustical Society of America 113 (3): 1706–1717. doi:10.1121/1.1553458.
- Hornsby, B. W., and T. A. Ricketts. 2006. “The Effects of Hearing Loss on the Contribution of High- and Low-Frequency Speech Information to Speech Understanding. II. Sloping Hearing Loss.” Journal of the Acoustical Society of America 119 (3): 1752–1763. doi:10.1121/1.2161432.
- Kates, J. M. 2008. Digital Hearing Aids. San Diego, CA: Plural.
- Laurence, R. F., B. C. J. Moore, and B. R. Glasberg. 1983. “A Comparison of behind-the-Ear High-Fidelity Linear Aids and Two-Channel Compression Hearing Aids in the Laboratory and in Everyday Life.” British Journal of Audiology 17 (1): 31–48. doi:10.3109/03005368309081480.
- Lin, F. R., L. Ferrucci, E. J. Metter, Y. An, A. B. Zonderman, and S. M. Resnick. 2011. “Hearing Loss and Cognition in the Baltimore Longitudinal Study of Aging.” Neuropsychology 25 (6): 763–770. doi:10.1037/a0024238.
- Livingston, G., A. Sommerlad, V. Orgeta, S. G. Costafreda, J. Huntley, D. Ames, C. Ballard., et al. 2017. “Dementia Prevention, Intervention, and Care.” Lancet (London, England) 390 (10113): 2673–2734. doi:10.1016/S0140-6736(17)31363-6.
- Mecklenburger, J., and T. Groth. 2016. “Wireless Technologies and Hearing Aid Connectivity.” In: Hearing Aids, edited by G. R. Popelka, B. C. J. Moore, R. R. Fay and A. N. Popper, 131–150. New York, NY: Springer.
- Moore, B. C. J. 2007. Cochlear Hearing Loss: Physiological, Psychological and Technical Issues. 2nd ed. Chichester, UK: Wiley.
- Moore, B. C. J. 2014. Auditory Processing of Temporal Fine Structure: Effects of Age and Hearing Loss. Singapore: World Scientific.
- Moore, B. C. J., C. Füllgrabe, and M. A. Stone. 2010. “Effect of Spatial Separation, Extended Bandwidth, and Compression Speed on Intelligibility in a Competing-Speech Task.” Journal of the Acoustical Society of America 128 (1): 360–371. doi:10.1121/1.3436533.
- Moore, B. C. J., C. Füllgrabe, and M. A. Stone. 2011. “Determination of Preferred Parameters for Multi-Channel Compression Using Individually Fitted Simulated Hearing Aids and Paired Comparisons.” Ear and Hearing 32 (5): 556–568. doi:10.1097/AUD.0b013e31820b5f4c.
- Moore, B. C. J., R. W. Peters, and M. A. Stone. 1999. “Benefits of Linear Amplification and Multi-Channel Compression for Speech Comprehension in Backgrounds with Spectral and Temporal Dips.” Journal of the Acoustical Society of America 105 (1): 400–411. doi:10.1121/1.424571.
- Moore, B. C. J., and G. R. Popelka. 2016. “Introduction to Hearing Aids.” In: Hearing Aids, edited by G. R. Popelka, B. C. J. Moore, R. R. Fay and A. N. Popper, 1–19. New York, NY: Springer.
- Moore, B. C. J., M. A. Stone, C. Füllgrabe, B. R. Glasberg, and S. Puria. 2008. “Spectro-Temporal Characteristics of Speech at High Frequencies, and the Potential for Restoration of Audibility to People with Mild-to-Moderate Hearing Loss.” Ear and Hearing 29 (6): 907–922. doi:10.1097/AUD.0b013e31818246f6.
- Moore, B. C. J., and C. T. Tan. 2003. “Perceived Naturalness of Spectrally Distorted Speech and Music.” Journal of the Acoustical Society of America 114 (1): 408–419. doi:10.1121/1.1577552.
- Moore, B. C. J., and C. T. Tan. 2004. “Development and Validation of a Method for Predicting the Perceived Naturalness of Sounds Subjected to Spectral Distortion.” Journal of the Audio Engineering Society 52: 900–914.
- Rix, A. W., J. G. Beerends, M. P. Hollier, and A. P. Hekstra. 2001. “Perceptual Evaluation of Speech Quality (PESQ) - A New Method for Speech Quality Assessment of Telephone Networks and Codecs.” Acoustics, Speech, and Signal Processing, 2: 749–752. Piscataway, NJ: IEEE.
- Rothauser, E. H., W. D. Chapman, N. Guttman, K. S. Nordby, H. R. Silbiger, G. E. Urbanek, and M. Weinstock. 1969. “IEEE Recommended Practice for Speech Quality Measurements.” IEEE Transactions on Audio and Electroacoustics 17: 225–246. doi:10.1109/TAU.1969.1162058.
- Stone, M. A., B. C. J. Moore, J. I. Alcántara, and B. R. Glasberg. 1999. “Comparison of Different Forms of Compression Using Wearable Digital Hearing Aids.” Journal of the Acoustical Society of America 106 (6): 3603–3619. doi:10.1121/1.428213.
- Tyler, R. S., J. W. Hall, B. R. Glasberg, B. C. J. Moore, and R. D. Patterson. 1984. “Auditory Filter Asymmetry in the Hearing Impaired.” Journal of the Acoustical Society of America 76 (5): 1363–1368. doi:10.1121/1.391452.
- van Buuren, R. A., J. Festen, and T. Houtgast. 1999. “Compression and Expansion of the Temporal Envelope: Evaluation of Speech Intelligibility and Sound Quality.” Journal of the Acoustical Society of America 105 (5): 2903–2913. doi:10.1121/1.426943.
- van Buuren, R. A., J. M. Festen, and R. Plomp. 1995. “Evaluation of a Wide Range of Amplitude-Frequency Responses for the Hearing Impaired.” Journal of Speech, Language, and Hearing Research 38 (1): 211–221. doi:10.1044/jshr.3801.211.
- Villchur, E. 1973. “Signal Processing to Improve Speech Intelligibility in Perceptive Deafness.” Journal of the Acoustical Society of America 53 (6): 1646–1657. doi:10.1121/1.1913514.