
Abstract
Objective: To examine the auditory system of Brazilian gasoline station workers using an extensive audiological test battery.
Design: This was a cross-sectional study. The audiological evaluation included a questionnaire, pure-tone audiometry, acoustic immittance tests, transient-evoked otoacoustic emissions (TEOAEs), distortion product otoacoustic emissions (DPOAEs), auditory brainstem response (ABR) and P300 auditory-evoked potentials.
Study sample: A total of 77 Brazilian gasoline station workers were evaluated, and their results were compared with those of 36 participants who were not exposed to chemicals or noise at work. The gasoline station employees worked in 18 different gas stations, and the noise area measurements from all gas stations revealed time-weighted averages below 85 dBA.
Results: Of the 77 gasoline station workers evaluated, 67.5% had audiometric results within the normal range, but 59.7% reported difficulties in communication in noisy places. Gasoline station workers showed significantly poorer results than non-exposed control participants in one or more conditions of each of the audiological tests used, except P300.
Conclusions: The results suggest that the gasoline station workers have both peripheral and central auditory dysfunctions that could be partly explained by their exposure to gasoline.
Introduction
In Brazil, there are no self-service gasoline stations. Therefore, many people work in gas stations, refuelling tanks for customers for 8 h per day and performing other tasks (Mitri et al. Citation2015). During their workday, these professionals are exposed to a variety of occupational risks generated by chemical, physical, biological and physiological hazards (Cezar-Vaz et al. Citation2012).
The exposure to high levels of gasoline vapours while fuelling cars is one of the most significant risks for these workers (Mitri et al. Citation2015). Gasoline vapours include benzene, toluene, ethylbenzene and xylene, which can be absorbed through inhalation, ingestion and dermal contact (Tunsaringkarn et al. Citation2012). Gasoline components such as ethylbenzene, toluene and xylene can damage the peripheral and/or the central auditory system (for a review see Johnson and Morata Citation2010). Central auditory disorders have been observed in workers who have normal hearing thresholds following exposure to toluene (Abbate et al. Citation1993); solvents from a paint factory (Fuente and McPherson Citation2007a); mixture of organic solvents (xylene, toluene, methyl ethyl ketone) (Fuente and McPherson Citation2007b) and gasoline vapours (Quevedo et al. Citation2012; Quevedo, Tochetto, and Siqueira Citation2012).
The effects of toluene on the peripheral and central auditory systems have been observed in several animal studies and among workers exposed simultaneously to noise (Abbate et al. Citation1993; Morata et al. Citation1993, Morata, Engel et al. Citation1997; Vrca et al. Citation1996). Cochlear effects have been demonstrated in studies in which animals were exposed to ethylbenzene alone (Gagnaire and Langlais Citation2005). A higher prevalence of hearing loss, as well as impairment of neuro-behavioural function were found in a study of petrochemical workers exposed to ethylbenzene and noise (Zhang et al. Citation2013). Peripheral (Fuente, McPherson, and Hood Citation2012) and central auditory system impairments (Fuente, McPherson, and Cardemil Citation2013) were found in xylene-exposed workers.
The auditory effects of exposure to jet fuels, which have many of the same components as gasoline used by cars, have been investigated in experimental studies with animals (Guthrie et al. Citation2015; Citation2016) and workers (Odkvist et al. Citation1987; Kaufman et al. Citation2005; Hughes and Hunting Citation2013). Studies were also conducted with workers from petroleum refineries (Morata, Engel et al. Citation1997; Loukzadeh et al. Citation2014). Evidence of auditory disorders following exposure to fuels was reported by all of these studies, with the exception of the studies by Hughes and Hunting (Citation2013) and Loukzadeh et al. (Citation2014), who used only pure-tone audiometry in their evaluation.
A few studies have specifically examined the gasoline station workers’ auditory system. Tochetto, Quevedo, and Siqueira (Citation2013) compared audiological findings of 24 gas station workers with 24 non-exposed persons. Exposed workers had significantly poorer pure-tone audiometry thresholds at the frequencies of 0.5, 2 and 3 kHz, as well as at the extended high frequency audiometry range of 9 and 10 kHz. In addition, gasoline station workers had more cases of abnormal acoustic reflexes (i.e. absent or elevated). Zucki et al. (Citation2017) compared the auditory profile of 21 gasoline station workers with 23 subjects without exposure to noise or chemical agents. No statistical differences were found between auditory thresholds nor between acoustic reflex thresholds (ARTs) between the two groups. However, a greater amount of abnormal acoustic reflexes was observed in the group of gasoline attendant workers than in the control group (CG), suggesting the presence of retrocochlear dysfunction. Quevedo et al. (Citation2012) observed abnormal results on auditory brainstem responses (ABR) in persons with normal hearing thresholds, suggesting that exposure to fuels can alter central auditory function. No abnormal results were found on transient-evoked otoacoustic emissions (TEOAEs) or on the suppression of TEOAEs in gasoline station workers (Quevedo, Tochetto, and Siqueira Citation2012).
The present study used a more extensive audiological test battery than previous studies to examine the auditory system of gasoline station workers and identify possible targets of the chemical exposure in the auditory system.
Materials and methods
Study population
The study group was composed of 77 Brazilian gasoline station workers (68 male, 9 female), 19 to 67 years of age (mean = 37.5 ± SD 12.6). They were divided in 2 groups: Study Group 1 (SG1) was composed of 53 workers with all auditory thresholds within the normal range (hearing thresholds ≤ 25 dB HL for 0.25-8 kHz). Study Group 2 (SG2) was composed of 24 workers with hearing loss no greater than 60 dBHL at frequencies from 2 to 4 kHz. The number of subjects who performed each auditory test varied, mainly due to the difficulties of the subjects to attend two days of evaluation. Thus, different numbers of subjects were considered for each auditory test analyzes (see for the characteristics of the study population, and for observe the exact number of subjects that underwent each auditory test).
Table 1. Characterisation of the study population.
Participants worked in 18 different gas stations in the city of Joinville in southern Brazil (population > 500,000). They were recruited by the Workers’ Health Reference Centre where the data collection took place. All of them worked as gas attendants, with some of them also completing other tasks, such as changing oil, washing cars or working as cashiers. The duration of employment ranged from 3 months to 33 years (mean = 9.27 ± SD 8.71), and the noise area measurements from all gas stations revealed time-weighted averages (TWA) below 85 dBA (Brasil Citation1978).
Of the 18 studied gas stations, only one was located along an interstate highway; 17 were located on busy city streets. Eligibility criteria for the study group included working as a gas attendant, hearing thresholds (bone and air conduction) no greater than 60 dBHL at frequencies from 2 to 4 kHz, type A results for tympanometry, absence of pathologic alterations of the external ear canal, and no history of neurological or metabolic disease.
The comparison group included 36 persons who reported not being exposed to chemicals or noise at work. As it happened with study group, the number of subjects that underwent each auditory test varied (see for clarification). Eligibility criteria for the CG included no hearing complaints, normal hearing (hearing thresholds ≤25 dB HL for 0.25–8 kHz), type A results for tympanometry, absence of pathologic alterations of the external ear canal and no history of neurological or metabolic disease. All CG participants were selected from volunteers recruited through public ads in the Joinville City Hall and on the campus of the Federal University of Santa Catarina, as well as by word of mouth.
This study was approved by the Ethics Committee of the Federal University of Santa Catarina – Brazil, and all participants gave voluntary informed written consent before participation.
Procedures
A questionnaire was administered face-to-face and included questions related to clinical and occupational history. All audiological testing was conducted by one audiologist in the Workers’ Health Reference Centre in Joinville. The evaluation included a questionnaire, visual inspection of the ear canal, pure-tone audiometry (PTA), immittance audiometry, transient-evoked (TEOAEs) and distortion product otoacoustic emissions (DPOAEs) testing, ABR and P300 auditory-evoked potentials. The hearing evaluation was performed in two sessions. During the first session, the workers answered a questionnaire and underwent visual inspection of ear canal, PTA, acoustic immittance, TEOAEs and DPOAEs. During the second session, the workers underwent ABR and P300 auditory-evoked potentials. Each appointment lasted approximately 2 h.
PTA was conducted in a soundproof booth using an Interacoustics AD 28 audiometer with amplivox audiocups headphones. Air conduction pure-tone thresholds for the octave frequencies between 0.25 and 8 kHz were obtained bilaterally for all subjects evaluated. Bone conduction pure-tone thresholds for octave frequencies between 0.5 and 4 kHz were obtained when air conduction pure-tone thresholds were abnormal and/or if the tympanometric curve was abnormal. Tympanometry and acoustic reflexes testing were performed bilaterally with an Interacoustics AZ 26 middle ear analyser. The ARTs were recorded for both ipsilateral and contralateral conditions for the octave frequencies from 0.5 to 4 kHz.
TEOAEs were recorded in both ears using Interacoustics Eclipse equipment. The evoking stimuli were nonlinear clicks presented at 80 peSPL, and the response time window was set at 3.0–18 ms. The signal-to-noise ratio (SNR) was used to quantify the magnitude of TEOAEs at the following frequency ranges: 0.5–1.5, 1.5–2.5, 2.5–3.5, 3.5–4.5, and 4.5–5.5 kHz. DPOAEs were recorded in both ears using Interacoustics Eclipse equipment. For DPOAE recordings, the “DP gram-extended” protocol was used with L1 and L2 equal to 65 dB and 55 dB SPL, respectively, and the primary ratio of f2/f1 equal to 1.22. The maximum test time was set to 2 min. The frequencies tested included 1–8 kHz, and both the distortion product amplitude (DP level) and the signal-to-noise ratio (SNR) were analysed to quantify the magnitude of DPOAEs.
The equipment used for the ABR recordings was a two-channel Interacoustics Eclipse unit EP25. The ABR recordings were done by independent monaural stimulation. Four disposable surface electrodes were used with the reference electrodes placed on the right (A2) and left (A1) ear lobes, the active on the high forehead (Fz) and the ground on the low forehead to the right of the midline (according to the international 10–20 system). The acoustic stimuli were presented through insert earphones (ear tone ABR). The ABR recordings were done using the following protocol: click stimulus at 80 dB nHL, rarefaction polarity, rate of 27.7 clicks per second, 10 ms recording window, two trials, each trial averaging 2,000 responses for each ear, and high-pass and low-pass filters set at 100 and 3 kHz, respectively. During the recordings, the subjects were lying on a stretcher in a supine position and were instructed to relax and remain as quiet as possible.
The equipment used for the P300 auditory-evoked potential recordings was a two-channel Interacoustics Eclipse EP25 unit. The electrodes used for recording P300 were the same as positioned for recording ABR, except that the active electrode was moved to the Cz position, instead of Fz, as it allows for a better P300 recording. The recordings were completed using the following protocol: a 1-kHz tone burst as frequent stimulus, a 2-kHz tone burst as the rare stimulus, intensity of 80 dB nHL, 20% probability of the rare stimulus, stimulation rate of 1 per second and filters of 1.67 to 25 kHz. The P300 was identified as the positive wave of greatest amplitude following the N1–P2–N2 complex, occurring in the recording of the rare stimulus, between 240 and 700 ms. The auditory stimuli were presented through insert earphones (ear tone ABR). During the P300 recording, participants were instructed to listen to a series of identical stimuli interspersed randomly with a rare stimulus and to keep a mental count of how many rare stimuli they heard.
Statistical analysis
A linear model was used to analyse the audiometric threshold data. A separate model was used for each combination of ear and frequency. The model included classification variables for the exposure group (control, exposed), gender, previous exposure to noise at work (no, yes) and previous exposure to gasoline (yes, no). Age, in years, was included as a continuous variable. F and t statistics were calculated for each variable.
Mixed linear models were used to analyse the acoustic reflex, otoacoustic emission (OAE), ABR and P300 data. A mixed effects model has both random and fixed effects, while a standard linear regression model has only fixed effects. In the mixed linear model, data are permitted to exhibit correlated and non-constant variability. It provides the flexibility of modelling not only for the data but for their variances and covariances as well. A mixed effects model can include an average intercept and slope as fixed effects, and also include a random intercept that models the possibility of differences between the study participants. A separate model was used for each combination of measurement variable and frequency, frequency band or response component (e.g. waves I or III, etc.). The model included classification variables for exposure group (control, exposed normal hearing, exposed with hearing loss), gender, previous exposure to noise (no, yes), previous exposure to gasoline (no, yes) and ear (right, left). Age (in years), was included as a continuous variable. The exposure group × ear interaction was included to estimate the effect of exposure for each ear. F and t statistics were calculated for each effect. An unstructured covariance matrix was used to model the covariance between ears.
The total duration of exposure to gasoline was calculated by adding the current and previous duration of exposure to gasoline in years for each exposed subject. Control subjects were assigned a value of 0. The linear models for the audiometry data included classification variables for gender and previous exposure to noise (no, yes). Total duration of exposure to gasoline and age were included as continuous variables. The mixed linear models for the acoustic reflex, OAE, ABR and P300 data included classification variables for gender, previous exposure to noise (no, yes), and ear (right, left). The total duration of age and exposure to gasoline were included as continuous variables. F and t statistics were calculated for each effect. An unstructured covariance matrix was used to model the covariance between ears.
All calculations were done with SAS® (Release 9.3, SAS Institute, Inc., Cary, NC, USA). The MIXED procedure was used to estimate the models. The method of estimation was residual maximum likelihood.
Results
Auditory symptoms and pure-tone audiometry
The most common auditory symptom reported by the gasoline station workers (n = 77) was difficulty communicating in noisy places (59.7%). Other reported auditory symptoms they have experienced include difficulties in communication (20.8%), vertigo (11.7%), tinnitus (11.7%), hearing loss (6.5%), ear fullness (5.2%), sensitivity to loud sounds (1.3%), and earache (1.3%).
Of the 77 gasoline station workers who participated in this study, 67.5% had audiometric results within the normal range (hearing thresholds better than 25 dBHL from 250 to 8 kHz); 11.7% had bilateral sensorineural hearing loss no greater than 60 dBHL in more than one test frequency. The other 20.8% had hearing loss only at frequencies of 6 and/or 8 kHz.
shows the pure-tone thresholds obtained for all studied groups, by ear. Gasoline station workers had poorer mean audiometric thresholds than non-exposed CG, even those whose thresholds were within the normal range. The hearing thresholds were significantly different between them and the CG at 4 kHz (p = 0.01) for the right ear, and at 0.25 kHz (p = 0.04), and 6 (p = 0.04) for the left ear. Despite 20.8% of the gasoline attendants’ having thresholds greater than 25 dB HL at 6 and 8 kHz, the thresholds greater than 25 dB HL at 4 Hz were significantly worse than in the other groups.
Figure 1. Mean right and left ear pure-tone thresholds and standard errors for all study groups. ✩★◆ denote significant differences at the p < 0.05 level between non-exposed control subjects and gasoline station workers with normal hearing, between non-exposed control subjects and gasoline station workers with hearing loss, and between gasoline station workers with normal hearing (SG1) and with hearing loss (SG2), respectively.
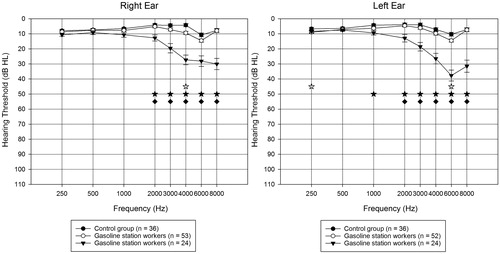
Gender was associated with hearing thresholds in the frequency of 0.5 kHz in the right ear (p = 0.0536) and 4 kHz (p = 0.0377); males had poorer hearing thresholds than females. Age was associated with thresholds at 3 kHz (p = 0.0423) and 4 kHz (p = 0.0381) in the right ear and 3 kHz (p = 0.004), 4 kHz (p = 0.0002), 6 kHz (0.0220) and 8 kHz (p = 0.0575) (in the left ear). Being in the group exposed to gasoline with a hearing loss and duration of exposure was a significant interaction associated with thresholds in 4 kHz (p = 0.0027) and 6 kHz (p = 0.0095) in the right ear, and 2 kHz (p = 0.0243) in the left ear (and in 4 kHz, the p value approached significance at 0.0696). No statistically significant differences in hearing thresholds were found for the variables of previous exposure to noise, previous exposure to gasoline or ear.
Acoustic reflex thresholds (ART)
shows that gasoline station workers had some poorer ARTs than non-exposed subjects. However, most of the differences were found between the CG and the gasoline station workers with hearing loss. The only statistical difference found between the CG and gasoline station workers with normal hearing was in the frequency of 2 kHz (right ear), where the gasoline station workers had significantly poorer (p < 0.05) ARTs than the non-exposed participants. Gasoline station workers with hearing loss had significantly poorer (p < 0.05) ARTs than non-exposed control participants at the following frequencies: 1 kHz (right ear), 2 kHz (right ear) and 4 kHz (right and left ear), in the ipsilateral condition, and 1 kHz (right and left ear), 2 kHz (right and left ear) and 4 kHz (right and left ear) in the contralateral condition. Gasoline station participants with hearing loss also had significantly poorer (p < 0.05) ARTs than the gasoline station workers with no hearing loss in the ipsilateral condition for the frequency of 4 kHz (left ear).
Table 2. Number of absent reflexes for the right and left ears and mean ipsilateral (ipsi) and contralateral (contra) acoustic reflex thresholds (ART) in dB HL with, standard deviation (SD) in parentheses organised by exposure group and test frequency (0.5, 1, 2 and 4 kHz).
Table 3. Mean ABR and P300 results with standard deviation (SD), for the right and left ears for the study groups (Study Group 1 (SG1) involves gasoline station workers with normal hearing. Study Group 2 (SG2) includes gasoline station workers with hearing loss; Control group (CG) includes individuals not exposed to noise or chemicals).
Absence of reflexes was more common among gasoline station workers than among non-exposed participants, and more common in the contralateral mode than in the ipsilateral one. The absences were more common even for gasoline station workers with no hearing loss. The frequency of 4 kHz showed the highest number of absent reflexes, both contralateral and ipsilateral. No statistically significant differences in ART were found for the variables of gender, previous exposure to gasoline, previous exposure to noise and ear.
Otoacoustic emissions (OAEs)
illustrates that the TEOAEs signal-to-noise ratio (SNR, in dB) for gasoline station workers (even those with no hearing loss) were lower than for non-exposed control participants for most of the frequency bands. The TEOAEs SNR for gasoline station workers with normal hearing was significantly lower than those for the non-exposed in the frequency bands of 3.5–4.5 kHz in both ears (p = 0.04 in the right ear and p = 0.003 in the left ear) and 4.5–5.5 kHz in the right ear (p = 0.002). For those workers with hearing loss, the TEOAEs SNR was significantly lower than those for the CG in the frequency bands of 3.5–4.5 kHz (p = 0.0004 in the right ear and p < 0.0001 in the left ear) and 4.5–5.5 kHz (p = 0.002 in the right ear and p = 0.01 in the left ear) in both ears. The gasoline station workers with hearing loss also had TEOAEs SNR that were significantly lower than those with no hearing loss in the frequency bands of 2.5–3.5 kHz in the right ear (p = 0.04) and 3.5–4.5 in both ears (p = 0.02 in the right ear and p = 0.003 in the left ear).
Figure 2. Means and standard errors for TEOAE signal to noise ratio (SNR) in dB for the right and left ear for both groups of participants. ✩★◆ Denote significant differences at the p < 0.05 level between non-exposed control subjects and gasoline station workers with normal hearing, between non-exposed control subjects and gasoline station workers with hearing loss, and between gasoline station workers with normal hearing and workers with hearing loss, respectively. (Open circle symbols denote gasoline station workers with normal hearing. Filled arrowhead symbols denote gasoline station workers with hearing loss).
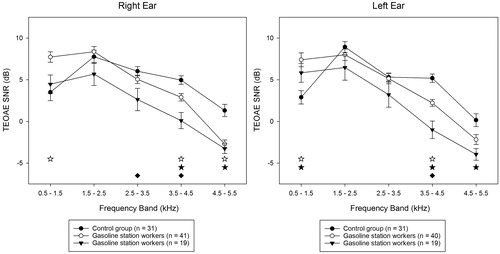
A significant negative slope was observed between TEOAE SNR and the duration of exposure to gasoline in the 3.5–4.5 kHz frequency band (p = 0.0309) in the left ear for gasoline attendants with hearing loss. That is, as the time of exposure to gasoline increased, the TEOAE SNR decreased in that frequency band.
shows the means and standard errors for DPOAE amplitude and SNRs as a function of frequency. Gasoline station workers had lower DPOAE amplitudes than non-exposed control participants at most frequencies. Gasoline station workers with no hearing loss (SG1) showed significantly lower (p < 0.05) DPOAE amplitudes than non-exposed control participants in both ears and at all frequencies tested except 8 kHz in the right ear (p = 0.0002 in 1 kHz, p = 0.001 in 2 kHz, p = 0.003 in 3 kHz, p = 0.002 in 4 kHz and p = 0.01 in 6 kHz); and 6 kHz in the left ear (p < 0.0001 in 1 kHz, p = 0.005 in 2 kHz, p = 0.002 in 3 kHz, p = 0.003 in 4 kHz, p = 0.03 in 8 kHz). Gasoline station workers with hearing loss (SG2) showed significantly lower (p < 0.05) DPOAE amplitudes than non-exposed control participants in both ears and at all frequencies tested except 8 kHz in the right ear (p = 0.0003 in 1 kHz, p < 0.0001 in 2, 3 and 4 kHz, p = 0.004 in 6 kHz in the right ear and p = 0.001 in 1 kHz, p = 0.004 in 2 kHz, p = 0.0003 in 3 kHz, p < 0.0001 in 4 kHz, p = 0.02 in 6 kHz, p = 0.04 in 8 kHz in the left ear). The gasoline station workers with hearing loss also had DPOAE amplitudes that were significantly lower than those with no hearing loss in the frequencies of 2, 3 and 4 kHz in the right ear (p = 0.03 in 2 kHz, p = 0.01 in 3 kHz, p = 0.03 in 4 kHz), and at 4 kHz in the left ear (p = 0.002).
Figure 3. Means (± standard errors) for DPOAE amplitude (dB SPL) are shown with the connected symbols and mean DPOAE SNRs are shown numerically for each frequency for the right and left ears for all participant groups. ✩★◆ Denote significant differences at the p < 0.05 level between non-exposed control subjects and gasoline station workers with normal hearing, between non-exposed control subjects and gasoline station workers with hearing loss, and between gasoline station workers with normal hearing and those with hearing loss, respectively. (Open circle symbols denote gasoline station workers with normal hearing. Filled arrowhead symbols denote gasoline station workers with hearing loss).
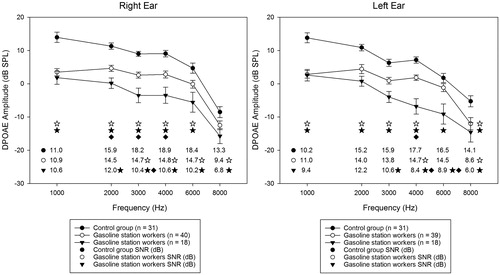
Both groups of gasoline station also had lower DPOAE SNRs than non-exposed controls at most frequencies. Gasoline station workers with no hearing loss showed significantly lower (p < 0.05) DPOAE SNRs than non-exposed control subjects at the following frequencies: 3, 4, 6 and 8 kHz in the right ear (p = 0.02 in 3 kHz, p = 0.02 in 4 kHz, p = 0.01 in 6 kHz and p = 0.01 in 8 kHz), and 4 and 8 kHz in the left ear (p = 0.03 in 4 kHz and p = 0.003 in 8 kHz). Gasoline station workers with hearing loss showed significantly lower (p < 0.05) DPOAE SNRs than non-exposed control subjects at the following frequencies: 2, 3, 4, 6 and 8 kHz in the right ear (p = 0.02 in 2 kHz, p = 0.0003 in 3 kHz, p = 0.001 in 4 kHz, p = 0.001 in 6 kHz and p = 0.003 in 8 kHz), and 3, 4, 6 and 8 kHz in the left ear (p = 0.01 in 3 kHz, p < 0.0001 in 4 kHz, p = 0.003 in 6 kHz and p = 0.001 in 8 kHz). The gasoline station workers with hearing loss had also DPOAE SNRs significantly lower than those with no hearing loss at 3 kHz in the right ear (p = 0.04), and 4, and 6 kHz in the left ear (p = 0.001 in 4 kHz, p = 0.04 in 6 kHz).
Other than the differences in DPOAE amplitudes described above, mainly by the participant’s group, no other significant differences we observed between the other examined variables (with the exception of age) at 3 kHz (p = 0.0148), 4 kHz (P = 0.0122) and 6 kHz (p = 0.0002). Significant differences were observed between age at 3 (p = 0.0056), 4 (p = 0.0136) and 6 kHz (p = 0.0009) in both ears. A significant difference was found between genders for DPOAE SNR at 4 kHz (p = 0.00375), with males having lower SNRs than females. No statistically significant differences were found in DPOAE for SNRs for previous exposure to gasoline and previous exposure to noise.
Auditory-evoked potentials
shows the mean ABR and P300 results and standard deviations (SD) by ear. Gasoline station workers with normal hearing thresholds (SG1) showed significantly longer (p < 0.05) ABR wave V absolute latencies in both ears than non-exposed CG participants. Gasoline station workers with hearing loss (SG2) showed significantly longer (p < 0.05) ABR waves I, III and V absolute latencies in both ears than non-exposed control participants, and also than gasoline station workers with no hearing loss (SG1). Moreover, gasoline station workers with hearing loss (SG2) had significantly greater (p < 0.05) III–V, and I–V interpeak latencies (IPLs) in both ears than non-exposed control participants and gasoline station workers with no hearing loss (SG1). The only statistically significant difference in the amplitude of ABR waves was for waves III and V in the left ear. Gasoline station workers with hearing loss (SG2) showed significantly smaller wave III amplitudes in the left ear than non-exposed subjects and gasoline station workers with no hearing loss (SG1). Furthermore, they showed significantly smaller wave V amplitudes in the left ear than gasoline station workers with no hearing loss (SG1).
Significant differences were observed between ears for ABR wave I absolute latency (p = 0.0002, right ear with longer latencies than left ear) as well as for ABR I-III IPL (p = 0.0000), and III-V IPL (p = 0.0459) (left ear with longer I–III IPL than the right ear, and right ear with longer III–V IPL than left ear). Significant differences were observed also for gender (males with longer latencies than females) for wave I (p = 0.0003), wave III (p = 0.0011) and for wave V (p = 0.0001), as well as for ABR I-III (p = 0.0125), III–V (p = 0.0072) and I–V (p = 0.0001) (males with longer interpeak latencies than females). A significant positive slope was observed for the group with hearing loss between the time of exposure to gasoline and the absolute latencies of ABR waves III (p = 0.0061 in the right ear and p = 0.0007 in the left ear) and V (p = 0.035 in the right ear and p = 0.032 in the left ear). A similar slope was observed for the group with hearing loss between the time of exposure to gasoline for ABR I–III IPL for the right (p = 0.0008) and left ears (p = 0.0004), and I–V IPL in the right ear (p = 0.004) and the left ear (p = 0.01). As the time of exposure to gasoline increased, the ABR absolute latencies and IPL also increased for the cited waves. A significant slope was observed for the duration of employment for the group of gasoline station attendants with normal hearing for the amplitude of wave V in the left ear (p = 0.01).
No significant differences between groups were found for P300 latency and amplitude in both ears. P300 results indicated that males had significantly greater amplitude than females (p = 0.0415), and that age was also significantly associated with amplitudes (p = 0.0435). P300 latency was only associated with age (p = 0.0517).
Discussion
Auditory symptoms and pure-tone audiometry
While 67.5% of the gasoline station workers had audiometric thresholds within normal range, 59.7% reported having difficulties communicating in noisy places, and 20.8% reported having difficulties communicating in general. These percentages were much higher than the 12% of people with normal audiometric thresholds who reported communication difficulties in a population-based study (Tremblay et al. Citation2015). This discrepancy could be partly explained by the type of hearing disorders we detected. Poor hearing in daily life activities was reported earlier among solvent-exposed workers, complaints that were consistent with the peripheral and central auditory system disorders we detected (Fuente, McPherson, and Hormazabal Citation2013).
Despite not being exposed to excessive levels of noise (i.e. 85 dBA TWA), both groups of gasoline station workers showed poorer audiometric thresholds than non-exposed control participants, even those who had all auditory thresholds within the normal range. Similar results from gasoline station workers were reported earlier (Tochetto, Quevedo, and Siqueira Citation2013), as well as in previous studies with solvent exposed workers (Fuente and McPherson Citation2007a, Citation2007b; Fuente, McPherson, and Hickson Citation2011; Fuente, McPherson, and Cardemil Citation2013; Fuente, McPherson, and Hormazabal Citation2013; Fuente, McPherson, and Hickson Citation2013). On the other hand, Zucki et al. (Citation2017) found no significant differences in the audiometric thresholds of gasoline station workers and unexposed controls. The significantly poorer hearing thresholds in participants exposed to gasoline vapours could indicate an early peripheral auditory dysfunction. However, if this had been the only hearing test performed, and their auditory complaints were not taken into consideration, many cases of auditory disorders would not have been detected. These results suggest that while audiometric thresholds could be useful as part of a surveillance programme for this population, they may not be sufficient to detect and fully identify the effects of gasoline on the auditory system.
Regarding audiometric configuration, pure-tone thresholds were worse at high frequencies than at low and middle frequencies for gasoline station workers, which suggest that gasoline can affect the basal part of the cochlea. A previous study reported that gasoline station workers had significantly poorer hearing thresholds than non-exposed subjects at frequencies of 9 and 10 kHz (Tochetto, Quevedo, and Siqueira Citation2013), which also suggests a dysfunction in the basal portion of the cochlea.
Acoustic reflex thresholds (ART)
Gasoline station workers had significantly worse ARTs and a greater number of absent reflexes than non-exposed participants (particularly those with hearing loss), which has been reported previously. Elevated or absent ARTs with ipsilateral and/or contralateral stimulation despite normal pure tone thresholds at the corresponding frequencies have also been found in persons with a history of exposure to gasoline (Tochetto, Quevedo, and Siqueira Citation2013) or industrial solvents (Gopal, Citation2008). No significant differences in absence or elevation of ART were noted among petroleum refinery workers, but the workers from an aromatic plant showed a significantly higher percentage of cases of pathological acoustic reflex decay than the other studied groups (Morata, Engel et al. Citation1997). In another study (Zucki et al. Citation2017), no statistical difference was found between gasoline station workers and a CG for ART, however, they reported a greater occurrence of abnormal acoustic reflexes.
Considering that all gasoline station workers in the present study had normal hearing or sensorineural hearing loss no greater than 60 dBHL, and that the mean hearing thresholds for both studied groups were normal, the ART results suggest a retrocochlear dysfunction. ARTs are expected to be within normal limits when there is cochlear hearing loss ≤ 60 dBHL (Feeney and Schairer Citation2015). Moreover, ARTs are typically elevated or absent with the stimulus to the affected ear in cases of retrocochlear pathologies or eighth cranial nerve lesions (Hunter and Shahnaz Citation2014). Zucki et al. (Citation2017) also concluded that the gasoline station workers evaluated for them could have retrocochlear dysfunction based on the acoustic reflex abnormalities they found.
As gasoline station workers with no hearing loss presented acoustic reflexes that were significantly poorer than non-exposed subjects only in one frequency in one ear, it seems that this audiological procedure was not sensitive to early detection of effects of solvents on the auditory system.
Finally, in the present study, there was a greater number of absent reflexes in the contralateral than in the ipsilateral mode. A similar result was obtained in a study of aircraft maintenance workers exposed simultaneously to noise and solvents (Prasher et al. Citation2005). This finding may be related to the greater complexity of the contralateral acoustic reflex pathway and the location of the damage (as explained by Venet et al. Citation2011).
Otoacoustic emissions (OAEs)
Gasoline station workers with no hearing loss showed significantly poorer TEOAE SNR than non-exposed control participants at the 3.5–4.5 kHz frequency bands in both ears and 4.5–5.5 kHz in the right ear. This is in contrast to a previous study of gasoline station workers who also had normal hearing thresholds. The previous study did not find significant differences for the mean TEOAE SNR between the study and CGs (Quevedo, Tochetto, and Siqueira Citation2012). Gasoline station workers with hearing loss showed even more significantly poorer TEOAE SNR than non-exposed subjects, and they had TEOAE SNR significantly poorer than gasoline station workers with no hearing loss. Solvent-exposed subjects have significantly lower TEOAE SNR than non-exposed control subjects (Fuente, McPherson, and Hickson Citation2013). In addition, abnormal results in TEOAE were found in studies with workers exposed to solvents (Gopal Citation2008; Sułkowski et al. Citation2002; Fuente, McPherson, and Hood Citation2012).
Both groups of gasoline station workers also showed significantly lower DPOAE amplitudes and DPOAE SNRs than non-exposed control participants in both ears in most evaluated frequencies. No studies were found with DPOAE in gasoline station workers. No significant differences for DPOAEs were found between xylene exposed participants and a CG (Fuente, McPherson, and Cardemil Citation2013). However, abnormal results in DPOAE were found in other studies with workers exposed to solvents (Sułkowski et al. Citation2002; Johnson et al. Citation2006; Gopal Citation2008). One study of workers exposed to a mixture of organic solvents found that the amplitudes of OAEs closely corresponded with cumulative dose of exposure (i.e. as the dose increased, the DPOAE and TEOAE amplitudes decreased (Sułkowski et al. Citation2002).
Considering that OAEs reflect outer hair cells activity and that the functional integrity of outer hair cells is essential for generating OAEs (Dhar and Hall Citation2012), our results suggest that the gasoline station workers have a cochlear dysfunction involving the outer hair cells. This type of dysfunction was also reported in studies with workers exposed to solvents (Johnson et al. Citation2006; Fuente, McPherson, and Hickson Citation2013). Significant differences between gasoline station workers and non-exposed subjects were more common for DPOAEs than for TEOAEs. This finding is consistent with previous observations that OAEs testing (particularly DPOAEs) is a highly sensitivity index of even subtle early changes in outer hair cell function secondary to the toxic effects of chemical substances (Dhar and Hall Citation2012).
Auditory-evoked potentials
Gasoline station workers with no hearing loss had significantly longer wave V absolute latencies in both ears than non-exposed control participants in ABR. On the other hand, gasoline station workers with hearing loss showed longer latencies for all ABR waves, as well as significantly greater III–V, and I–V interpeak latency intervals in both ears than non-exposed control participants and gasoline station workers with no hearing loss. The effects of gasoline on the auditory system seem to have started at the wave V generator site in the auditory system, progressively spreading to other regions of the auditory nerve and brainstem as hearing loss appeared. However, a previous study of gasoline station workers with no hearing loss reported abnormal results in the absolute latency of waves I, III and V, as well as for all IPL when compared with clinical norms (Quevedo et al. Citation2012). Abnormal results reported in previous studies including ABR assessments of workers exposed to solvents included the following: delayed waves I, III or V and increased I–III, III–V or I–V IPL (Kumar and Tandon Citation1997), delayed wave V latency (Odkvist et al. Citation1987), increased I–V IPL (Prasher et al. Citation2005), and poor waveform morphology and repeatability (Gopal Citation2008).
Significantly longer ABR latencies for workers exposed to solvents have been observed (Abbate et al. Citation1993; Vrca et al. Citation1996; Fuente, McPherson, and Cardemil Citation2013; Juárez-Pérez et al. Citation2014) but not always for the same waves. The mean latencies of waves I, III and V (Abbate et al. Citation1993; Vrca et al. Citation1996), I–III, III–V and I–V IPL (Abbate et al. Citation1993), and III–IV IPL (Vrca et al. Citation1996) were significantly longer for the exposed group than for the CG. In other studies, the exposed group showed longer latencies than the CG in all ABR waves and IPL except for wave I latency (Fuente, McPherson, and Cardemil Citation2013; Juárez-Pérez et al. Citation2014), I–III IPL (Fuente, McPherson, and Cardemil Citation2013) and III–V IPL (Juárez-Pérez et al. Citation2014).
ABR waves I, III and V are generated in the distal portion of the auditory nerve, cochlear nucleus, and in the lateral lemniscus, respectively (Moller Citation2013), and that prolonged III–V, or I–V IPLs are signs of brainstem involvement (Musiek, Shinn, and Jirsa Citation2007). Therefore, the ABR findings obtained in the present study suggest that the workers exposed to gasoline have auditory nerve dysfunction, as well as central auditory nervous system dysfunction involving brainstem. Dysfunction involving the auditory pathway in brainstem was also reported in a study of gasoline station workers (Quevedo et al. Citation2012) as well as in workers exposed to solvents (Abbate et al. Citation1993; Vrca et al. Citation1996; Prasher et al. Citation2005; Gopal Citation2008; Juárez-Pérez et al. Citation2014; Fuente, McPherson and Cardemil Citation2013).
The significant positive slope observed for association between the time of exposure to gasoline and the absolute latencies of ABR waves III and V and the IPLs of waves I–III and I–V, suggest progressive/cumulative neurotoxic effects with continuous chemical exposure. This was observed only for the group with hearing loss; suggesting that the auditory dysfunction progressively spread to other regions of the auditory nerve and brainstem as hearing loss became detectable. In a study of printing-press workers occupationally exposed to toluene (Vrca et al. Citation1997), a significant positive correlation was found between all ABR latencies and the duration of exposure.
Regarding ABR amplitude, gasoline station workers with hearing loss had significantly smaller wave III amplitudes in the left ear than non-exposed subjects, and smaller wave V amplitudes in the left ear than gasoline station workers with no hearing loss. No significant differences between groups were found for wave I ABR amplitudes. A previous study in which the ABR was evaluated in gasoline station workers (Quevedo et al. Citation2012) did not measure the ABR wave amplitudes. Deschamps et al. (Citation1993) studied only the ratio of amplitudes for waves I and V, and the results did not differ significantly between cases and controls. Vrca et al. (Citation1996) found that the ABR amplitude of all waves was significantly smaller in workers exposed to toluene than in non-exposed subjects. Gopal (Citation2008) studied only the amplitude growth for wave V, which was normal in all cases studied.
No significant difference was found for ABR wave I amplitude, but a significant difference for ABR wave III amplitude was found in a study of rats exposed to jet fuel (Guthrie et al. Citation2015). The authors concluded that there were no detectable effects on pre- and postsynaptic peripheral functions; but the exposure to JP-8 hydrocarbon fuel induced dysfunction within the central auditory nervous system of the exposed rats. Smaller amplitudes of wave I of the ABR have been observed in noise-exposed animals (Kujawa and Liberman Citation2009; Heeringa and Van Dijk Citation2014) and noise-exposed humans (Stamper and Johnson Citation2015), suggesting cochlear synaptopathy. Considering that this has been observed in the presence of normal hearing thresholds, this dysfunction has been called hidden hearing loss (Liberman et al. Citation2016). The present study did not find smaller ABR wave I amplitudes in the study group, so the findings differ from the report on cochlear synaptopathy from noise exposure. However, caution is needed to interpret this result, since measuring ABR wave I amplitude in humans is challenging (Mehraei et al. Citation2016) and great variability exists (Plack et al. Citation2016). In addition, while Vrca et al. (Citation1996) reported smaller ABR wave I amplitudes in workers exposed to toluene than in non-exposed subjects, it is likely that the study participants were also exposed to noise, since they worked in a printing press. Considering the importance of differentiating the effects of noise from the effects of chemicals on the auditory system, studies are needed on wave I amplitude and other methods to evaluate cochlear synaptopathy in workers exposed to solvents.
In this study, as the duration of exposure to gasoline increased, the wave V amplitude decreased in the left ear. Considering that ABR wave V amplitude seems not to be affected in cases of synaptopathy (Schaette and McAlpine Citation2011; Stamper and Johnson Citation2015; Plack et al. Citation2016), it is believed that this ABR finding can also contribute to the differentiation of the effects of noise from the effects of chemicals on the auditory system.
No significant differences between groups were found for latency or amplitude in the P300 test for either ear. No previous study used the P300 test with gasoline station workers. Bernardi (Citation2007) used P300 to evaluate workers from a printing industry who were exposed to solvents, including gasoline. The probability of P300 abnormalities was almost three times higher for the group with medium or high exposure to solvents compared with non-exposed or low-exposed groups. Significantly longer P300 latencies, but no significant differences in P300 amplitudes have been found in workers exposed to solvents compared with control subjects (Morrow, Steinhauer, and Hodgson Citation1992; Steinhauer et al. Citation1997). In a study of paint factory workers (Moen, Riise, and Kyvik Citation1999), the P300 latency was prolonged among the exposed workers compared with the control non-exposed participants before summer vacation. In the exposed group, it was significantly longer before 3 weeks of summer vacation than after. The authors concluded that the prolonged P300 latencies indicate the occurrence of an acute biologic effect in the nervous system related to organic solvent exposure. In another study of workers exposed to solvents (Laukli and Hansen Citation1995), the authors cited that the P300 was normal in 20 and abnormal in 13 subjects, however they do not mention the type of abnormality they found. Considering that P300 is generated by subcortical structures (e.g. the hippocampus and other centres within the limbic system and the thalamus), auditory regions in the cortex, and the frontal lobe (Hall Citation2007), the findings obtained in the current study suggest there is no effect of chemicals present in gasoline on those portions of the auditory system. However, further studies are needed to confirm this observation, as studies with similar ototoxicants reported such an effect (Morrow, Steinhauer, and Hodgson Citation1992; Laukli and Hansen Citation1995; Steinhauer et al. Citation1997; Moen, Riise, and Kyvik Citation1999; Bernardi Citation2007, Johnson et al. Citation2006).
The results obtained in this study justify the impetus to evaluate gasoline station workers for auditory disorders. In Brazil and many other countries, no specific occupational safety and health legislation requires health surveillance of this worker population, or for other populations unless their noise permissible exposure limits are exceeded (Brasil Citation1998). The importance of monitoring hearing health among workers who are exposed to chemicals, regardless of their noise exposure level, has been discussed previously (Morata, Fiorini et al. Citation1997; Sliwinska-Kowalska et al. Citation2007; Fuente, McPherson, and Hickson Citation2013).
The results from this study also showed the importance of using a battery of tests to evaluate the auditory system of gasoline station workers. Even if a subgroup of workers had hearing thresholds within the normal range, each of the audiologic tests used in this study (with the exception of P300) showed dysfunction in a specific part of the auditory system, suggesting that the gasoline station workers are at risk for the peripheral and central auditory system disorders. The importance of using a battery of tests to evaluate the auditory system of workers exposed to chemicals has been emphasised by many authors (Sliwinska-Kowalska et al. Citation2007; Fuente, McPherson, and Hickson Citation2011; Warner, Fuente, and Hickson Citation2015).
Pure tone audiometry remains an important test, especially in the context of annual monitoring programmes. However, hearing disorders can take place while pure-tone thresholds remain within normal limits in workers exposed to chemicals (as was the case with most participants in this study). Therefore, pure tone audiometry is not sufficient to evaluate the auditory system of this kind of workers, unless you have large populations and detailed exposure information. This has been emphasised by several authors (Fuente and McPherson Citation2007b; Sliwinska-Kowalska et al. Citation2007; Johnson and Morata Citation2010; Fuente, McPherson, and Hickson Citation2013; OSHA-NIOSH Citation2018).
ARTs results suggest the presence of a retrocochlear dysfunction in the gasoline station workers auditory system, and could help in differentiating the effects of noise from the effects of solvents. Considering that this audiological test is routine in the audiology clinic, and a simple and fast procedure, it could be easily implemented in the audiological evaluation of patients exposed to chemicals. Some of the studied gasoline station workers had cochlear dysfunctions involving the outer hair cells, as detected by the OAE testing. These tests could also contribute in the evaluation of solvent-exposed workers.
Test results indicate the possibility of central auditory dysfunction in some of the gasoline station workers. ABR findings from this study suggested the presence of central auditory dysfunction even in workers with all hearing thresholds within the normal range. This dysfunction was also reported in a previous study in which only gasoline station workers with normal hearing thresholds were included (Quevedo et al. Citation2012). ABR testing could detect the neurotoxicity of solvents on the auditory system before any abnormality is detected with pure-tone audiometry. It is also possible that measures of wave I, III, and wave V amplitudes could help to differentiate the effects of noise from the effects of chemicals on the auditory system. However, further research should be conducted to determine the effects of chemicals on the amplitude of ABR waves I, III and V.
The P300 auditory responses for gasoline station workers in this study were not significantly different than non-exposed study participants. Considering that many studies have used behavioural auditory processing tests and have found evidence for CAPD in workers exposed to solvents (Fuente and McPherson Citation2007a;Citationb; Fuente, McPherson, and Hickson Citation2011; Fuente, McPherson, and Hickson Citation2013), P300 assessments may not be sensitive for the detection of effects of gasoline vapours on the auditory system. Thus, it is suggested that in further studies with gasoline station workers, behavioural central auditory processing tests be used.
Our results also suggest the need for preventive measures to avoid the effects of exposure to ototoxicants among gasoline station workers. Gas stations in Brazil have not yet adopted a vapour recovery system to reduce vapour emissions during refuelling used in other countries. Studies have shown that these vapour recovery systems trap vapours within the nozzle, direct them back into the storage tank, and reduce vapour emission by approximately 20–25% (Hakkola and Saarinen Citation2000). In addition, chemical risks can increase because of certain work practices: (1) the use of a cotton towel between the nozzle of the fuel pump and the car to prevent splashing gasoline on cars, (2) sniffing the fuel tank cover to discover which kind of fuel is inside (gasoline or ethanol), manually siphoning fuel with a hose and (3) approaching the face of the gas tank to see if it is full (D’Alascio et al. Citation2014). Many customers in Brazil ask the gas attendants to add more gas to the tank after the automatic shut-off point, and that usually releases gas into the air that can be inhaled by attendants.
Fortunately, a recent ordinance by the Ministry of Labour and Employment of Brazil (Ordinance No. 1.109: Brasil Citation2016) establishes minimum occupational safety and health requirements for jobs in gas stations and requires the adoption of preventive measures, both individual (personal protective equipment) and collective (installing a vapour pick-up system in fuel pump nozzles), and prohibiting the use of towel, flannel, or similar fabrics to contain spills and leakages of liquid fuels, etc.).
Limitations of the study
An important limitation of this study is the lack of detailed current and previous exposure information of the gasoline station workers, including data on the individual uptake of solvents. Although the results obtained in this study indicated that gasoline station workers can have a higher risk of peripheral and central auditory dysfunctions than non-exposed persons, it is not possible to identify with precision the contribution gasoline exposure represented to their hearing status. Many factors can impair the auditory system, several of which were controlled for in this study. Studies with larger groups and better exposure information could help shed light on the contribution of different risk factors.
Conclusion
Gasoline station workers had significantly poorer performance than non-exposed subjects in PTA, ARTs, TEOAE, DPOAEs, and ABR. The results suggest the studied gasoline station workers have both peripheral and central auditory dysfunctions that may be related to gasoline exposure. These results can guide audiologists in the selection of tests to include in a battery for evaluating this population.
Declaration of interest
The authors report no conflict of interest.
Acknowledgements
Dr. David Byrne, Dr. Amanda Azman, and Dr. Susan Afanuh from the National Institute for Occupational Safety and Health provided helpful critiques of the manuscript. The authors wish to thank those who agreed to participate in the study for their time, interest, and cooperation. Some portions of this manuscript were presented at AudiologyNow, the annual meeting of the American Academy of Audiology, in Phoenix, Arizona (April, 2016) and at the XXXIII World Congress of Audiology, in Vancouver, Canada (September, 2016). The views expressed in this publication are those of the authors and do not necessarily represent the views of the National Institute for Occupational Safety and Health.
Additional information
Funding
References
- Abbate, C., C. Giorgianni, F. Muna, and R. Brecciaroli. 1993. “Neurotoxicity Induced by Exposure to Toluene. An Electrophysiologic Study.” International Archives of Occupational and Environmental Health 64 (6): 389–392. doi:10.1007/BF00517943.
- Bernardi, A. P. A. 2007. Exposição ocupacional a ruído e solventes e alterações auditivas periféricas e centrais. PhD Thesis, Universidade de São Paulo.
- Brasil. Ministério do Trabalho e Emprego. Norma Regulamentadora n° 15 – Atividades e operações insalubres, Ministério do Trabalho e Emprego - Secretaria de Inspeção do Trabalho. Diário Oficial da União, supl. 6 Jul. 1978.
- Brasil. Portaria n.° 19, de 9 de abril de 1998. Dispõe sobre normas e saúde do trabalhador. Diário Oficial da União, Brasília, 22 abr. 1998. Seção 1: 64–66. http://portal.mte.gov.br/data/files/FF8080812C0858EF012C121910EE5837/p_19980409_19.pdf.
- Brasil. Ministério do Trabalho. Portaria MT n° 1.109, de 20 de setembro de 2016. (DOU de 22/09/2016 - Seção 1). Aprova o anexo 2 – Exposição Ocupacional ao Benzeno em Postos Revendedores de Combustíveis – PRC, da Norma Regulamentadora n° 9, Programa de Prevenção de Riscos Ambientais – PPRA, aprovada pela Portaria n.° 3.214, de 8 de junho de 1978.
- Cezar-Vaz, M. R., L. P. Rocha, C. A. Bonow, M. R. S. Silva, J. C. Vaz, and L. S. Cardoso. 2012. “Risk Perception and Occupational Accidents: A Study of Gas Station Workers in Southern Brazil.” International Journal of Environmental Research and Public Health 9 (7): 2362–2377. doi:10.3390/ijerph9072362.
- D’Alascio, R. G., M. Menegali, A. S. Bornelli, and F. Magajewski. 2014. “Sintomas Relacionados à Exposição Ocupacional ao Benzeno e Hábitos Ocupacionais em Trabalhadores de Postos de Revenda de Combustíveis a Varejo na Região Sul de Santa Catarina.” Revista Brasileira de Medicina do Trabalho 12 (1): 21–29.
- Deschamps, D.,. R. Gamier, F. Lille, Y. Tran Dinh, L. Bertaux, A. Reygagne, and S. Dally. 1993. “Evoked Potentials and Cerebral Blood Flow 'in Solvent Induced Psycho-Organic Syndrome.” British Journal of Industrial Medicine 50 (4): 325–330. doi:10.1136/oem.50.4.325.
- Dhar, S., and J. W. Hall. III. 2012. Otoacoustic Emissions: Principles, Procedures, and Protocols. San Diego: Plural Publishing.
- Feeney, M. P., and K. S. Schairer. 2015. Acoustic Stapedius Reflex Measurements. In Handbook of Clinical Audiology, ed. Katz J., Chasin M., English K., Hood L., and Tillery K. 165–186. Philadelphia, PA: Wolters Kluwer.
- Fuente, A., and B. McPherson. 2007a. “Central Auditory Damage Induced by Solvent Exposure.” International Journal of Occupational Safety and Ergonomics : JOSE 13 (4): 391–397. doi:10.1080/10803548.2007.11105096.
- Fuente, A., and B. McPherson. 2007b. “Central Auditory Processing Effects Induced by Solvent Exposure.” International Journal of Occupational Medicine and Environmental Health 20 (3): 271–279. doi:10.2478/v10001-007-0030-4.
- Fuente, A., B. McPherson, and L. Hickson. 2011. “Central Auditory Dysfunction Associated with Exposure to a Mixture of Solvents.” International Journal of Audiology 50 (12): 857–865. doi:10.3109/14992027.2011.605805.
- Fuente, A., B. McPherson, and L. J. Hood. 2012. “Hearing Loss Associated with Xylene Exposure in a Laboratory Worker.” Journal of the American Academy of Audiology 23 (10): 824–830. doi:10.3766/jaaa.23.10.7.
- Fuente, A., B. McPherson, and F. Cardemil. 2013. “Xylene-Induced Auditory Dysfunction in Humans.” Ear and Hearing 34 (5): 651–660. doi:10.1097/AUD.0b013e31828d27d7.
- Fuente, A., B. McPherson, and X. Hormazabal. 2013. “Self-Reported Hearing Performance in Workers Exposed to Solvents.” Revista de Saude Publica 47 (1): 86–93. doi:10.1590/S0034-89102013000100012
- Fuente, A., B. McPherson, and L. Hickson. 2013. “Auditory Dysfunction Associated with Solvent Exposure.” BMC Public Health 13: 39. doi:10.1186/1471-2458-13-39.
- Gagnaire, F., and C. Langlais. 2005. “Relative Ototoxicity of 21 Aromatic solvents.” Archives of Toxicology 79 (6): 346–354. doi:10.1007/s00204-004-0636-2.
- Gopal, K. V. 2008. “Audiological Findings in Individuals Exposed to Organic Solvents: Case Studies.” Noise and Health 10 (40): 74–82. doi:10.4103/1463-1741.44345.
- Guthrie, O. W., B. A. Wong, S. M. McInturf, J. E. Reboulet, P. A. Ortiz, and D. R. Mattie. 2015. “Inhalation of Hydrocarbon Jet Fuel Suppress Central Auditory Nervous System Function.” Journal of Toxicology and Environmental Health, Part A 78 (18): 1154–1169. doi:10.1080/15287394.2015.1070389.
- Guthrie, O. W., B. A. Wong, S. M. McInturf, J. E. Reboulet, P. A. Ortiz, and D. R. Mattie. 2016. “Background Noise Contributes to Organic Solvent Induced Brain Dysfunction.” Neural Plasticity.:1–11. doi:10.1155/2016/8742725.
- Hakkola, M. A., and L. H. Saarinen. 2000. “Customer Exposure to Gasoline Vapors during Refueling at Service Stations.” Applied Occupational and Environmental Hygiene 15 (9): 677–680. doi:10.1080/10473220050110086.
- Hall, J. W. 2007. New Handbook of Auditory Evoked Responses. Boston: Pearson.
- Heeringa, A. N., and P. Van Dijk. 2014. “The Dissimilar Time Course of Temporary Threshold Shifts and Reduction of Inhibition in the Inferior Colliculus following Intense Sound Exposure.” Hearing Research 312: 38–47. doi:10.1016/j.heares.2014.03.004.
- Hughes, H., and K. L. Hunting. 2013. “Evaluation of the Effects of Exposure to Organic Solvents and Hazardous Noise among US Air Force Reserve Personnel.” Noise and Health 15 (67): 379–387. doi:10.4103/1463-1741.121224.
- Hunter, L. L., and N. Shahnaz. 2014. Acoustic Immittance Measures: Basic and Advanced Practice. San Diego: Plural Publishing.
- Johnson, A. C, and T. C. Morata. 2010. “Occupational Exposure to Chemicals and Hearing Impairment. The Nordic Expert Group for Criteria Documentation of Health Risks from Chemicals. Nordic Expert Group. Gothenburg.” Arbete Och Hälsa 44 (4): 1–177.
- Johnson, A. C., T. C. Morata, A. C. Lindblad, P. R. Nylén, E. Svensson, E. Krieg, A. Aksentijevic, and D. Prasher. 2006. “Audiological Findings in Workers Exposed to Styrene Alone or in Concert with Noise.” Noise & Health 8 (30): 45–57. doi:10.4103/1463-1741.32467
- Juárez-Pérez, C. A., A. Torres-Valenzuela, L. C. Haro-García, V. H. Borja-Aburto, and G. Aguilar-Madrid. 2014. “Ototoxicity Effects of Low Exposure to Solvent Mixture among Paint Manufacturing Workers.” International Journal of Audiology 53 (6): 370–376. doi:10.3109/14992027.2014.888597.
- Kaufman, L. R., G. K. LeMasters, D. M. Olsen, and P. Succop. 2005. “Effects of Concurrent Noise and Jet Fuel Exposure on Hearing Loss.” Journal of Occupational and Environmental Medicine 47 (3): 212–218. doi:10.1097/01.jom.0000155710.28289.0e
- Kujawa, S. G., and M. C. Liberman. 2009. “Adding Insult to Injury: cochlear Nerve Degeneration after “Temporary” Noise-Induced Hearing Loss.” Journal of Neuroscience 29 (45): 14077–14085. doi:10.1523/JNEUROSCI.2845-09.2009.
- Kumar, V., and O. P. Tandon. 1997. “Neurotoxic Effects of Rubber Factory Environment. An Auditory Evoked Potential Study.” Electromyography and Clinical Neurophysiology 37 (8): 469–473.
- Laukli, E., and P. W. Hansen. 1995. “An Audiometric Test Battery for the Evaluation of Occupational Exposure to Industrial Solvents.” Acta Oto-Laryngologica 115 (2): 162–164. doi:10.3109/00016489509139282
- Liberman, M. C., M. J. Epstein, S. S. Cleveland, H. Wang, and S. F. Maison. 2016. “Toward a Differential Diagnosis of Hidden Hearing Loss in Humans.” PLoS One 11 (9): e0162726. doi:10.1371/journal.pone.0162726.
- Loukzadeh, Z., A. Shojaoddiny-Ardekani, A. H. Mehrparvar, Z. Yazdi, and A. Mollasadeghi. 2014. “Effect of Exposure to a Mixture of Organic Solvents on Hearing Thresholds in Petrochemical Industry Workers.” Iran Journal of Otorhinolaryngology 26 (77): 235–243.
- Mehraei, G., A. E. Hickox, H. M. Bharadwaj, H. Goldberg, S. Verhulst, M. C. Liberman, and B. G. Shinn-Cunningham. 2016. “Auditory Brainstem Response Latency in Noise as a Marker of Cochlear Synaptopathy.” Journal of Neuroscience 36 (13): 3755–3764. doi:10.1523/JNEUROSCI.4460-15.2016.
- Mitri, S., Fonseca, A. S., U. B. Otero, M. M. Tabalipa, J. C. Moreira, J. C. P. de, and N. Sarcinelli. 2015. “Metabolic Polymorphisms and Clinical Findings Related to Benzene Poisoning Detected in Exposed Brazilian Gas-Station Workers.” International Journal of Environmental Research and Public Health 12 (7): 8434–8447. doi:10.3390/ijerph120708434.
- Moen, B. E., T. Riise, and K. R. Kyvik. 1999. “P300 Brain Potential among Workers Exposed to Organic Solvents.” Norsk Epidemiologi 9 (1): 27–31.
- Moller, A. R. 2013. Hearing: Anatomy, Physiology, and Disorders of the Auditory System. San Diego: Plural Publishing.
- Morata, T. C., D. E. Dunn, L. W. Kretschmer, G. K. Lemasters, and R. W. Keith. 1993. “Effects of Occupational Exposure to Organic Solvents and Noise on Hearing.” Scandinavian Journal of Work, Environment & Health 19 (4): 245–254. doi:10.5271/sjweh.1477.
- Morata, T. C., A. C. Fiorini, F. M. Fischer, S. Colacioppo, K. M. Wallingford, E. F. Krieg, D. E. Dunn, L. Gozzoli, M. A. Padrão, and C. L. Cesar. 1997. “Toluene-Induced Hearing Loss among Rotogravure Printing Workers.” Scandinavian Journal of Work, Environment and Health 23 (4): 289–298. doi:10.5271/sjweh.222.
- Morata, T. C., T. Engel, A. Durão, T. R. S. Costa, E. F. Krieg, D. E. Dunn, and M. A. Lozano. 1997. “Hearing Loss from Combined Exposures among Petroleum Refinery Workers.” Scandinavian Audiology 26 (3): 141–149. doi:10.3109/01050399709074987.
- Morrow, L. A., S. R. Steinhauer, and M. J. Hodgson. 1992. “Delay in P300 Latency in Patients with Organic Solvent exposure.” Archives of Neurology 49 (3): 315–320. doi:10.1001/archneur.1992.00530270135031
- Musiek, F. E., J. B. Shinn, and R. E. Jirsa. 2007. The Auditory Brainstem Response in Auditory Nerve and Brainstem Dysfunction. In Auditory Evoked Potentials: basic Principles and Clinical Application, edited by Burkard R. F., Don M., and Eggermont J. J. Philadelphia: Lippincott Willians & Wilkins. pp. 291–312.
- Odkvist, L. M., S. D. Arlinger, C. Edling, B. Larsby, and L. M. Bergholtz. 1987. “Audiological and Vestibulo-Oculomotor Findings in Workers Exposed to Solvents and Jet Fuel.” Scandinavian Audiology 16 (2): 75–81. doi:10.3109/01050398709042159.
- OSHA-NIOSH 2018. Occupational Safety and Health Administration and the National Institute for Occupational Safety and Health. Preventing Hearing Loss Caused by Chemical (Ototoxicity) and Noise Exposure. Safety and Health Information Bulletin SHIB 03-08-2018. DHHS (NIOSH) Publication No. 2018-124. https://www.osha.gov/dts/shib/shib030818.html
- Plack, C. J., A. Léger, G. Prendergast, K. Kluk, H. Guest, and K. J. Munro. 2016. “Toward a Diagnostic Test for Hidden Hearing Loss.” Trends in Hearing 20: 1–9. doi:10.1177/2331216516657466.
- Prasher, D., H. Al-Hajjaj, S. Aylott, and A. Aksentijevic. 2005. “Effect of Exposure to a Mixture of Solvents and Noise on Hearing and Balance in Aircraft Maintenance Workers.” Noise and Health 7 (29): 31. doi:10.4103/1463-1741.31876.
- Quevedo, L. S., T. Tochetto, M. A. Siqueira, and M. S. Machado. 2012. “Auditory Brainstem Response in Gas Station Attendants.” Brazilian Journal of Otorhinolaryngology 78 (6): 63–68. doi:10.5935/1808-8694.20120035
- Quevedo, L. S., T. M. Tochetto, and M. M. Siqueira. 2012. “Condição Coclear e Do Sistema Olivococlear Medial de Frentistas de Postos de Gasolina Expostos a Solventes Orgânicos.” Arquivos Internacionais de Otorrinolaringologia 16 (1): 50–56. doi:10.7162/S1809-48722012000100007.
- Schaette, R., and D. McAlpine. 2011. “Tinnitus with a Normal Audiogram: Physiological Evidence for Hidden Hearing Loss and Computational Model.” Journal of Neuroscience 31 (38): 13452–13457. doi:10.1523/JNEUROSCI.2156-11.2011.
- Sliwinska-Kowalska, M., D. Prasher, C. A. Rodrigues, E. Zamyslowska-Szmytke, P. Campo, D. Henderson, and S. P. Lund. 2007. “Ototoxicity of Organic Solvents - from Scientific Evidence to Health Policy.” International Journal of Occupational Medicine and Environmental Health 20 (2): 215–222. doi:10.2478/v10001-007-0021-5.
- Stamper, G. C., and T. A. Johnson. 2015. “Auditory Function in Normal-Hearing, Noise Exposed Human Ears.” Ear Hear 36 (2): 172–184. doi:10.1097/AUD.0000000000000107.
- Steinhauer, S. R., L. A. Morrow, R. Condray, and G. G. Dougherty. 1997. “Event-Related Potentials in Workers with Ongoing Occupational Exposure.” Biological Psychiatry 42 (9): 854–858. doi:10.1016/S0006-3223(97)00285-0.
- Sułkowski, W. J., S. Kowalska, W. Matyja, W. Guzek, W. Wesołowski, W. Szymczak, and P. Kostrzewski. 2002. “Effects of Occupational Exposure to a Mixture of Solvents on the Inner Ear: A Field Study.” International Journal of Occupational Medicine and Environmental Health 15 (3): 247–256.
- Tochetto, T. M., L. S. Quevedo, and M. A. Siqueira. 2013. “Condição Auditiva Dos Frentistas.” Revista Cefac 15 (5): 1137–1147. doi:10.1590/S1516-18462012005000107.
- Tremblay, K. L., A. Pinto, M. E. Fischer, B. E. Klein, R. Klein, S. Levy, T. S. Tweed, and K. J. Cruickshanks. 2015. “Self-Reported Hearing Difficulties among Adults with Normal Audiograms: The Beaver Dam Offspring Study.” Ear Hear 36 (6): e290–e299. doi:10.1097/AUD.0000000000000195.
- Tunsaringkarn, T., W. Siriwong, A. Rungsiyothin, and S. Nopparatbundit. 2012. “Occupational Exposure of Gasoline Station Workers to BTEX Compounds in Bangkok, Thailand.” International Journal of Occupational and Environmental Medicine 3 (3): 117–125.
- Venet, T., C. Rumeau, P. Campo, B. Rieger, A. Thomas, and C. Cour. 2011. “Neuronal Circuits Involved in the Middle-Ear Acoustic Reflex.” Toxicological Sciences 119 (1): 146–155. doi:10.1093/toxsci/kfq312.
- Vrca, A., V. N Karacić, D. Bozicević, V. Bozikov, and M. Malinar. 1996. “Brainstem Auditory Evoked Potentials in Individuals Exposed to Long-Term Low Concentrations of Toluene.” American Journal of Industrial Medicine 30 (1): 62–66. doi:10.1002/(SICI)1097-0274(199607)30:1<62::AID-AJIM10>3.0.CO;2-6.
- Vrca, A., D. Bozicević, V. Bozikov, R. Fuchs, and M. Malinar. 1997. “Brain Stem Evoked Potentials and Visual Evoked Potentials in Relation to the Length of Occupational Exposure to Low Levels of Toluene.” Acta Medica Croatica: Casopis Hravatske Akademije Medicinskih Znanosti 51 (4–5): 215–219.
- Warner, R., A. Fuente, and L. Hickson. 2015. “Jet Fuel, Noise, and the Central Auditory Nervous System: A Literature Review.” Military Medicine 180 (9): 950–955. doi:10.7205/MILMED-D-14-00733.
- Zhang, M., Y. Wang, Q. Wang, D. Yang, J. Zhang, F. Wang, and Q. Gu. 2013. “Ethylbenzene-Induced Hearing Loss, Neurobehavioral Function, and Neurotransmitter Alterations in Petrochemical Workers.” Journal of Occupational and Environmental Medicine 55 (9): 1001–1006. doi:10.1097/JOM.0b013e31829f3142.
- Zucki, F., L. C. B. J. Corteletti, M. H. Tsunemi, G. S. Munhoz, I. A. Quadros, and K. F. Alvarenga. 2017. “Characterization of Hearing Profile of Gas Station Attendants.” Audiology Communication Research 22: e1759. doi:10.1590/2317-6431-2016-1759.