
Abstract
Objective: To describe the auditory function in early old age in detail based on both psychoacoustic and physiological measures, and to investigate the prevalence of specific audiological and otological pathologies.
Design: An unscreened subsample from a population-based geriatric investigation was examined with otoscopy; tympanometry; pure-tone audiometry; word-recognition-in-noise test; distortion-product otoacoustic emissions; and auditory-evoked brainstem responses. Audiometric subtypes and diagnoses were established based on set criteria. The association between word scores and ABR was examined with linear regression analysis.
Study Sample: 251 persons aged 70 (113 men, 138 women, born in 1944) that were representative of the inhabitants of the city of Gothenburg.
Results: The prevalence of conductive pathology was 2% versus 49% for cochlear and 2% for auditory-neural pathology. Four percent had indeterminate type. Cochlear dysfunction was present in the majority of ears and around 20% performed worse-than-expected on speech testing. Poor performance on the speech in noise test was associated with prolonged interpeak latency interval of ABR waves I-V.
Conclusion: Specific otological and audiological pathologies, other than cochlear hearing loss, are rare in the general population at age 70. Additionally, there is subtle evidence of age-related decline of the auditory nerve. Longitudinal follow-up would be of great interest.
Introduction
A multitude of epidemiological studies of hearing loss in old age has been published over the years (Cruickshanks et al. Citation1998; Jonsson and Rosenhall Citation1998; Gopinath et al. Citation2009; Lin et al. Citation2011; Homans et al. Citation2017; Hoff et al. Citation2018). These are imperative to the understanding of hearing loss distribution in the population. In population-based studies of age-related hearing loss (ARHL), the most widely studied measure of hearing ability, by far, is pure-tone audiometry (Rosenhall Citation2015). Although providing valuable information about the degree of loss of hearing sensitivity across the frequency range, pure-tone audiometry is unable to distinguish between specific pathologies, especially since most studies only report air conduction testing. Further important limitations include it being a psychoacoustic measure, which may be susceptible to bias (Margolis et al. Citation2016), and the fact that it is only sensitive to changes in the auditory periphery. Additionally, these changes need to be of a certain magnitude to be reflected in the audiogram at all. As much as 30% of the outer hair cell population may be damaged without any elevation of audiometric thresholds (Chen and Fechter Citation2003).
In a clinical context, it is of relevance to establish which type of hearing loss a patient has, in order to choose appropriate rehabilitative strategies and predict outcomes. For this purpose, a combination of audiological measures are required. Distortion product otoacoustic emission testing (DPOAE) for instance, is sensitive to early cochlear dysfunction and holds the benefit of being an objective and frequency specific test (Hall et al. Citation1994; Kemp Citation2002). DPOAEs decrease as a function of (sensory) hearing loss and emissions are characteristically absent when the pure-tone threshold (PTT) exceeds 50–60 dB HL (Gorga et al. Citation1997). DPOAEs decrease with ageing, but the evidence is conflicting as to whether these effects are independent of peripheral hearing status or not (Strouse, Ochs, and Hall Citation1996; Oeken, Lenk, and Bootz Citation2000; Uchida et al. Citation2008). Little has been published regarding DPOAEs in the general aged population. In order to evaluate auditory functioning beyond the cochlea, various forms of speech testing and auditory evoked potential responses may be useful. It is well documented that auditory neural responses and speech audiometric performance is degraded in older persons, beyond what can be explained by peripheral hearing loss (Jerger Citation1992; Frisina and Frisina Citation1997; Gordon-Salant and Fitzgibbons Citation2004).
ARHL is aetiologically complex and multifactorial, resulting from both internal and environmental factors, as well as complex interactions between these (Rosenhall Citation2003; Gates and Mills Citation2005). Age effects emerge in various parts of the auditory pathways, with the bulk of changes occurring within the cochlea. In this context, the taxonomy proposed by Schuknecht and Gacek (Citation1993) is still highly valid, where loss and damage of outer hair cells (OHCs) is labelled sensory type. Sensory presbycusis typically affects the high frequencies and is limited to approximately 60 dB HL. There may also be degeneration of other structures within the cochlea, such as the Stria Vascularis. This is often referred to as metabolic type and is believed to be associated with a more flat audiogram shape. Moreover, some aged individuals suffer loss of afferent nerve fibres and damage in the synapses to the inner hair cells, manifesting as a neural hearing loss.
A significant loss of neurons is associated with severely impaired speech perception, particularly in relation to the audiogram (Syka Citation2002; Fetoni et al. Citation2015). Probable aged-related auditory neuropathy (PARAN) has been suggested as a term for this condition (Gates, Feeney, and Higdon Citation2003), which affects less than 1 percent at age 70–75 but becomes significantly more common with advancing age (Rosenhall, Hederstierna, and Idrizbegovic Citation2011). Furthermore, communicative performance in old age is thought to be negatively affected by a degradation of central auditory processing abilities, in combination with declines in cognitive functioning (Gates Citation2012; Profant et al. Citation2015; Sardone et al. Citation2019).
Finally, hearing in old age may also be aggravated by the presence of any conductive hearing loss. Mostly, this is linked to the coinciding occurrence of middle ear pathology, but the normal ageing process may also contribute to a reduced ability of the external and middle ear to conduct sound, as the tympanic membrane and ossicular chain become less mobile (Feeney and Sanford Citation2004).
ARHL is thus a complex phenomenon, which mainly involves changes – of various underlying pathology – in the auditory periphery, as well as presumed alterations in the central auditory pathways. Yet, as described, population-based studies rarely include tests other than pure-tone audiometry. The objective of the present paper is to report on the findings of a detailed audiological investigation, including both psychoacoustic and physiological test methods, performed on a representative population-based sample of 70-year-olds. The following issues are emphasised:
Is ARHL illuminated further if auditory tests beyond pure-tone audiometry are included?
What is the prevalence of different subtypes of ARHL and specific pathologies at age 70?
Material and methods
Design
The design was a cross-sectional birth cohort study. Data was collected within the framework of the Gothenburg H70 Birth Cohorts Study, a large-scale investigation of medical, psychological and social ageing. In 2014–15 a new birth cohort of 70-year olds born in 1944 (N = 1203, 54% women, 72% response rate) was added to the study. The sample mainly consisted of community dwelling individuals with only 2% being in sheltered living. Eighty-five percent were born in Sweden, 5% in other Nordic countries, 7% in other European countries and 4% outside of Europe. The educational level of the sample was relatively high, with 83% having completed more than 9 years of studies and 29% holding a University degree. The vast majority were retired, 13% were in part-time and 3% in full-time work. The average individual net-income was estimated at €1600. For full details, please refer to Rydberg Sterner et al. (Citation2018). The study also included a basic hearing investigation from which the results were recently published (Hoff et al. Citation2018).
For the purpose of the present study, a systematically selected unscreened subsample of the birth cohort described above was invited for further testing in an audiological laboratory. Participants born on dates ending with 2 and 5 (n = 305) were approached via telephone, and asked whether they were willing to participate. Out of these, eight did not reply, 31 declined, and 15 accepted but were unable to attend for various reasons. No specific exclusion criteria were employed. Transportation to the test site was offered to participants with mobility issues.
Subjects
The final subsample consisted of 251 individuals (113 men, 138 women) of which 12% and 8% respectively were non-native Swedish speakers. The response rate was 82 % (251 out of 305) and the subsample constituted 21% (251 out of 1202) of the total sample (H70/1944).
The representativeness of the study subsample in comparison with the total sample, from which it was selected, was tested through comparing participants with non-participants with respect to a number of variables. These included audiometric and self-reported hearing data; self-reported data on perceived general health status; presence of medical diagnoses, such as heart disease, hypertension, diabetes and kidney disease; and socio-demographic variables. There were no statistically significant differences between participants and non-participants, except for in three variables. The likelihood of participating in the sub study was higher for women reporting ear surgery (OR = 2.0, 95% CI: 1.3−3.2) and for men reporting self-assessed hearing loss (OR = 1.4, 95% CI: 1.0−2.3) and being physically active (OR = 1.5, 95% CI: 1.1−1.9). Based on this, the subsample was considered adequately representative of the 70-year old population in the City of Gothenburg.
Procedure
The audiological test battery consisted of psychoacoustic and physiological measures of hearing function, widely used for audiological diagnostic purposes. Qualified audiologists (MH and TT) carried out the tests in soundproof conditions. Participants with occluding wax (n = 2) were referred for wax removal and retested. The duration of the test procedure was 90–120 minutes including a break.
All participants underwent history taking, otoscopy and tympanometry prior to testing. Significant findings from these examinations were classified according to the following criteria: Ear canal pathology, e.g. otitis externa, stenosis, or exostoses; Tympanic membrane pathology, e.g. tympanosclerosis, perforated or retracted tympanic membranes; Self-report of known ear disease, i.e. reports of current or past ear disease; and Abnormal tympanogram, i.e. flat tympanogram (Type B).
Pure-tone audiometry
Pure-tone audiometry was conducted with an Interacoustics Equinox AC440 audiometer, according to a standardised method complying with the ISO-standard 8253-1:2010 (ISO Citation2010). Air conduction (AC) thresholds were obtained through Telephonics TDH-39 supra-aural headphones at eight test frequencies (0.25–8 kHz) and bone conduction (BC) thresholds via a Radioear B71 transducer at five frequencies (0.5–4 kHz). Narrow-band-noise masking was used in the contralateral ear whenever required. For AC testing, masking was applied when the threshold in the test ear was at least 40 dB worse than the air and/or bone threshold in the non-test ear. In the case of BC testing, masking was applied when the BC threshold was >10 dB better than the AC threshold in the same ear.
The degree of hearing loss was determined for each ear separately based on the pure-tone average across four frequencies 0.5–4 kHz, herein labelled PTA0.5,1,2,4 kHz, where ≤25 dB HL = No hearing loss, 26–40 dB HL = Mild, 41–60 dB HL = Moderate and >60 dB HL= Severe (WHO). Asymmetry in pure-tone audiometry was considered to be present if there was an average difference in AC thresholds between ears of 15 dB or greater at 0.5–3 kHz, and/or a difference of 25 dB or more at any two contiguous frequencies (Steiger Citation2005). Moreover, audiogram configurations were classified in accordance with criteria described by Hederstierna et al. (Citation2007): Gradually falling – Average threshold of 0.5 and 1 kHz is ≥15 dB better than the average of 4, 6, and 8 kHz; Sharply falling – Average threshold of 0.5 and 1 kHz is ≥30 dB better than the average of 4, 6, and 8 kHz; Flat – Thresholds across the frequencies 0.25–8 kHz differ ≤15 dB from each other; Rising – Average threshold of 0.25 and 0.5 kHz is ≥15 dB poorer than the average of 4, 6, and 8 kHz; Miscellaneous / other – audiogram configurations that do not meet any of the above criteria.
Speech in noise test
A test of speech recognition in noise (Magnusson Citation1995) was conducted according to clinical standards using the same equipment as described above. Phonemically balanced (PB) lists of 50 monosyllabic words were presented monaurally with a simultaneous speech-weighted noise (signal-to-noise ratio + 4 dB). The presentation level was set to 35 dB above the 3 frequency PTA across 0.5, 1 and 2 kHz, but was individually adjusted if needed in order to achieve acceptable audibility and comfort. Word Recognition in Noise Score (WRS-N), expressed as a percentage, was recorded for each ear. Participants who failed to identify any of the first 10 presented words were deemed to have failed the test, which was recorded as a WRS-N = 0, in which case the test was repeated in quiet condition, i.e. without the simultaneous noise (WRS-Q). Contralateral masking was used if the speech presentation level exceeded any of the AC or BC thresholds in the contralateral ear by 40 dB or more.
Additionally, a predicted WRS was calculated for each ear using a Speech Intelligibility Index based algorithm (Magnusson Citation1996), which takes into account the audiometric thresholds across the entire frequency range (0.25–8 kHz) as well as the presentation level. Recorded WRS-N that were worse than the predicted scores, by >16 percentage points, were classified as potentially pathological. Asymmetry in WRS-N was considered to be present if the difference in results between left and right ear was >16 percentage points (Hagerman Citation1976).
Distortion product otoacoustic emissions (DPOAE)
The equipment used for recording and analysing responses was the Otodynamics Echoport ILO292-II with the ILO v6 software (Otodynamics Ltd., Hatfield, UK). The equipment was calibrated in accordance with the supplier manual through verification of probe output in an artificial ear as well as real-time monitoring and adjustment of sound pressure level in the ear canal with the probe in situ. Correct positioning of the probe was verified at the beginning of each measurement by observation of the ear canal response via the “checkfit” procedure in the software. To ensure valid OAE recordings, i.e. absence of any artefacts generated by the system, a DPOAE Cavity test was performed. This test cheques that no signals above −5 dB SPL are present, at any of the test frequencies, when a DPOAE measurement is performed in a test cavity.
The participants were seated in a comfortable chair and were asked to stay still during the test. Two stimulus tones of frequencies f1 and f2 with a fixed frequency ratio of f2/f1 = 1.22, and of levels L1 = L2 = 70 dB SPL, were used to evoke the DPOAEs. Emissions were recorded at the 2f1–f2 site for 6 discrete test frequencies (f2 = 1–6 kHz). The ILO v6 software sets the significance level for DPOAEs at 2 standard deviations above the mean noise level. We considered emissions of at least 6 dB SNR as present, which gives a 99.9% confidence level according to the equipment manufacturer. Furthermore, emissions that met the specified SNR criteria for detection were classified as normal or abnormal based on the amplitude of the emission. Normative values were collected from Vinck et al. (Citation1996).
Since OAE recording relies on normal middle ear function, ears with Type B tympanograms were excluded from this particular analysis.
Auditory-Evoked brainstem responses (ABR)
ABR was measured with an Interacoustics Eclipse (EP25). Clicks of 80 dBnHL were delivered monaurally using EAR insert earphones (alternating polarity, click rate = 21.1 clicks/second). The latency of Jewitt waves I, III and V were recorded with electrodes placed on the ipsilateral earlobes and vertex. The signal was filtered with a 0.1–3 kHz band pass filter. In ears with severe hearing loss the level was increased to 90 dBnHL (n = 2). For consistency, the same person (TT) interpreted all of the responses.
In order to identify abnormal ABR results, an age-appropriate reference material was created for men and women separately, by selecting participants with audiometric thresholds within normal limits (PTA0.5,1,2,4 kHz ≤ 25 dB HL and a PTT at 4 kHz ≤ 50 dB HL) and with no self-reported hearing difficulties. Altogether, 155 right ears and 130 left ears were included. The limit for normality was considered as values falling within ± two standard deviations of the means. This resulted in the following cut-off scores: an inter-peak latency (IPL) of waves I–V of ≥4.8 ms for men, or ≥4.6 ms for women; or an interaural latency difference (ILD) of the IPL of waves I–V ≥ 0.4 ms. Individual results that, after having corrected for the PTT at 4 kHz with 0.1 ms per 10 dB above 50 dB HL (Rosenhamer, Lindström, and Lundborg Citation1981), exceeded these cut-offs were thus considered abnormal. Ears with severe loss (PTA0.5,1,2,4 kHz > 60 dB HL) or conductive pathology were excluded.
Definitions of audiometric subtypes
Differential diagnoses of hearing loss were established for each individual based on a combination of test results.
Conductive hearing loss was defined as air-bone-gaps of at least 15 dB at 3 consecutive frequencies, and/or of at least 20 dB at any individual frequency, in combination with either otoscopy, tympanometry or patient history that supported a middle ear pathology.
Sensorineural hearing loss (no air-bone-gaps present) was divided into cochlear, neural, or, if too severe to analyse, indeterminate. Neural hearing loss was diagnosed if a participant had abnormal ABR findings in combination with poor word recognition, in accordance with the criteria described previously. Within this group, any word recognition score in quiet of less than 30% was classified as probable age-related auditory neuropathy (PARAN) in accordance with the definition used by Rosenhall, Hederstierna, and Idrizbegovic (Citation2011). Ears with PTA0.5,1,2,4 > 60 dB HL were classified as indeterminate type and all other sensorineural losses as cochlear type.
Data analyses
Descriptive statistics and comparison of means and proportions were compiled for all of the tests included in the audiological test battery, using Students T-test and Chi Squared tests, depending on the type of data.
Linear regression analysis was used to test whether there was any association between the results of the speech testing and ABR. The intention of the analysis was to test to what extent having poor speech perception could be explained by the integrity of the auditory neural function. Since the WRS-N is greatly influenced by hearing loss, we instead chose the “audiogram corrected” word score as the dependent variable, i.e. the difference between the measured and the predicted word score – where a positive value indicates that the measured score is worse than predicted. The dependent variable was approximately normally distributed.
The ABR interpeak latency interval between waves I and V (IPL I-V) was chosen as the main explanatory variable. One reason for choosing the IPL I-V is that it is known to be a good marker of auditory neural function (Lightfoot Citation1992). Furthermore, it is less influenced by peripheral hearing loss than, for instance, the absolute latency of wave V (Kirsh et al. Citation1992). The participant’s gender and audiogram configuration were considered as other possible explanatory factors. For the multiple linear regression, independent variables were added simultaneously into the model (“enter” command in SPSS). The analyses were made for left and right ear separately. Moreover, in order to avoid bias, conductive hearing losses and participants who did not have Swedish as their native language were excluded from this analysis.
Analyses were made with IBM SPSS for Windows version 25.0 and a local software, GIDSS (Geriatric Department’s Interactive Database and Statistical System).
Ethics
The project was approved by the Regional Ethical Review Board (reg.no. 976-13). All participants gave written informed consent.
Results
Pure-tone audiometry
All 251 participants completed pure-tone-audiometry. The average participant had a gradually sloping hearing loss of mild to moderate severity (), typical for presbycusis. There were no significant differences between average air and bone conduction thresholds at any frequencies, reflecting good middle ear function. Furthermore, according to the definitions employed in this study, hearing loss was present in 53% of male participants, of which 34% bilaterally, 16% in the left ear (LE) only and 3% in the right ear (RE) only. The corresponding figure for female participants was 46%, of which 28% bilaterally, 14% LE, and 4% RE. The distribution of hearing loss severities and audiogram configurations by ear and gender are shown in . Mild hearing loss was the most common category for both men and women, affecting about a third of the sample, followed by moderate hearing loss, affecting 5–10%. Only 1–2% of female ears and 4–5% of male ears had severe loss. In terms of audiogram configuration, sharply falling was much more prevalent in men (∼60%) than women (∼30%), p < 0.001.Women on the other hand significantly more often had configurations classified as flat (8%, versus 1% in men) or other (∼30%).
Figure 1. Mean pure-tone thresholds for air and bone conduction audiometry by test ear, test frequency and gender. Air and bone conduction thresholds do not differ by more than 10 dB, consistent with sensorineural hearing loss.
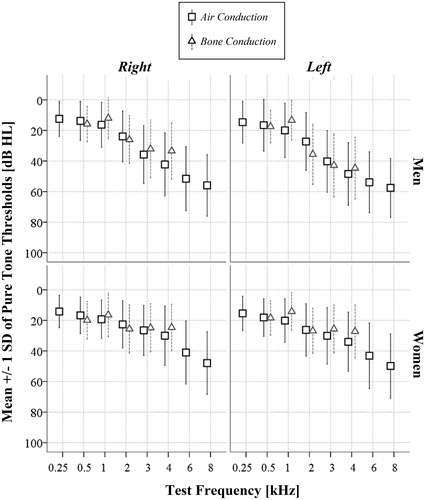
Table 1. Distribution of hearing loss degrees and audiogram configurations by ear and gender.
Dpoae
Valid DPOAE recordings were available for 244 participants. The average noise levels for the measurements ranged from −13 to −4.8 dB SPL (). The lower frequencies were noisier than the higher ones. DPOAEs were present and normal in just under half of ears at 1.5 and 2 kHz (range: 46–49 %). Thereafter, the proportion of DPOAEs classified as present and normal fell with each increase in test frequency, with a sharper slope noted in men (). Conversely, DPOAEs that were either absent or present but abnormal, thus assumed to indicate cochlear dysfunction, increased with test frequency. At 6 kHz, 99% of male ears and 90% of female ears had DPOAEs that were absent or abnormal. A matching pattern was seen for the DPOAE amplitudes, which ranged from −8.5 to 21.1 dB SPL and averaged at around 9 dB SPL at 1.5 kHz and at around −1 dB SPL at 6 kHz (). Women’s amplitudes were significantly higher than mens' were at 4 and 6 kHz (p < 0.05).
Figure 2. Prevalence of cochlear dysfunction determined with DPOAE, by test frequency and gender, in an unscreened population-based sample of 70-year old persons (n = 244). The data labels refer to the present and abnormal and absent categories added together.
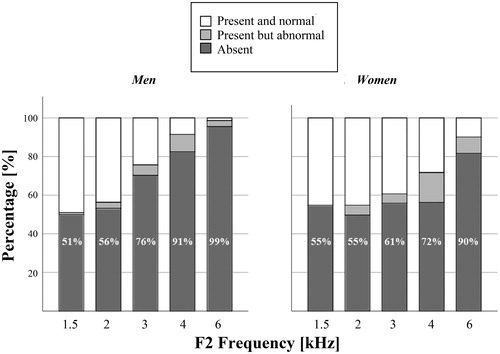
Table 2. Descriptive statistics for the speech in noise test, DPOAE and ABR.
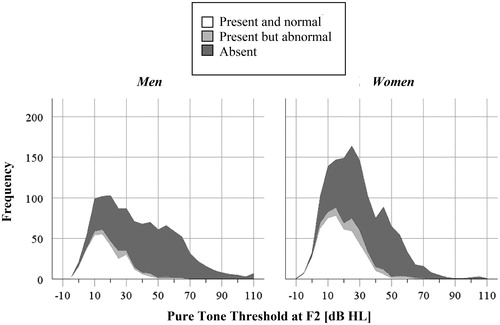
As expected, DPOAEs were generally not present when the equivalent pure-tone threshold at f2 exceeded 40 dB HL, which is evident from . The 95th percentile of the hearing threshold was at 35 dB HL when the DPOAE was present and normal and at 53 dB HL when present but abnormal. Furthermore, suggests that cochlear dysfunction – measured with DPOAE – is common across the range of pure-tone thresholds, even when thresholds are within normal limits.
Figure 3. Stacked histogram of the pure-tone thresholds at F2 clustered on whether the DPOAE at that frequency was present or not. In the vast majority of measurements, DPOAEs classified as present and normal are associated with hearing thresholds of 40 dB HL or less. However, DPOAEs classified as abnormal (grey categories) are common across the x-axis, demonstrating that it would be difficult to predict the audiogram based on DPOAE testing in this age group.
Speech audiometry
Speech audiometry results were available for 250 participants, of which 3 right and 4 left ears were not tested due to very severe hearing loss. For male participants, the mean WRS-N was 59.5% (SD = 17.2) and 59.4% (SD = 15.7) in right and left ear respectively. The equivalent figures for female participants were 69.1% (SD = 12.5) and 66.4% (SD = 13.6), which was significantly higher compared with the men’s results (see ). A small percentage of participants failed the test (5% in right ear, 4% in left ear). These participants had WRS-Q that ranged between 50 and 90 %. Men and women were equally likely to fail the test. Furthermore, ear asymmetry was present in 15 % of men, versus 12 % of women (). Right-ear advantage was roughly five times more frequent than left-ear advantage was. The majority of the participants had a
WRS-N that was in agreement (± 16 p.p.) with their predicted score. Having a worse than predicted score was nearly twice as common in men, 27 %, compared with women, 13% (p < 0.05)
Abr
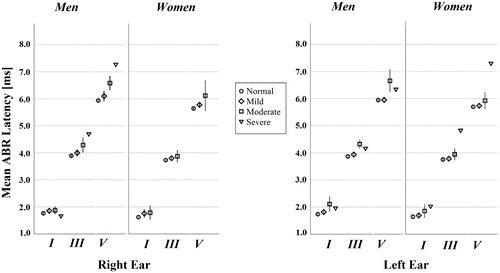
246 participants underwent ABR with valid results. None of the recordings yielded uninterpretable or absent waveforms and the reproducibility was acceptable for all recordings. Average absolute and interpeak latencies for waves I, III and V by ear and gender are given in , and by hearing loss severity in . The average latencies were shorter for women, by approximately 0.3 ms for wave V, 0.2 ms for wave III, and 0.1 ms for wave I (p < 0.01). Interpeak latencies were also shorter in women. The difference was statistically significant for IPL I-V in the right ear (p < 0.01) and for IPL III-V in both ears (p < 0.05). No gender difference was seen, however, for the IPL I-III. In comparison with locally held reference values for the selected test parameters in young, healthy adults, the ABR latencies recorded in this study were significantly longer.
Figure 4. Mean ABR latencies for waves I, III and V by hearing loss severity and gender for left and right ear separately (n = 246). The error bars show the 95% confidence intervals around the mean. The severe hearing loss category only contains a few observations; therefore, the error bars have been omitted. None of the women had severe loss in the right ear.
Abnormal ABR results that could not be explained by poor peripheral hearing, was identified in a small percentage of participants. Prolongation of the IPL of waves I-V was present in 4% of men’s right ears and 4% of men’s left ears, whereas 1% and 2% of the women’s right and left ears respectively had this finding. Moreover, inter-aural latency difference of IPL I-V of more than 0.4 ms affected 8% of male and 11% of female participants. The differences between men and women on these parameters were not significant ().
Association between speech audiometry and ABR
Performing worse than predicted on the speech in noise test was positively associated with the interpeak latency interval (IPL IV) in the right ear (β = 0.19, p = 0.003), and so was gender (β = −0.24, p < 0.001) and audiogram configuration (β = 0.27, p < 0.001) where being male or having a sharply falling audiogram was associated with a larger deviation from the predicted word score (See ). Although the associations were significant, the model fit measures (R2) were low. Including all factors in a multiple linear regression improved the model fit, while the adjusted associations remained significant for all of the factors. Still, the adjusted model only explained ∼13% of the variance in the dependent variable. Interestingly, the same effect was not seen in the left ear, where only gender was significantly associated with the outcome ().
Table 3. Factors associated with speech in noise recognition, in right and left ear separately.
Audiometric subtypes and specific diagnoses
Otoscopically, 17 individuals (7%) had pathological changes in the ear canal and 15 (6%) in the tympanic membranes. The most common findings were exostoses, otitis externa, and tympanosclerosis. None of the investigated ears had tympanic membrane perforations, nor were there any signs of active infections. Valid tympanometry results were available for 94% of right ears and 90% of left ears. Abnormal tympanograms were present in 5 right ears and 10 left ears (). Based on self-reported data, only a few of the participants were aware of specific ear or hearing related diagnoses. These included Ménière’s Disease (N = 2), Borrelia deafness (N = 1) and Chronic otitis media (N = 1) ().
Table 4. Estimates of the prevalence for various observed and self-reported specific ear and hearing related diagnoses by gender and ear.
Conductive hearing loss was diagnosed in five participants (2 men, 3 women), corresponding to 3.7% of those with hearing loss, or 2% of the whole sample. All had a mixed type hearing loss with BC thresholds within normal limits. A further 10 participants hade air-bone-gaps that were caused by collapsing ear canals (N = 6 ears) or methodological issues (N = 6 ears). Those with confirmed middle ear pathologies all reported having had middle ear surgery.
The remainder of hearing losses (96.3%) thus were of sensorineural type. The vast majority of these cases were classified as being of cochlear origin, with ABR results within expected limits, and mostly with WRS-N in agreement with the predicted score. According to the pre-defined criteria used in this study, i.e. a combination of abnormal ABRs and speech recognition findings, five individuals (2%, 4 men, 1 woman) were diagnosed with auditory-neural type hearing loss. None fulfilled the criteria for probable age-related auditory neuropathy (PARAN), since the few participants who failed the speech in noise test all performed well in quiet condition. The pathologies reported here were not mutually exclusive, i.e. one participant may have had several of these.
Discussion
Pure-tone audiometry and DPOAE
The patterns in pure-tone audiometry results of this study resembled those of previous population-based studies (Roth, Hanebuth, and Probst Citation2011; Rosenhall Citation2015). The left ears were on average worse than the right, and men’s hearing was worse than women’s in the higher frequencies. There were, however, tendencies towards a decrease in gender difference compared to many earlier studies, which likely is an effect of men retaining good hearing into older ages today, due to better regulations of harmful noise in work places (Hoff et al. Citation2018). This was also noted in the most recent update of the ISO curves, which describe hearing thresholds by age and gender (International Organization for Standardization Citation2017). Moreover, asymmetrical pure-tone thresholds were relatively common in both men and women. The fact that most of those with asymmetry had good speech recognition in noise and normal ABRs indicates that asymmetrical PTTs usually are of a benign nature in this age group, in line with the findings of other studies (Leskowitz et al. Citation2016). It is important that audiology clinicians are aware of this, to reduce the risk for over-referral to ear- nose and throat specialists.
Regarding audiogram configurations, men of this study significantly more often had sharply falling audiograms, whereas women significantly more often had flat or other. This finding is consistent with other research in the area (Hannula et al. Citation2011). Flat audiograms were rather uncommon in our study, much lower compared to what was reported for a Belgian population aged 55–65 (Demeester et al. Citation2009) and a Turkish population aged 50–80 (Kaya et al. Citation2015). There are several possible explanations for this finding. For instance, our sample was unscreened and thus contained noise exposed individuals. Furthermore, the definition we used for what constitutes a flat audiogram was rather strict which means that some near flat configurations would have been classified as other instead. In light of the aetiological categorisation of presbycusis based on audiogram shapes, proposed by (Schuknecht and Gacek Citation1993) and later corroborated by (Ohlemiller Citation2004), the cochlear pathologies seen in our study were mainly of sensory type, and – in women – of metabolic type.
The prevalence of presumed cochlear dysfunction in this study, i.e. the number of DPOAEs that were classified as either absent or present but with abnormally low amplitude in dB SPL, was higher than the prevalence of audiometric hearing loss. In fact, at test frequencies where the pure-tone threshold at f2 was within normal limits (≤20 dB HL), it was approximately as common to have an absent or abnormal DPOAE, as it was to have a present and normal response ( and ). This finding may be viewed as evidence of early ageing in the cochlea. Another consequence of this finding is that it is not possible to identify persons with audiometric hearing loss based on the outcome of the DPOAE test. Hence, it is not recommended to use DPOAE as a means of screening for hearing loss within this age group. Similar results have been demonstrated previously (Engdahl, Tambs, and Hoffman Citation2013). A combination of audiometry and OAE may instead be preferable.
Comparing the results of the DPOAE test performed in this study with other population-based data is problematic, owing to the fact that such data is scarce and due to the variation in stimulus parameters and definitions used in different studies. The presence and amplitudes of DPOAEs seen in our study were consistently higher across the entire test frequency range, compared with corresponding figures reported by Engdahl (Citation2002) for an unscreened sample (N = 6415) of the Norwegian population, of similar age. In his study fixed stimuli of 55/65 dB SPL were used (lower than in the present study) which may explain why our results differ. However, the effect of test ear and gender noted in Engdahl’s study is similar to our study, i.e. left ears and men have slightly lower amplitudes. Furthermore, the presence of DPOAEs in our study was substantially lower than what Johansson and Arlinger (Citation2003) reported for samples of the general Swedish population aged 60–79. This is perhaps not surprising, since their study excluded subjects exposed to hazardous noise, whereas no such criterion was applied in our study.
Speech in noise test and ABR
Although most participants of this study performed well on the speech in noise test, within what could expected based on their audiometric hearing loss, a certain percentage of participants either performed below the expected limit or failed the test. From the linear regression () it was evident that the audiogram configuration had an influence on the outcome, as did gender. The algorithm that we used for predicting the word scores (Magnusson Citation1996) takes the degree of hearing loss and the presentation level into account, and also – indirectly – the audiogram configuration, as the prediction includes all test frequencies (0.25–8 kHz). In spite of this, participants with sharply falling audiograms were more likely to perform poorly. The fact that there was a significant association between the ABR interpeak latency of wave I-V and having a WRS-N that was worse than predicted, even after adjusting for audiogram configuration and gender, may be interpreted as evidence of subtle ageing of the auditory neural function and thus the presence of neural presbycusis in early old age. The effect, however, was small and only explained some of the variation in speech in noise performance. Additionally, the effect was not present in the left ear. This is possibly a consequence of the hemispheric language dominance of the left side and the associated right ear advantage (Ahonniska et al. Citation1993).
Poor performance in speech audiometry may of course also be attributed to non-audiological factors, such as cognition and language skills, or the integrity of central auditory functions. In the regression analysis, participants with non-Swedish native language were excluded to avoid bias. In fact, there was a significant correlation between the participant’s native language and speech in noise performance (not in any table), which highlights the importance of interpreting WRS of non-native speaking patients in diagnostic situations with caution, in accordance with previous research on the topic (Warzybok et al. Citation2015).
In terms of ABR results, a clear gender difference was noted, with women presenting with shorter absolute and interpeak latencies. This finding is in accordance with much of the previous literature on the topic (Jerger and Hall Citation1980; Patterson et al. Citation1981; Rosenhall, Pedersen, and Dotevall Citation1986; Trune, Mitchell, and Phillips Citation1988; Mitchell, Phillips, and Trune Citation1989). According to Mitchell, Phillips, and Trune (Citation1989), men’s longer ABR latencies may in part be attributed to head size, but even after adjusting for this parameter a gender difference remains. Furthermore, our findings support earlier observations of the gender difference affecting waves III and V, but not wave I (Patterson et al. Citation1981).
Specific pathologies
In the present study, only 5 participants (2%) had a conductive hearing loss pathology. In comparison to previous population-based studies from the same investigation (Rudin et al. Citation1983; Rosenhall, Hederstierna, and Idrizbegovic Citation2011), there were considerably less cases of otological disorders in this sample. A potential reason for this is a general improvement of hearing health among old persons (Hoff et al. Citation2018). The participants of this study, born in 1944, had access to better otological health care compared to previous generations, including antibiotics and surgical options.
Equally as many (2%) were diagnosed with neural type hearing loss, although with subtle signs only. One had been treated with radiotherapy for head cancer, which perhaps may have affected the ABR, and another one had Motor Neuron Disease. Furthermore, one reported unilateral pulsatile tinnitus (under medical investigation). Interestingly, the one participant who reported having been diagnosed with a vestibular schwannoma did not have any other symptoms or indications of neuropathy, other than asymmetrical PTTs. A further 10%, or thereabout, of the sample had abnormal ABR findings without any other indications of pathology. Asymmetrical interpeak latency of waves I-V were particularly frequent (affecting 1 in 10), especially in female participants. It cannot be completely ruled out, however, that some of these findings may have been due to incorrect classifications of wave I. In our study, one experienced person interpreted all of the ABR readings as we judged it to increase the consistency. In retrospect however, the use of two raters may have been helpful.
Strengths and limitations
This study provides current insight into the state of the auditory function in early old age, in greater detail than is typically reported for population-based samples, which is an important strength. Additionally, it provides normative data for the performance of unscreened populations on widely used behavioural and physiological measures of auditory function: speech recognition in noise test, DPOAE and ABR, as well as their inter-associations. Although the effects of aging on the performance of these tests have received considerable attention in previous studies, many of these were experimental studies conducted on smaller samples or animals (Jerger and Hall Citation1980; Rosenhall, Pedersen, and Dotevall Citation1986; Hunter and Willott Citation1987; Mitchell, Phillips, and Trune Citation1989; Boettcher, Mills, and Norton Citation1993; Boettcher, Mills, and Norton Citation1993; Oku and Hasegewa Citation1997). Through adopting an epidemiological research approach, we were able to investigate common clinical tests in a representative age-homogenous sample. These findings should be useful as a reference for clinicians and for further research, including longitudinal follow-up.
A potential limitation of the study is that it reflects the hearing status of a population in a distinct geographical area. It is difficult to know whether the findings would be applicable in other parts of the world. Another aspect to consider is the representativeness of the sample. No exclusion criteria were used in this study, but it is well known that those with poor physical and cognitive health are less likely to participate in studies, for obvious reasons. Consequently, the population prevalence figures that are estimated in need to be interpreted with caution. Furthermore, although measures were taken to obtain a complete data material, some participants only performed part of the test battery. The proportion of missing data was small, <5% for each of the tests. Yet, one must consider the possibility of it having affected the rest results.
Conclusions
In all, the findings of this study support the notion that age-related decline in hearing function at age 70 chiefly originates from changes in the cochlea, with possible subtle signs of auditory neural ageing. Thus, in spite of its limitations pure-tone audiometry remains a sensitive and valuable measure of presbycusis in population-based studies. Additionally, the speech in noise test offers a valuable complement in the characterisation of presbycusis in early old age, whereas the usefulness of OAEs and ABRs is limited to clinical settings or experimental research. Furthermore, the occurrence of middle ear disease, auditory neural pathology or other specific ear and hearing related diagnoses, is relatively rare in the general population at age 70, and the occurrence of middle ear disease seems to have decreased in the same geographical area during the last 30–40 years.
Acknowledgements
The authors thank Inger Wikström for administrative support and Valter Sundh for statistical support. We also thank all of the participants of this study. None of the agencies had a role in the design, execution, analysis or interpretation of data, nor in the writing of the manuscript.
Disclosure statement
No potential conflict of interest was reported by the author(s).
Additional information
Funding
References
- Ahonniska, J., M. Cantell, A. Tolvanen, and H. Lyytinen. 1993. “Speech Perception and Brain Laterality: The Effect of Ear Advantage on Auditory Event-Related Potentials.” Brain and Language 45 (2): 127–146. doi:10.1006/brln.1993.1039.
- Boettcher, F. A., J. H. Mills, and B. L. Norton. 1993. “Age-Related Changes in Auditory Evoked Potentials of Gerbils. I. Response Amplitudes.” Hearing Research 71 (1–2): 137–145. doi:10.1016/0378-5955(93)90029-z.
- Boettcher, F. A., J. H. Mills, B. L. Norton, and R. A. Schmiedt. 1993. “Age-Related Changes in Auditory Evoked Potentials of Gerbils. II. Response Latencies.” Hearing Research 71 (1–2): 146–156. doi:10.1016/0378-5955(93)90030-5.
- Chen, G. D., and L. D. Fechter. 2003. “The Relationship between Noise-Induced Hearing Loss and Hair Cell Loss in Rats.” Hearing Research 177 (1–2): 81–90. doi:10.1016/s0378-5955(02)00802-x.
- Cruickshanks, K. J., T. L. Wiley, T. S. Tweed, B. E. K. Klein, R. Klein, J. A. Mares-Perlman, D. M. Nondahl, et al. 1998. “Prevalence of Hearing Loss in Older Adults in Beaver Dam, Wisconsin: The Epidemiology of Hearing Loss Study.” American Journal of Epidemiology 148 (9): 879–886. doi:10.1093/oxfordjournals.aje.a009713.
- Demeester, Kelly, Astrid van Wieringen, Jan-jaap Hendrickx, Vedat Topsakal, Erik Fransen, Lut van Laer, Guy Van Camp, et al. 2009. “Audiometric Shape and Presbycusis.” International Journal of Audiology 48 (4): 222–232. doi:10.1080/14992020802441799.
- Engdahl, B. 2002. “Otoacoustic Emissions in the General Adult Population of Nord-Trondelag, Norway: I. Distributions by Age, Gender, and Ear Side: Emisiones Otoacústicas En La Poblacioan Adulta General De Nord-Trøndelag, Noruega: I. Distribuciones Por Edad, Género Y Oído Estudiado.” International Journal of Audiology 41: 64–77. doi:10.3109/14992020209101314.
- Engdahl, B., K. Tambs, and H. J. Hoffman. 2013. “Otoacoustic Emissions, Pure-Tone Audiometry, and Self-Reported Hearing.” International Journal of Audiology 52 (2): 74–82. doi:10.3109/14992027.2012.733423.
- Feeney, M. P., and C. A. Sanford. 2004. “Age Effects in the Human Middle Ear: Wideband Acoustical Measures.” The Journal of the Acoustical Society of America 116 (6): 3546–3558. doi:10.1121/1.1808221.
- Fetoni, A. R., D. Troiani, L. Petrosini, and G. Paludetti. 2015. “Cochlear Injury and Adaptive Plasticity of the Auditory Cortex.” Frontiers in Aging Neuroscience 7: 8. doi:10.3389/fnagi.2015.00008.
- Frisina, D. R., and R. D. Frisina. 1997. “Speech Recognition in Noise and Presbycusis: relations to Possible Neural mechanisms.” Hear. Res 106 (1–2): 95–104. doi:10.1016/s0378-5955(97)00006-3.
- Gates, G. A. 2012. “Central Presbycusis: An Emerging View.” Otolaryngology-Head and Neck Surgery: Official Journal of American Academy of Otolaryngology-Head and Neck Surgery 147 (1): 1–2. doi:10.1177/0194599812446282.
- Gates, G. A., P. M. Feeney, and R. J. Higdon. 2003. “Word Recognition and the Articulation Index in Older Listeners with Probable Age-Related Auditory Neuropathy.” Journal of the American Academy of Audiology 14 (10): 574–581. doi:10.3766/jaaa.14.10.6.
- Gates, G. A., and J. H. Mills. 2005. “Presbycusis.” Lancet (London, England) 366 (9491): 1111–1120. doi:10.1016/S0140-6736(05)67423-5.
- Gopinath, Bamini, Elena Rochtchina, JieJin Wang, Julie Schneider, Stephen R. Leeder, and Paul Mitchell. 2009. “Prevalence of Age-Related Hearing Loss in Older Adults: Blue Mountains Study.” Archives of Internal Medicine 169 (4): 415–418. doi:10.1001/archinternmed.2008.597.
- Gordon-Salant, S., and P. J. Fitzgibbons. 2004. “Effects of Stimulus and Noise Rate Variability on Speech Perception by Younger and Older Adults.” The Journal of the Acoustical Society of America 115 (4): 1808–1817. doi:10.1121/1.1645249.
- Gorga, Michael P., Stephen T. Neely, Brenda Ohlrich, Brenda Hoover, Joelle Redner, and Jo Peters. 1997. “From Laboratory to Clinic: A Large Scale Study of Distortion Product Otoacoustic Emissions in Ears with Normal Hearing and Ears with Hearing Loss.” Ear and Hearing 18 (6): 440–455. doi:10.1097/00003446-199712000-00003.
- Hagerman, B. 1976. “Reliability in the Determination of Speech Discrimination.” Scandinavian Audiology 5 (4): 219–228. doi:10.3109/01050397609044991.
- Hall, J. W., J. E. Baer, P. A. Chase, and M. K. Schwaber. 1994. “Clinical Application of Otoacoustic Emissions: What Do we Know about Factors Influencing Measurement and Analysis?” Otolaryngology-Head and Neck Surgery: official Journal of American Academy of Otolaryngology-Head and Neck Surgery 110 (1): 22–38. doi:10.1177/019459989411000103.
- Hannula, S., R. Bloigu, K. Majamaa, M. Sorri, and E. Mäki-Torkko. 2011. “Audiogram Configurations among Older Adults: Prevalence and Relation to Self-Reported Hearing Problems.” International Journal of Audiology 50 (11): 793–801. doi:10.3109/14992027.2011.593562.
- Hederstierna, C., M. Hultcrantz, A. Collins, and U. Rosenhall. 2007. “Hearing in Women at Menopause. Prevalence of Hearing Loss, Audiometric Configuration and Relation to Hormone Replacement Therapy.” Acta Oto-Laryngologica 127 (2): 149–155. doi:10.1080/00016480600794446.
- Hoff, M., T. Tengstrand, A. Sadeghi, I. Skoog, and U. Rosenhall. 2018. “Improved Hearing in Swedish 70-Year Olds-a Cohort Comparison over More than Four Decades (1971–2014).” Age and Ageing 47 (3): 437–444. ). doi:10.1093/ageing/afy002.
- Homans, Nienke C., R. Mick Metselaar, J. Gertjan Dingemanse, Marc P. van der Schroeff, Michael P. Brocaar, Marjan H. Wieringa, Rob J. Baatenburg de Jong, et al. 2017. “Prevalence of Age-Related Hearing Loss, Including Sex Differences, in Older Adults in a Large Cohort Study.” The Laryngoscope 127 (3): 725–730. doi:10.1002/lary.26150.
- Hunter, K. P., and J. F. Willott. 1987. “Aging and the Auditory Brainstem Response in Mice with Severe or Minimal Presbycusis.” Hearing Research 30 (2–3): 207–218. doi:10.1016/0378-5955(87)90137-7.
- International Organization for Standardization. 2017. Acoustics-Statistical distribution of hearing thresholds related to age and gender (ISO 7029:2017(E)). Geneva:ISO
- International Organization for Standardization. 2010. Acoustics-Audiometric Test methods-Part 1:Pure-Tone Air and Bone Consuction Audiometry (ISO 8253-1:2010). Geneva: ISO.
- Oeken, J., A. Lenk, and F. Bootz. 2000. “Influence of Age and Presbyacusis on DPOAE.” Acta Oto-Laryngologica 120 (3): 396–403. doi:10.1080/000164800750000630.
- Jerger, J. 1992. “Can Age-Related Decline in Speech Understanding Be Explained by Peripheral Hearing Loss.” Journal of the American Academy of Audiology 3 (1): 33–38.
- Jerger, J., and J. Hall. 1980. “Effects of Age and Sex on Auditory Brainstem Response.” Archives of Otolaryngology 106 (7): 387–391. doi:10.1001/archotol.1980.00790310011003.
- Johansson, M. S. K., and S. D. Arlinger. 2003. “Otoacoustic Emissions and Tympanometry in a General Adult Population in Sweden: Emisiones Otoacústicas y Timpanometría en la Población General Adulta de Suecia.” International Journal of Audiology 42 (8): 448–464. doi:10.3109/14992020309081515.
- Jonsson, R., and U. Rosenhall. 1998. “Hearing in Advanced Age. A Study of Presbyacusis in 85-, 88- and 90-Year-Old People.” International Journal of Audiology 37 (4): 207–218. doi:10.3109/00206099809072975.
- Kaya, Kamil Hakan, Arzu Karaman Koç, İbrahim Sayın, Selçuk Güneş, Sinan Canpolat, Baver Şimşek, and Fatma Tülin Kayhan. 2015. “Etiological Classification of Presbycusis in Turkish Population according to Audiogram Configuration.” Kulak Burun Bogaz Ihtisas Dergisi: KBB = Journal of Ear, Nose, and Throat 25 (1): 1–8. doi:10.5606/kbbihtisas.2015.10179.
- Kemp, D. T. 2002. “Otoacoustic Emissions, Their Origin in Cochlear Function, and Use.” British Medical Bulletin 63: 223–241. doi:10.1093/bmb/63.1.223.
- Kirsh, I., A. Thornton, R. Burkard, and C. Halpin. 1992. “The Effect of Cochlear Hearing Loss on Auditory Brain Stem Response Latency.” Ear and Hearing 13 (4): 233–235. doi:10.1097/00003446-199208000-00004.
- Leskowitz, Matthew J., Francesco F. Caruana, Barbara Siedlecki, Z. Jason Qian, Jaclyn B. Spitzer, and Anil K. Lalwani. 2016. “Asymmetric Hearing Loss is Common and Benign in Patients Aged 95 Years and Older.” The Laryngoscope 126 (7): 1630–1632. doi:10.1002/lary.25503.
- Lightfoot, G. R. 1992. “ABR Screening for Acoustic Neuromata: The Role of Rate-Induced Latency Shift Measurements.” British Journal of Audiology 26 (4): 217–227. doi:10.3109/03005369209076640.
- Lin, F. R., R. Thorpe, S. Gordon-Salant, and L. Ferrucci. 2011. “Hearing Loss Prevalence and Risk Factors among Older Adults in the United States.” The Journals of Gerontology Series A: Biological Sciences and Medical Sciences 66A (5): 582–590. doi:10.1093/gerona/glr002.
- Magnusson, L. 1995. “Reliable Clinical Determination of Speech Recognition Scores Using Swedish PB Words in Speech-Weighted Noise.” Scandinavian Audiology 24 (4): 217–223. doi:10.3109/01050399509047539.
- Magnusson, L. 1996. “Predicting the Speech Recognition Performance of Elderly Individuals with Sensorineural Hearing Impairment a Procedure Based on the Speech Intelligibility Index.” Scandinavian Audiology 25 (4): 215–222. doi:10.3109/01050399609074957.
- Margolis, Robert H., Richard H. Wilson, Gerald R. Popelka, Robert H. Eikelboom, De Wet Swanepoel, and George L. Saly. 2016. “Distribution Characteristics of Air-Bone Gaps – Evidence of Bias in Manual Audiometry.” Ear and Hearing 37 (2): 177–188. doi:10.1097/AUD.0000000000000246.
- Mitchell, C., D. S. Phillips, and D. R. Trune. 1989. “Variables Affecting the Auditory Brainstem Response: Audiogram, Age, Gender and Head Size.” Hearing Research 40 (1–2): 75–85. doi:10.1016/0378-5955(89)90101-9.
- Ohlemiller, K. K. 2004. “Age-Related Hearing Loss: The Status of Schuknecht's Typology.” Current Opinion in Otolaryngology & Head and Neck Surgery 12 (5): 439–443. doi:10.1097/01.moo.0000134450.99615.22.
- Oku, T., and M. Hasegewa. 1997. “The Influence of Aging on Auditory Brainstem Response and Electrocochleography in the Elderly.” ORL; Journal for Oto-Rhino-Laryngology and Its Related Specialties 59 (3): 141–146. doi:10.1159/000276927.
- Patterson, J. V., H. J. Michalewski, L. W. Thompson, T. E. Bowman, and D. K. Litzelman. 1981. “Age and Sex Differences in the Human Auditory Brainstem Response1.” Journal of Gerontology 36 (4): 455–462. doi:10.1093/geronj/36.4.455.
- Profant, Oliver, Jaroslav Tintěra, Zuzana Balogová, Ibrahim Ibrahim, Milan Jilek, and Josef Syka. 2015. “Functional Changes in the Human Auditory Cortex in Ageing.” PLoS One 10 (3): e0116692doi:10.1371/journal.pone.0116692.
- Rosenhall, U. 2003. “The Influence of Ageing on Noise-Induced Hearing Loss.” Noise & Health 5 (20): 47–53.
- Rosenhall, U. 2015. “Epidemiology of Age Related Hearing Loss.” Hearing, Balance and Communication 13 (2): 46–50. doi:10.3109/21695717.2015.1013775.
- Rosenhall, U., C. Hederstierna, and E. Idrizbegovic. 2011. “Otological Diagnoses and Probable age-related auditory neuropathy in ‘younger’ and ‘older’ elderly persons.” Int J Audiol 50 (9): 578–581. doi:10.3109/14992027.2011.580786.
- Rosenhall, U., K. Pedersen, and M. Dotevall. 1986. “Effects of Presbycusis and Other Types of Hearing Loss on Auditory Brainstem Responses.” Scandinavian Audiology 15 (4): 179–185. doi:10.3109/01050398609042141.
- Rosenhamer, H. J., B. Lindström, and T. Lundborg. 1981. “On the Use of Click-Evoked Electric Brainstem Responses in Audiological Diagnosis: IV. Interaural Latency Differences (Wave V) in Cochlear Hearing Loss.” Scandinavian Audiology 10 (2): 67–73. doi:10.3109/01050398109076164.
- Roth, T. N., D. Hanebuth, and R. Probst. 2011. “Prevalence of Age-Related Hearing Loss in Europe: A Review.” European Archives of Oto-Rhino-Laryngology: Oto-Rhino-Laryngology 268: 1101–1107. doi:10.1007/s00405-011-1597-8.
- Rudin, R., K. Svärdsudd, G. Tibblin, and O. Hallén. 1983. “Middle Ear Disease in Samples from the General Population: Prevalence and Incidence of Otitis Media and Its Sequelae the Study of Men Born in 1913–23.” Acta Oto-Laryngologica 96 (3–4): 237–246. doi:10.3109/00016488309132896.
- Rydberg Sterner, T., F. Ahlner, K. Blennow, S. Dahlin-Ivanoff, and H. Falk. 2018. “The Gothenburg H70 Birth Cohort Study 2014–16: design, Methods and Study Population.” European Journal of Epidemiology 34 (2): 191–209. doi:10.1007/s10654-018-0459-8.
- Sardone, Rodolfo, Petronilla Battista, Francesco Panza, Madia Lozupone, Chiara Griseta, Fabio Castellana, Rosa Capozzo, et al. 2019. “The Age-Related Central Auditory Processing Disorder: Silent Impairment of the Cognitive Ear.” Frontiers in Neuroscience 13: 619. doi:10.3389/fnins.2019.00619.
- Schuknecht, H. F., and M. R. Gacek. 1993. “Cochlear Pathology in Presbycusis.” The Annals of Otology, Rhinology, and Laryngology 102 (1 Pt 2): 1–16. doi:10.1177/00034894931020S101.
- Steiger, J. R. 2005. “Audiologic Referral Criteria: Sample Clinic Guidelines.” The Hearing Journal 58 (5): 38–39,42. doi:10.1097/01.HJ.0000287174.23086.36.
- Strouse, A. L., M. T. Ochs, and J. W. Hall. 3rd. 1996. “Evidence against the Influence of Aging on Distortion-Product Otoacoustic Emissions.” J Am Acad Audiol 7 (5): 339–345.
- Syka, J. 2002. “Plastic Changes in the Central Auditory System after Hearing Loss, Restoration of Function, and during Learning.” Physiological Reviews 82 (3): 601–636. doi:10.1152/physrev.00002.2002.
- Trune, D. R., C. Mitchell, and D. S. Phillips. 1988. “The Relative Importance of Head Size, Gender and Age on the Auditory Brainstem Response.” Hearing Research 32 (2–3): 165–174. doi:10.1016/0378-5955(88)90088-3.
- Uchida, Yasue, Fujiko Ando, Hiroshi Shimokata, Saiko Sugiura, Hiromi Ueda, and Tsutomu Nakashima. 2008. “The Effects of Aging on Distortion-Product Otoacoustic Emissions in Adults with Normal Hearing.” Ear and Hearing 29 (2): 176–184. doi:10.1097/aud.0b013e3181634eb8.
- Warzybok, A., T. Brand, K. C. Wagener, and B. Kollmeier. 2015. “How Much Does Language Proficiency by Non-Native Listeners Influence Speech Audiometric Tests in Noise?” International Journal of Audiology 54 (sup2): 88–99. doi:10.3109/14992027.2015.1063715.
- Vinck, B. M., E. De Vel, Z.-M. Xu, and P. B. J. Cauwenberge. 1996. “Distortion Product Otoacoustic Emissions: A Normative Study.” International Journal of Audiology 35 (5): 231–245. doi:10.3109/00206099609071944.