
Abstract
Objective
Many individuals >80 years have difficulties with speech communication due to age-related hearing loss and would benefit from aural rehabilitation. As the proportion of older people increases, there is a need to investigate the prevalence of “disabling hearing loss” to calculate future rehabilitation need. The aims are to determine the prevalence of hearing loss in an unscreened birth cohort of 85-year olds, and to identify differences in audiometric results between two birth cohorts, born 28–29 years apart.
Design
This is a population-based, cross-sectional study that is part of the Gothenburg H70 Birth Cohort Studies.
Study sample
Hearing thresholds were measured and compared between 85-year olds born in 1930 (n = 286) and 1901–1902 (n = 249).
Results
Based on the WHO criteria, the prevalence of “disabling hearing loss” was 45% for men and 43% for women in the latest birth cohort. Hearing thresholds (0.5–4 kHz) for men improved compared with the earlier birth cohort. No such difference was observed for women.
Conclusion
The prevalence of age-related hearing loss over three decades has decreased among 85-year-old men, but has been retained in women. The improvement for men occurred predominantly in the low-mid frequencies. An increased need for aural rehabilitation is expected due to demographic changes.
Introduction
Hearing declines with age, predominately in the high-frequency range. The decline is caused by degenerative changes in both the peripheral and the central auditory system. Age-related hearing loss (ARHL) is associated with communication disabilities (Dalton et al. Citation2003) and cognitive decline (Lin et al. Citation2013). Studies on participants 60–84 years of age, suggest that older persons are likely to benefit not only from the fitting of hearing aids but also from comprehensive aural rehabilitation, including communication strategies (Hennig et al. Citation2012; Lessa et al. Citation2013).
ARHL is expected to increase considerably due to demographic changes. Globally, the number of people aged 80 years and older, is predicted to triple by 2050 (UN Citation2017) and WHO ranks adult onset hearing loss, among the diseases/injuries with the greatest impact on global health (Murray et al. Citation2015). Consequently, meeting the future needs for aural rehabilitation will be a major challenge. The prevalence of hearing loss is affected by environmental and life-style factors, as well as varying resource levels in societies, which change over time. To assess future needs for hearing rehabilitation, it is important to conduct population-based studies and investigate the prevalence of “disabling hearing loss”.
The prevalence of ARHL has been described in previous studies and the results vary due to differences in study settings and the definition of hearing loss used. In a review study of European epidemiological data (Roth, Hanebuth, and Probst Citation2011), roughly 45% of 80-year-old women and 55% of same-age men, were found to have an average hearing loss of 30 dB HL or more at 0.5–4 kHz in the better ear. The WHO definition of hearing loss, i.e. average pure-tone thresholds >25 dB HL at 0.5, 1, 2, and 4 kilohertz (kHz) in the better ear, is often used in population studies. Using this definition, a US study showed an overall hearing loss in 81% of the 80+ group (Goman and Lin Citation2016).
The WHO classifies an average hearing loss of >40 dB HL (at 0.5, 1, 2 and 4 kHz) in the better ear as moderate or worse and describes it as a “disabling hearing loss” (WHO Citation2019a). An updated definition by the Global Burden of Disease (GBD) working group classifies an average loss of 35 dB HL or more at 0.5, 1, 2 and 4 kHz in the better ear, as moderate or worse, i.e. disabling hearing loss. At this level (≥35 dB HL), intervention is definitely beneficial (Stevens et al. Citation2013). Using the GBD definition, Homans et al. (Citation2017) reported a prevalence of disabling hearing loss of 33% in men and almost 29% in women over the age of 65 years. Using the WHO definition of disabling hearing loss (PTA 4 > 40 dB HL) the figure was 21% for men and 18% for women.
Several previous studies have reported on ARHL, yet few have included large unscreened samples of older people above 80 years of age. The present investigation is part of the Gothenburg H70 Birth Cohort Studies (H70), conducted in Sweden (Rydberg Sterner et al. Citation2019), where representative samples of older people have been followed over long periods.
The aims of this study were to determine the prevalence of hearing loss and distribution of different grades of hearing loss, including sex differences, in unscreened 85-year olds (born in 1930) in Gothenburg, Sweden. A secondary aim was to identify differences in audiometric results between two 85-year-old birth cohorts examined 28–29 years apart (born in 1901–1902 and 1930). The findings allow for an assessment of how the need for aural rehabilitation services has developed over the past three decades.
Materials and methods
Study sample
This study has a cross-sectional design and is part of the comprehensive, population-based Gothenburg H70 Birth Cohort Studies (H70), which includes psychiatric, mental, somatic and social health factors and involves a range of disciplines and research teams. The study protocol included physical and psychiatric examinations, examinations of biological markers, health interviews and self-rating questionnaires. To investigate whether prevalence rates based on audiometric results have changed over time, data from a recently studied birth cohort of 85-year olds (born in 1930) were compared with data from a previous birth cohort of 85-year olds (born in 1901–1902) (Jonsson and Rosenhall Citation1998). shows the number of participants for both birth cohorts.
Table 1. Number of participants aged 85 years in the two birth cohorts born in 1930 and 1901–1902.
Birth cohort 1930
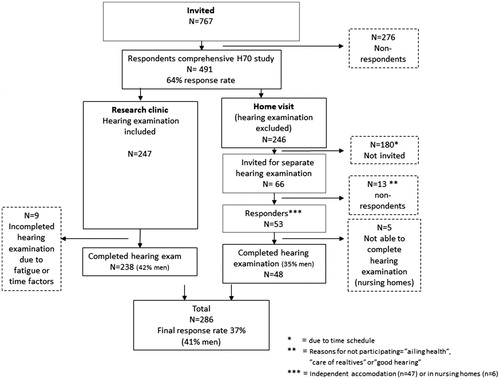
In 2015, adults aged 85 years and living in Gothenburg at the time of selection, or who had previously been examined in H70, were systematically selected based on birth dates in order to produce a representative sample of 85-year olds living in Gothenburg. Individuals born on date 2, 3, 5, 6, 11, 12, 16, 18, 20, 21, 24, 27 or 30 of their respective birth month were selected. The information was obtained through the Swedish national population registry. The only exclusion criterion was difficulty understanding Swedish. A total of 767 adults were invited to take part in the study. The response rate was 64%.
To obtain as many respondents as possible, the participants were free to choose between being examined at the Neuropsychiatric Outpatient Department at Sahlgrenska University Hospital (research clinic) or during a home visit. Subjects chose a home visit for a variety of reasons, some but not all being health related. For practical reasons, the nurses who visited the participants in their homes were unable to bring with them the equipment necessary to carry out proper hearing assessments. Thus, two members of the research team made follow-up home visits to perform hearing tests. Due to time constraints, however, they were only able to visit some (n = 53) of all the home-visit participants.
A total of 286 participants (59% women), underwent a hearing examination (). A majority (n = 238) completed the hearing examination at the research clinic, and 48 did so during a home visit. In total, 44% of the hearing examined sample had mandatory education or less, 34% had more than mandatory but no higher education and 22% had higher education (college or university). The majority of the women (82%) and one-third of the men (36%) were unmarried (widowed, divorced, never married). describes the selection procedure for the 1930 birth cohort.
Figure 1. Flow chart – selection procedure for the 1930 birth cohort.
Birth cohort 1901–1902
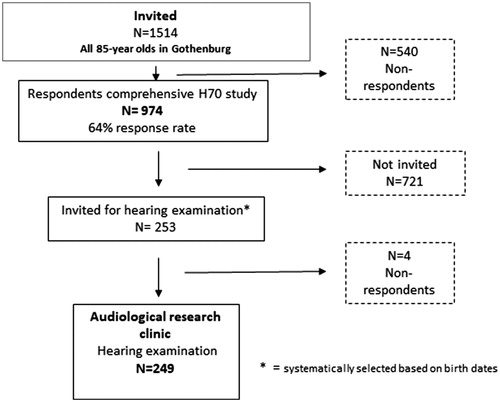
The previously studied birth cohort, born in 1901–1902, was examined in 1986–1987 and included all 85-year-old participants in Gothenburg (n = 1514). A subsample of 253 participants were systematically selected based on birth dates for the audiological study and 249 participants (62% women) were examined with pure-tone audiometry (). describes the selection procedure for the 1901–1902 birth cohort. Further details are presented in Jonsson and Rosenhall (Citation1998).
Figure 2. Flow chart—selection procedure for the 1901–1902 birth cohort.
Hearing protocol 1930
The study protocol for Cohort 1930 consisted of otoscopy and computerised automated pure-tone audiometry, both at the research clinic and during home visits. The audiometry at the research clinic was conducted by research nurses in a quiet office setting. Calibration of the equipment was performed according to ISO 389-8 (2004). The ambient noise level was measured in the office room according to ISO-standards, and the levels fulfilled the background noise requirements (ISO-8253-1 (2010), and ). The home visits were performed by qualified audiologists, who also subjectively carried out the controls of the ambient noise level (ISO 8253-1 (2010), Clause 11.2). The audiometry was performed using an Entomed SA 202-IV audiometer with Sennheiser HDA 200 circum-aural headphones at both the research clinic and during home visits. Support and calibration of the equipment were provided regularly. The automated test procedure to determine hearing thresholds followed ISO 8253-1 (2010), Clause 6.2, to determine hearing thresholds and commenced in the right ear. Air-conduction thresholds were obtained at the test frequencies 0.25, 0.5, 1, 2, 3, 4, 6 and 8 kHz. The audiometer limits were set at 0–90 dB HL. An otoscopic examination was performed.
Table 2. Medians and quartiles in dB HL for the right ear for birth cohorts 1930 and 1901–1902 at 85 years of age.
Table 3. Medians and quartiles in dB HL for the left ear for birth cohorts 1930 and 1901–1902 at 85 years of age.
Hearing protocol 1901–1902
In Cohort 1901–1902, manual pure-tone audiometry was performed by qualified audiologists in a quiet office room at the clinic, using a Madsen OB 70 audiometer with supra-aural TDH-39 headphones, at test frequencies of 0.25, 0.5, 1, 2, 4 and 8 kHz. Calibration was performed according to ISO 389 (1985). The hearing examination commenced in the right ear or in the better ear (according to the subject) and the ascending method was used (ISO 6189 1983). Masking was performed when necessary. The limits of the audiometer were set at 0–120 dB HL. The examination included an otoscopic examination (Jonsson and Rosenhall Citation1998).
Data analysis
Medians and quartiles in dB HL were analysed separately for the right, left, better, and worse ear. To be able to compare median hearing thresholds with results from earlier birth cohort studies within H70, the better and worse ear, respectively, was defined as the ear with the better and the worse pure-tone average overall tested frequencies. As the lower and upper limits of the audiometer were set at 0 dB HL and 90 dB HL, respectively, we found analyses of the 10th and 90th percentiles to be misleading and they were therefore not applied. Since the test range was limited to 0–90 dB HL for the most recently studied cohort and 0–120 dB HL for the previously studied cohort, we set all pure-tone thresholds (PTT) <0 dB HL at 0 dB HL and all thresholds >90 dB HL at 90 dB HL. As hearing thresholds were measured in 5 dB steps, medians were interpolated based on the frequency of occurrences of the measured data. The medians and quartiles are presented for men and women separately, for each frequency, and for both birth cohorts. Due to the non-normal distribution of the data, differences in median PTT between birth cohorts were analysed using a non-parametric Mann-Whitney U-test. An adjustment for multiple statistical tests was considered. However, such tests could increase the risk of a type II error since neighbouring frequencies are correlated and not independent. Consequently, a compromise of p < .01 was used as a requirement for a significant difference to be noted.
Hearing loss prevalence was defined according to the WHO definition, i.e. a four-frequency pure-tone-average (PTA 0.5, 1, 2, 4 kHz) > 25 dB HL in the better ear. We also analysed the prevalence of disabling hearing loss according to the WHO definition (PTA 4 > 40 dB HL in the better ear) and according to the criterion set by GBD i.e. PTA 4 ≥ 35 dB HL in the better ear (Stevens et al. Citation2013).
To classify the different grades of hearing loss in each ear we used the WHO criteria for mild (>25–40 dB HL), moderate (>40–60 dB HL), severe (>60–80 dB HL) and profound (>80 dB HL) hearing loss. This classification is based on PTA 4 in the better ear (WHO Citation2019b). As the highest value was limited to 90 dB HL, we present the prevalence for severe and profound hearing loss as “severe-profound”. Unilateral hearing loss was analysed according to the WHO definition (<25 dB HL PTA 4 in the better ear and >25 dB HL PTA 4 in the worse ear). The better ear is according to WHO and GBD defined as the ear with the best PTA 4 (WHO Citation1991) and this definition is therefore used in all analyses of hearing loss prevalence and grades of hearing loss in the present study.
Changes in the prevalence of disabling hearing loss (according to the WHO definition) between the birth cohorts and between sexes were analysed using Fisher's Exact Test as well as a Binary Logistic Regression Model.
A comparison of hearing thresholds between the two birth cohorts was made using two different audiometric methods, i.e. computerised automated audiometry, using circum-aural headphones (Cohort 1930), and manual audiometry, using supra-aural headphones (Cohort 1901–1902). This comparison was motivated by results from earlier studies (Swanepoel et al. Citation2010; Margolis et al. Citation2011; Mahomed et al. Citation2013) that show good agreement between audiometric results from automated audiometry (using circum-aural headphones) and manual audiometry (using supra-aural headphones).
The Cohort 1930 study was approved by the Regional Ethical Review Board in Gothenburg (Reg.no. 131-15). All participants signed an informed consent form before participating in the study.
Results
Birth cohort hearing threshold comparison
present medians and quartiles of PTTs for the right, left, better, and worse ear for men and women and for both birth cohorts. In and , the better and the worse ear was defined as the ear with the best pure-tone average over all tested frequencies in each cohort
Table 4. Medians and quartiles in dB HL for the better ear for birth cohorts 1930 and 1901–1902 at 85 years of age.
Table 5. Medians and quartiles in dB HL for the worse ear for birth cohort 1930 and 1901–1902 at 85 years of age.
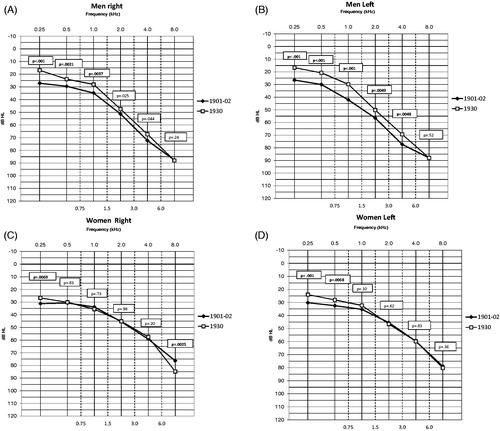
shows medians of PTTs in the right and left ear for both cohorts. Compared with men in Cohort 1901–1902, men in Cohort 1930 showed significantly better hearing thresholds (p < .01) at 0.25–1 kHz in the right ear and at 0.5–4 kHz in the left ear. In contrast, women in Cohort 1930 showed significantly better hearing (p < .01) only at 0.25 kHz (right and left ear), 0.5 kHz (left ear) compared with women in Cohort 1901–1902.
Figure 3. Median PTTs for 85-year-old men for the right and left (A and B) ear and for women for the right and left (C and D) ear for the 1901–1902 and 1930 birth cohorts. p-Values are shown for each frequency and significant p-values are shown in bold (p < .01).
Birth cohort comparison of the four-frequency pure-tone average
shows that the four-frequency pure-tone average, PTA 4, (0.5–4 kHz in the better ear), revealed greater similarity between men and women in Cohort 1930 than in Cohort 1901–1902. There was a significant difference between the sexes in Cohort 1901–1902 (p < .001), but no such difference was observed in Cohort 1930.
Figure 4. PTA 4 (0.5, 1, 2, and 4 kHz) for the better ear for 85-year-old men and women in Cohort 1901–1902 and Cohort 1930. The better ear was defined as the ear with the best PTA4.

Furthermore, PTA 4 was significantly lower (p < .001) in men in Cohort 1930 than in men in Cohort 1901–1902. No such difference was observed among women.
Birth cohort comparison of prevalence of hearing loss
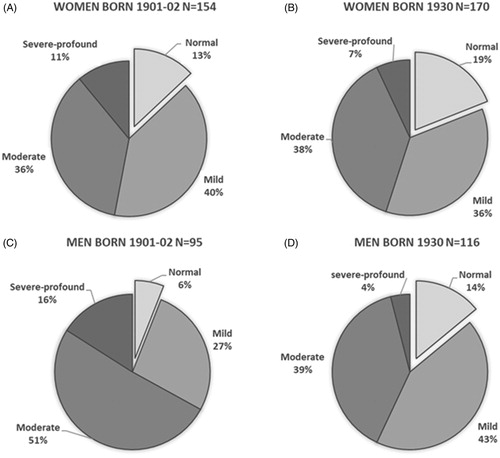
Cohort 1930 showed an overall hearing loss prevalence of 83% (38% mild, 39% moderate and 6% severe-profound) according to the WHO definition of hearing loss. shows the distribution of different grades of hearing loss for both birth cohorts and for men and women separately. For women, there was an almost equal distribution of different grades of hearing loss between the two birth cohorts () while for men the distributions differed ().
Figure 5. Different grades of hearing loss in 85-year-old women (A) and men (C), born in 1901–1902 and women (B) and men (D), born in 1930, according to the WHO definition. The WHO definition is based on PTA 4 in the better ear.
shows the prevalence of disabling hearing loss for both birth cohorts according to the WHO and GBD definitions (for a definition, see table note). The prevalence of disabling hearing loss (WHO definition) was significantly lower (p < .001) among men in Cohort 1930 than among men in Cohort 1901–1902. In contrast, women did not show a significant cohort difference with regard to disabling hearing loss. Furthermore, Cohort 1901–1902 showed a significant sex difference (p < .01) with a higher prevalence of disabling hearing loss in men than in women. No such significant sex difference was observed in Cohort 1930.
Table 6. Prevalence of “disabling hearing loss” for 85 year olds (born in 1930) according to the WHO and GBD definitions.
Unilateral hearing loss
The unilateral hearing loss according to the WHO definition in Cohort 1930 was 6% for both men and women.
Discussion
Prevalence of ARHL
Hearing thresholds have improved over the past three decades for men but not for women and consequently there has been an increase in similarity in hearing acuity between the sexes.
The overall hearing loss prevalence of 83% (WHO definition) in Cohort 1930, as well as the distribution of different grades of hearing loss (38% mild, 39% moderate and 6% severe-profound), are in line with an earlier study. Goman and Lin (Citation2016) reported a prevalence of hearing loss (WHO) of 81%, (36% mild, 38% moderate and 7% severe). The participants in that study were examined during the period 2001–2010. Another study (Cruickshanks et al. Citation1998), with participants examined in 1993, showed a higher prevalence of hearing loss (96.6% in men and 86.1% in women) among participants over 80 years of age, which is more in agreement with the previously studied birth cohort, born in 1901–1902 (94% in men and 87% in women) (Jonsson and Rosenhall Citation1998). Lifestyle and environmental factors change over time, which probably explains the similarity in the results from studies performed during the same periods.
The prevalence of disabling hearing loss (GBD) for Cohort 1930 (61% for men and 63% for women) shows good agreement with Homans et al. (Citation2017), who reported an overall prevalence of disabling hearing loss of approximately 50% for participants aged 80–84 years and above 70% for participants aged 85 years and older.
The unilateral hearing loss prevalence of 6% (WHO definition) in Cohort 1930 was lower compared with the results from Agrawal et al. (Citation2008), which showed a prevalence of 12% (WHO definition). However, the latter study included younger participants, aged 20–69 years, which probably explains the higher prevalence. ARHL usually affects both ears similarly, and the inclusion of older participants naturally leads to a low proportion of unilateral hearing loss compared with studies involving younger participants.
Birth cohort comparison
The finding of better hearing acuity for men and essentially maintained hearing for women at old age (>80 years) conflicts with other recent cohort-studies. Homans et al. (Citation2017) compared an unscreened cohort in Rotterdam, examined in years 2011–2015 and two other earlier internationally acclaimed and unscreened cohorts from US study groups, assessed 20–30 years earlier in the so-called Framingham Study (Gates et al. Citation1990) and Beaver Dam Study (Cruickshanks et al. Citation1998). Their results did not reveal any statistically significant cohort difference with regard to PTA 4 for men over the age of 80 years. However, their results may have been influenced by different methodologies and characteristics of the samples used in the different birth cohorts. Another cohort-study (Zhan et al. Citation2010) showed no birth-cohort difference, or only a slight difference, over a 10-year period for both men and women in the oldest age groups (over 80 years of age). The strength of the present study is the inclusion of two birth cohorts born almost 30 years apart, within the same study group and with participants born in specific years (1901–1902 and 1930) and residing in the same geographical area.
The median hearing thresholds for the 85-year-old participants in both Cohort 1901–1902 and Cohort 1930 were poorer than the calculated median hearing thresholds for 80-year-old participants in the updated ISO 7029 (2017). One explanation for this is that our participants were five years older than the oldest participants in ISO 7029 (2017). The comparison of median hearing thresholds in Cohort 1930 and ISO 7029 (2017) is further described in Göthberg et al. (Citation2019).
Factors behind the improvement in hearing acuity among men
The improvement in hearing acuity among men born in 1930 compared with men born in 1901–1902, can probably to some extent be attributed to less work-related noise exposure among the later-born participants (Jönsson et al. Citation1998). However, participants in Cohort 1930 received the benefit of hearing conservation programme only during the latter part of their working life. During the initial 10–20 years of working life, they had no systematic protection against noise-induced hearing loss. It has been shown that noise exposure during early occupational life is especially detrimental to the hearing (Muhr et al. Citation2019). Rosenhall et al. (Citation2013) compared the same two cohorts included in this study at age 75 and at that age, no significant cohort difference in hearing thresholds and hearing loss prevalence was observed, in either men or women. Although the two compared birth cohorts did not consist entirely of the same participants at 75 years of age as at 85 years of age, the sampling process was the same. If less noise exposure in Cohort 1930 was the only reason for improved hearing among 85-year-old men, a statistically significant better hearing acuity at age 75 would be expected. Another study within H70 (Hoff et al. Citation2018) described similar hearing acuity for pure-tone hearing thresholds among 70-year-old men and women born in 1901–1902 and 1922. This indicates further reasons for the improvement in men’s hearing than a lower level of exposure to noise. Moreover, the improvement in men was observed at low-mid frequencies but less at characteristic noise-related frequencies, which suggests explanations other than a lower level of noise exposure. However, this can to some extent be explained by the fact that hearing at high frequencies declines to a certain level and there is only a little residual hearing sensitivity left to lose which affects lower frequencies at older ages (Pearson et al. Citation1995).
It is tempting to hypothesise that other factors, such as improved general health, social and economic domains as well as, dietary patterns and nutrients, might have influenced men in Cohort 1930. In fact, poorer general health (number of diagnoses) has been associated with poorer hearing acuity in older adults (Sixt and Rosenhall Citation1997). In addition, an epidemiological study of older individuals (Gates et al. Citation1993), reported that low-frequency hearing (0.25–1 kHz) is related to cardiovascular diseases (CVD) in both sexes but especially among women. Furthermore, Rosenhall and Sundh (Citation2006) found a probable correlation between high blood pressure and hearing loss at low and mid frequencies for women at an advanced age, but not for men. However, a recent retrospective study showed a correlation between a decline in hearing and cardiovascular diseases (CVD) and this association was stronger in men than in women (Wattamwar et al. Citation2018), especially at lower frequencies. If CVD affects hearing more in men than in women, potentially better treatment and prevention of CVD in Cohort 1930 may have contributed to the improved hearing acuity in men. These findings should be viewed in the light of previous reports that Cohort 1930 had a lower prevalence of CVD (Zhi et al. Citation2013) and lower blood pressure (Joas et al. Citation2017) than Cohort 1901–1902 did. Further studies are needed to identify possible factors, including health factors, behind the hearing improvement in men and maintained hearing acuity in women.
Consequences of using different definitions of hearing loss
The use of the WHO definition of prevalence and different grades of hearing loss makes the results comparable with those from other studies using the same definition. However, since the WHO definition of hearing loss is based on the better ear, the hearing loss prevalence is underestimated and therefore only a rough estimation. According to the WHO definition, 14–19% () had normal hearing. However, only 7.7–10% of the participants had normal hearing in both ears. Furthermore, the prevalence rates of disabling hearing loss, both according to the WHO and GBD definitions are rough estimations since the term disabling involves much more than hearing acuity for pure-tones. It also includes the bodily functions and structures as well as factors related to activity, participation, and co-operation (Danermark et al. Citation2010) and these aspects need to be taken into consideration when implementing findings related to prevalence of disabling hearing loss in future projections of the need for aural rehabilitation. Persons with mild and unilateral hearing loss may also be in need of intervention. However, the GBD definition of disabling hearing loss (PTA 4 ≥ 35 dB HL) is more stringent compared with the WHO definition (PTA 4 > 40 dB HL) and probably is a better tool to use in assessments of the need for aural rehabilitation. Despite the risk of underestimation, the results show a very high prevalence of disabling hearing loss.
Need for aural rehabilitation
Due to the significantly decreased rate of disabling hearing loss among men in the later born cohort, hearing acuity in men and women became more similar compared with Cohort 1901–1902. This may have led to a more similar proportion of men and women in need for hearing rehabilitation today compared to almost 30 years ago. Despite improved hearing in later-born 85-year-old men, the need for aural rehabilitation will probably increase in the future, due to demographic changes. Women have a higher life expectancy than men, which may lead to more women than men needing aural rehabilitation in the future.
In future calculations of the need for aural rehabilitation services, it will be important to consider that older adults (>80) have difficulties with speech perception (Anderson et al. Citation2012). Comprehensive aural rehabilitation efforts are important for older persons in order to promote future independence and empowerment (Hennig et al. Citation2012), and hence socio-economic benefits.
Strengths and limitations
The strength of this study is the use of a relatively large sample of older participants born in single years (1901–1902 and 1930) and not, as in most other studies, participants within broader age ranges. In gerontological studies using age ranges, younger participants tend to be overrepresented to a greater degree because of health factors.
In population-based studies, there is an ambition to be able to generalise the results to the populations from which the study samples were drawn. However, this poses a challenge when studying adults of advanced age with affected mobility. There is still a possibility that the samples are healthier than the rest of the 85-year-old population. For Cohort 1930 we offered home visits with the aim of improving the participation rate. For practical reasons, it was not possible to perform a hearing examination for all participants who had chosen a home visit. Within the group who chose a home visit in Cohort 1930, there were no significant differences in self-reported health (Pearson χ2 p=.53), level of work-related noise exposure (Fisher’s exact test, p=.29) and level of education (Fisher’s exact test, p=.47) between those who underwent a hearing examination and those who did not. This indicates a minor effect on the generalizability due to the excluded hearing examinations from the home visits. Additionally, the hearing thresholds for men tested during a home visit did not differ from those for men tested at the research clinic. Women tested during a home visit had poorer hearing at the lower frequencies than did women tested at the research clinic.
The sampling process methodology within the H70 study, which incorporates inclusion and exclusion criteria, has been kept the same between the birth cohorts as far as possible. However, there are certain methodological differences and these need to be taken in consideration when analysing the results. For example, the present study compares hearing thresholds from two different audiological methods, i.e. manual audiometry using supra-aural headphones (TDH 39) and computerised automated audiometry using circum-aural headphones (HDA 200). However, an earlier study shows good agreement between the methods (Margolis et al. Citation2011) and automated audiometry provides a reliable, accurate and time-efficient way of measuring hearing thresholds (Swanepoel et al. Citation2010).
The circum-aural HDA 200 headphones have been validated (Brannstrom and Lantz Citation2010) and have the characteristic of attenuating more background noise than TDH 39, which to some extent explains the better median hearing thresholds at low-frequencies in Cohort 1930 than in Cohort 1901–1902. However, the larger cohort difference at low frequencies for men than for women is probably an indication of an improvement at low frequencies for men. Furthermore, if the only reason given for improved low-frequency hearing in Cohort 1930 was differences in the ambient noise level caused by using different headphones in the studies, one might expect an increased effect at the 25th quartile and medians compared with at 75th quartile which was not clearly observed in this study ( and ).
A further difference in methodology between the birth-cohorts is that masking has been used in Cohort 1901–1902 but not in Cohort 1930. Since bone conduction was not performed in Cohort 1930, it is not possible to investigate the need for masking. However, the majority of the participants had symmetric air-conducted thresholds, which indicates that this methodological difference had only a minor impact.
Conclusion
The purpose of this study was to determine the prevalence and distribution of different grades of hearing loss in an unscreened birth cohort of 85-year olds (born in 1930) in Gothenburg, Sweden, and to identify differences in audiometric results, including prevalence rates, between two birth cohorts born almost 30 years apart (born in 1901–1902 and 1930, respectively).
The prevalence of hearing loss (according to the WHO definition) is high in old age (>80%) for both men and women. The hearing thresholds at low and mid frequencies, including frequencies important for speech comprehension, improved significantly for 85-year-old men born in 1930 compared with 85-year-old men born almost 30 years earlier (1901–1902). The prevalence of disabling (moderate-severe) hearing loss (according to the WHO definition) also decreased significantly for 85-year-old men over the three decades. In contrast, no significant cohort difference was observed for women with regard to hearing thresholds (1–6 kHz) or prevalence of disabling hearing loss (the WHO definition). Hearing acuity consequently became more similar between the sexes in Cohort 1930, indicating a similar need for hearing services among 85-year-old men and women. Demographic changes including increased life expectancy will probably increase the need for aural rehabilitation in the future. We discussed various explanatory factors behind the improvement in 85-year-old men for the low-mid frequencies. Further studies are required to identify possible contributing factors.
Acknowledgement
We express our appreciation to the nurses who carried out the audiometric clinic examinations, to the co-workers who assisted in data collection and statistical support and to other members of the H70 study for their co-operation.
Disclosure statement
No potential conflict of interest was reported by the author(s).
Correction Statement
This article has been republished with minor changes. These changes do not impact the academic content of the article.
Additional information
Funding
References
- Agrawal, Y., E. A. Platz, and J. K. Niparko. 2008. “Prevalence of Hearing Loss and Differences by Demographic Characteristics among US Adults: data from the National Health and Nutrition Examination Survey 1999-2004.” Archives of Internal Medicine 168 (14): 1522–1530. doi:https://doi.org/10.1001/archinte.168.14.1522.
- Anderson, S., A. Parbery-Clark, T. White-Schwoch, and N. Kraus. 2012. “Aging Affects Neural Precision of Speech Encoding.” Journal of Neuroscience 32 (41): 14156–14164. doi:https://doi.org/10.1523/jneurosci.2176-12.2012.
- Brannstrom, K. J., and J. Lantz. 2010. “ Interaural Attenuation for Sennheiser HDA 200 Circumaural Earphones.” International Journal of Audiology 49 (6): 467–471. doi:https://doi.org/10.3109/14992021003663111.
- Cruickshanks, K. J., T. L. Wiley, T. S. Tweed, B. E. Klein, R. Klein, J. A. Mares-Perlman, and D. M. Nondahl. 1998. “Prevalence of Hearing Loss in Older Adults in Beaver Dam, Wisconsin. The Epidemiology of Hearing Loss Study.” American Journal of Epidemiology 148 (9): 879–886. doi:https://doi.org/10.1093/oxfordjournals.aje.a009713.
- Dalton, D. S., K. J. Cruickshanks, B. E. Klein, R. Klein, T. L. Wiley, and D. M. Nondahl. 2003. “The Impact of Hearing Loss on Quality of Life in Older Adults.” The Gerontologist 43 (5): 661–668. doi:https://doi.org/10.1093/geront/43.5.661.
- Danermark, B., A. Cieza, J. -P. Gangé, F. Gimigliano, S. Granberg, L. Hickson, S. E. Kramer, et al. 2010. “International Classification of Functioning, Disability, and Health Core Sets for Hearing Loss: A Discussion Paper and Invitation.” International Journal of Audiology 49 (4): 256–262. doi:https://doi.org/10.3109/14992020903410110.
- Gates, G. A., J. L. Cobb, R. B. D’Agostino, and P. A. Wolf. 1993. “The Relation of Hearing in the Elderly to the Presence of Cardiovascular Disease and Cardiovascular Risk Factors.” Archives of Otolaryngology – Head and Neck Surgery 119 (2): 156–161. doi:https://doi.org/10.1001/archotol.1993.01880140038006.
- Gates, G. A., J. C. J. Cooper, W. B. Kannel, and N. J. Miller. 1990. “Hearing in the Elderly: The Framingham Cohort, 1983-1985: Part 1. Basic Audiometric Test Results.” Ear and Hearing 11 (4): 247–256. doi:https://doi.org/10.1097/00003446-199008000-00001.
- Goman, A. M., and F. R. Lin. 2016. “Prevalence of Hearing Loss by Severity in the United States.” American Journal of Public Health 106 (10): 1820–1822. doi:https://doi.org/10.2105/ajph.2016.303299.
- Göthberg, H., U. Rosenhall, T. Tengstrand, T. Rydberg Sterner, H. Wetterberg, A. Zettergren, I. Skoog, and A. Sadeghi. 2019. “Cross-Sectional Assessment of Hearing Acuity of an Unscreened 85-Year-Old cohort - Including a 10-Year Longitudinal Study of a Sub-Sample.” Hearing Research 382: 107797. doi:https://doi.org/10.1016/j.heares.2019.107797.
- Hennig, T. R., M. J. Costa, A. G. Rossi, and A. B. Moraes. 2012. “Auditory Rehabilitation Effects on the Temporal Ordering Ability in Elderly Hearing Aids Users.” Jornal da Sociedade Brasileira de Fonoaudiologia 24 (1): 26–33. doi:https://doi.org/10.1590/S2179-64912012000100006.
- Hoff, M., T. Tengstrand, A. Sadeghi, I. Skoog, and U. Rosenhall. 2018. “Improved Hearing in Swedish 70-Year Olds - a Cohort Comparison over More than Four Decades (1971–2014).” Age and Ageing 47 (3): 437–444. doi:https://doi.org/10.1093/ageing/afy002.
- Homans, N. C., R. M. Metselaar, J. G. Dingemanse, M. P. van der Schroeff, M. P. Brocaar, M. H. Wieringa, R. J. Baatenburg de Jong, A. Hofman, and A. Goedegebure. 2017. “Prevalence of Age-Related Hearing Loss, Including Sex Differences, in Older Adults in a Large Cohort Study.” The Laryngoscope 127 (3): 725–730. doi:https://doi.org/10.1002/lary.26150.
- International Organisation for Standardization. 2004. Acoustics-Reference Zero for the Calibration of Audiometri Equipment. Part 8: Reference Equivalent Threshold Sound Pressure Levels for Pure-Tones and Circum-Aural Earphones. ISO-389-8:2004. Geneva, Switzerland: ISO.
- International Organisation for Standardization. 1983. Pure-Tone Air Conduction Threshold Audiometry for Hearing Conservation Purposes. ISO 6189: 1983. Geneva, Switzerland: ISO.
- International Organisation for Standardization. 2010. Acoustics Audiometric Test Methods- Part 1: Basic Pure-Tone air and Bone Conduction Threshold Audiometry. ISO 8253-1:2010. Geneva, Switzerland: ISO.
- Joas, E., X. Guo, S. Kern, S. Ostling, and I. Skoog. 2017. “Sex Differences in Time Trends of Blood Pressure among Swedish Septuagenarians Examined Three Decades apart: A Longitudinal Population Study.” Journal of Hypertension 35 (7): 1424–1431. doi:https://doi.org/10.1097/hjh.0000000000001348.
- Jonsson, R., and U. Rosenhall. 1998. “Hearing in Advanced Age. A Study of Presbyacusis in 85-, 88- and 90-Year-Old People.” Audiology 37 (4): 207–218. doi:https://doi.org/10.3109/00206099809072975.
- Jönsson, R., U. Rosenhall, I. Gause-Nilsson, and B. Steen. 1998. “Auditory Function in 70- and 75-Year-Olds of Four Age Cohorts.” Scandinavian Audiology 27 (2): 81–93. doi:https://doi.org/10.1080/010503998420324.
- Lessa, A. H., T. R. Hennig, M. J. Costa, and A. G. Rossi. 2013. “Results of Auditory Rehabilitation in Elderly Users of Hearing Aids Evaluated by a Dichotic Test.” CoDAS[São Paulo, Brazil] 25 (2): 169–175. doi:https://doi.org/10.1590/S2317-17822013000200013.
- Lin, F. R., K. Yaffe, J. Xia, Q. -L. Xue, T. B. Harris, E. Purchase-Helzner, S. Satterfield, et al.; Health ABC Study Group. 2013. “Hearing Loss and Cognitive Decline in Older Adults.” JAMA Internal Medicine 173 (4): 293–299. doi:https://doi.org/10.1001/jamainternmed.2013.1868.
- Mahomed, F., D. Swanepoel, R. Eikelboom, and M. Soer. 2013. “Validity of Automated Threshold Audiometry: A Systematic Review and Meta-Analysis.” Ear and Hearing 34 (6): 745–752. doi:https://doi.org/10.1097/01.aud.0000436255.53747.a4.
- Margolis, R. H., R. Frisina, and J. P. Walton. 2011. “AMTAS: Automated Method for Testing Auditory Sensitivity: II. Air Conduction Audiograms in Children and Adults.” International Journal of Audiology 50 (7): 434–439. doi:https://doi.org/10.3109/14992027.2011.553206.
- Muhr, P., A.-C. Johnson, J. Selander, E. Svensson, and U. Rosenhall. 2019. “Noise Exposure and Hearing Impairment in Air-Force Pilots.” Aerospace Medicine and Human Performance 90 (9): 757–763. doi:https://doi.org/10.3357/AMHP.5353.2019.
- Murray, C. J. L., R. M. Barber, K. J. Foreman, A. A. Ozgoren, F. Abd-Allah, S. F. Abera, V. Aboyans, et al. 2015. “Global, Regional, and National Disability-Adjusted Life Years (DALYs) for 306 Diseases and Injuries and Healthy Life Expectancy (HALE) for 188 Countries, 1990–2013: Quantifying the Epidemiological Transition.” The Lancet 386 (10009): 2145–2191. doi:https://doi.org/10.1016/S0140-6736(15)61340-X.
- Pearson, J. D., C. H. Morrell, S. Gordon-Salant, L. J. Brant, E. J. Metter, L. L. Klein, and J. L. Fozard. 1995. “Gender Differences in a Longitudinal Study of Age-Associated Hearing Loss.” The Journal of the Acoustical Society of America 97 (2): 1196–1205. doi:https://doi.org/10.1121/1.412231.
- Rosenhall, U., C. Moller, and C. Hederstierna. 2013. “Hearing of 75-Year Old Persons over Three Decades: Has Hearing Changed?” International Journal of Audiology 52 (11): 731–739. doi:https://doi.org/10.3109/14992027.2013.808381.
- Rosenhall, U., and V. Sundh. 2006. “Age-Related Hearing Loss and Blood Pressure.” Noise and Health 8 (31): 88–94. doi:https://doi.org/10.4103/1463-1741.33539.
- Roth, T. N., D. Hanebuth, and R. Probst. 2011. “Prevalence of Age-Related Hearing Loss in Europe: A Review.” European Archives of Oto-Rhino-Laryngology 268 (8): 1101–1107. doi:https://doi.org/10.1007/s00405-011-1597-8.
- Rydberg Sterner, T., F. Ahlner, K. Blennow, S. Dahlin-Ivanoff, H. Falk, L. Havstam Johansson, M. Hoff, et al. 2019. “The Gothenburg H70 Birth Cohort Study 2014-16: design, Methods and Study Population.” European Journal of Epidemiology 34 (2): 191–209. doi:https://doi.org/10.1007/s10654-018-0459-8.
- Sixt, E., and U. Rosenhall. 1997. “Presbyacusis Related to Socioeconomic Factors and State of Health.” Scandinavian Audiology 26 (3): 133–140. doi:https://doi.org/10.3109/01050399709074986.
- Stevens, G., S. Flaxman, E. Brunskill, M. Mascarenhas, C. D. Mathers, and M. Finucane, on behalf of the Global Burden of Disease Hearing Loss Expert Group 2013. “Global and Regional Hearing Impairment Prevalence: An Analysis of 42 Studies in 29 Countries.” European Journal of Public Health 23 (1): 146–152. doi:https://doi.org/10.1093/eurpub/ckr176.
- Swanepoel, D., S. Mngemane, S. Molemong, H. Mkwanazi, and S. Tutshini. 2010. “Hearing Assessment-Reliability, Accuracy and Efficiency of Automated Audiometry.” Telemedicine and e-Health 16 (5): 557–563. doi:https://doi.org/10.1089/tmj.2009.0143.
- United Nations (UN). 2017. “World population ageing (Highlights).” Accessed 12 May 2018. http://www.un.org/en/development/desa/population/publications/pdf/ageing/WPA2017_Highlights.pdf
- Wattamwar, K., Z. J. Qian, J. Otter, M. J. Leskowitz, F. F. Caruana, B. Siedlecki, … A. K. Lalwani. 2018. “Association of Cardiovascular Comorbidities with Hearing Loss in the Older Old.” JAMA Otolaryngology–Head and Neck Surgery 144 (7): 623–629. doi:https://doi.org/10.1001/jamaoto.2018.0643.
- World Health Organization (WHO). 2019a. “Deafness and Hearing.” Accessed 20 May 2019. https://www.who.int/news-room/fact-sheets/detail/deafness-and-hearing-loss
- World Health Organization (WHO). 2019b. “Prevention of blindness and deafness.” Accessed 20 May 2019. https://www.who.int/pbd/deafness/hearing_impairment_grades/en/
- World Health Organization (WHO). 1991. “Report of the Informal Working Group On Prevention Of Deafness And Hearing Impairment Programme Planning.” Accessed 23 January 2020. https://apps.who.int/iris/handle/10665/58839
- Zhan, W., K. J. Cruickshanks, B. E. K. Klein, R. Klein, G.-H. Huang, J. S. Pankow, R. E. Gangnon, and T. S. Tweed. 2010. “Generational Differences in the Prevalence of Hearing Impairment in Older Adults.” American Journal of Epidemiology 171 (2): 260–266. doi:https://doi.org/10.1093/aje/kwp370.
- Zhi, X., E. Joas, M. Waern, S. Ostling, A. Borjesson-Hanson, and I. Skoog. 2013. “Prevalence of Cardiovascular Disorders and Risk Factors in Two 75-Year-Old Birth Cohorts Examined in 1976-1977 and 2005-2006.” Aging Clinical and Experimental Research 25 (4): 377–383. doi:https://doi.org/10.1007/s40520-013-0058-1.