
Abstract
Objective
To encourage researchers to perform high-frequency threshold estimation using a technique outlined by Rieke and colleagues, described as fixed-level frequency threshold estimation. Their method used a Bekesy-style roving tone to estimate the highest audible frequency of a listener. The tone was fixed in its intensity (SPL) and changed in frequency as the participant indicated whether they could perceive the tone, or not. This was developed specifically for ototoxicity monitoring in the extended high-frequency region. Rieke and colleagues established that this approach to measuring hearing thresholds is both fast and reliable.
Design
The current article extends this approach to using a simple PC-soundcard-transducer setup and the method of limits to rapidly establish the highest audible frequency of a listener.
Study sample: 24 listeners performed standard and fixed-level audiometry in the extended high-frequency range.
Results
The method described is rapid and reliable and a single summary metric is obtained for each listener.
Conclusions
The advantage of the described approach over standard pure-tone audiometry in the extended high-frequency range is the time taken, the ability to avoid missing data points and the risk of distortions or electrical noise when close to maximal system output.
Introduction
Routine investigations of human hearing test less than half the total range of the auditory system. Standard clinical audiometric testing goes up to 8000 Hz (British Society of Audiology Citation2011) and it is often assumed that there is little value in assessing the extended high-frequency (EHF) hearing of listeners. While this may currently be true for routine clinical investigations, there has recently been much interest in measuring these responses in basic research studies in order to establish whether EHF hearing can provide any new insights into normal and abnormal auditory function. One particular area where this is close to becoming common-place is in the the cochlear synaptopathy literature and, more generally, work which investigates sub-clinical listening difficulties. Cochlear synaptopathy (sometimes referred to as “hidden hearing loss”) describes a loss of cochlear synapses which leads to a loss of information ascending the auditory nerve, despite normal audiometric function. Cochlear synaptopathy occurs as a result of ageing and noise exposure and many studies have recorded EHF thresholds in their cohorts to establish whether this region of cochlear function might be a proxy for damage to the auditory system and may be able to predict the existence of, or likely development of, changes to auditory physiology in the standard range (Liberman et al. Citation2016; Prendergast, Guest, et al. Citation2017; Bramhall et al. Citation2017; Guest et al. Citation2017; Grose, Buss, and Hall Citation2017).
Often, the assumption is that there is little direct value of hearing in the EHF range, though evaluating hearing sensitivity in this range may be a reliable proxy for other sub-clinical changes to audition. Despite this, there is evidence that information from the EHF range can be used directly by listeners. Motlagh Zadeh et al. (Citation2019) reported that the presence of acoustic information above 8000 Hz enhanced speech perception in noise and Monson et al. (Citation2019) provided evidence that EHFs are able to assist a listener in performing auditory segregation.
One area in which there has been a clear clinical utility for EHF thresholds is in the administration of ototoxic drugs for cancer treatment. A number of treatment pathways rely on drugs which are known to cause damage to cochlear function; typically the platinum chemotherapeutic compounds cisplatin and carboplatin (Kennedy et al. Citation1990; Schweitzer Citation1993). In addition, aminoglycosides, typically used to treat infection, have been found to have ototoxic effects (Matz Citation1993). These ototoxic changes typically manifest initially as changes to audiometric sensitivity in the EHF range (Fausti et al. Citation1999). Monitoring hearing is a necessary precaution to take in patients undergoing treatment for cancer but must compete against monitoring and treatment for other, potentially more serious, co-morbidities which understandably take priority over audiometric testing. Therefore there is real value in being able to evaluate the EHFs rapidly and reliably in this cohort in order to monitor any longitudinal changes to audiometric sensitivity in the EHF range.
Fausti et al. (Citation1999) outlined an approach in which a range of frequencies could be identified at an initial hearing screen which would remove the testing of needless frequencies at later appointments and still allow monitoring of the EHF hearing capabilities of the patient. Rieke et al. (Citation2017) went further and developed a test for hearing which would longitudinally allow monitoring of the highest audible frequency in around 30-seconds. The test involved playing a sound to patients at a fixed sound intensity and roving the frequency based on whether the patient could hear the sound or not. The method was demonstrated to be as reliable as standard fixed-frequency audiometry (a method which we will refer to throughout this manuscript as PTA; pure tone audiometry), yet was able to establish the highest audible frequency in around a tenth of the time. This fixed-level frequency threshold (FLFT; the alternative method where intensity is fixed and frequency roves) measure could also potentially be used to quantify EHF hearing capabilities in basic research studies.
It is clear that there is currently much appetite in basic research studies for considering the role of EHF hearing in our understanding of healthy and impaired auditory function (Hunter et al. Citation2020). However when conducting these measurements using the standard PTA methodology there are a number of issues, not encountered when performing audiometry in the conventional range, which must be considered and mitigated. The first is the choice of which frequencies to test at, the second is the issue of missing data points and the third is the risk of encountering artefacts when requiring very high outputs from the hardware being used. Some basic research studies perform testing at a limited number of EHFs (Prendergast, Guest, et al. Citation2017; Prendergast, Millman, et al. Citation2017; Guest et al. Citation2017), and the estimate of how good a listeners’ EHF hearing is could be critically dependent on the specific frequencies measured. Other studies (Liberman et al. Citation2016; Bramhall et al. Citation2017) perform testing at a range of EHFs but it can be difficult to combine these into a summary metric due to the presence of missing data points. When testing people over the age of 40-, or even 30-years of age, the likelihood of observing no measurable threshold at 16 kHz increases dramatically and so the information available with which to stratify listeners based on their EHF thresholds becomes reduced. Finally, the maximum output of audiometers is around 90 and 75 dB HL at 14,000 and 16,000 Hz, respectively, which corresponds to 123.5 and 120.5 dB sound pressure level (SPL), assuming the use of HDA 300 supra-aural transducers and an Interacoustics Equinox 2.0 audiometer. Such high intensities at these frequencies place severe demands on the hardware and such systems should be thoroughly and regularly checked for artefacts. It is difficult for a researcher or audiologist to check the hardware by listening to the sounds as this would involve the risk of injurious noise exposure. It is possible that low-frequency electrical noise or transducer artefact is audible at high output levels and mitigating this risk by monitoring the outputs can be time-consuming.
Rieke et al. (Citation2017) discuss the suitability of their FLFT method for evaluating hearing thresholds in the normal-hearing population for the purpose of basic research studies. Here we adapt their method into a standard psychophysics framework which requires no more than a PC, soundcard and headphones to run. We evaluate a number of summary statistics to demonstrate the suitability of the approach for measuring the EHF thresholds of a cohort. The specific SPL chosen can be made appropriate for the age range and hearing profiles being studied, but the main advantages are speed of acquisition, the ability to eliminate missing data points and to ensure that maximal hardware outputs are not required. It is our view that all basic and translational research studies interested in measuring EHF hearing can benefit from using the FLFT approach rather than the routine PTA method of evaluating hearing sensitivity at individual frequencies.
Methods
Participants
Twenty-four listeners were tested (16 males) with a mean age of 27.25 years (SD = 5.53, range = 22–39 years). Recruitment criteria required participants to be aged 18–50 years and to be fluent in written and spoken English in order to be able to understand the written materials, ask any questions and provide informed written consent. Participants were not screened for their hearing profile, although all participants satisfied the common criterion for clinically normal hearing and had thresholds of 20 dB HL or better at all frequencies below 8000 Hz.
Standard pure tone audiometry
Standard range pure tone audiometry was performed for the right ear at octave frequencies between 250 and 8000 Hz in accordance with the British Society of Audiology (Citation2011) recommended procedure. Thresholds were measured using a Kamplex KC 50 clinical audiometer coupled to TDH-39 supra-aural headphones, with MX41 cushions. EHF frequency audiometry was also performed in the right ear using the same audiometer coupled to Sennheiser HDA 300 circum-aural headphones. Thresholds were established using the same technique as for frequencies in the standard range. Thresholds were measured at 10,000, 12,000, 15,000, and 16,000 Hz using pure tones (the tone at 15,000 Hz was actually 15102 Hz, but will be referred to as 15,000 Hz for ease).
FLFT estimation
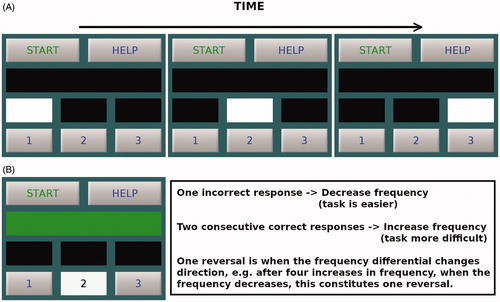
FLFTs were measured using a Creative E-MU 0202 USB soundcard and Sennheiser HDA 200 circum-aural headphones, designed for high-frequency audiometry. The sound stimulus was a pure-tone which was varied adaptively in frequency whilst remaining fixed in sound level (SPL). Sounds were converted from digital to analogue at a sample rate of 48,000 Hz using 24-bit depth. A three-alternative forced-choice procedure was used, with a two-down, one-up staircase adaptively setting the stimulus level. provides a schematic overview of a single trial and demonstrates the visual cues given over time (panel A) along with a descriptor of what happens after a correct and incorrect response (panel B). Only a single interval of the three contained a physical stimulus and participants selected which one using a keyboard. The frequency of the tone for the next stimulus was then increased or decreased based on the staircase criteria shown in panel B of Figure 1. Stimuli were 220 ms in duration (including 10-ms raised-cosine ramps) and there was an inter-stimulus interval of 500 ms between each of the 3 tones. The three intervals were visually cued and participants were required to select the one interval which contained a tone by pressing a button on the keyboard. Stimulus level was fixed at either 40, or 70 dB SPL. For the 40 dB SPL condition, the starting frequency was 8000 Hz and for the 70 dB SPL condition, the starting frequency of the tone was 16,000 Hz. The step size was 1000 Hz for the first 4 reversals and this was reduced to 250 Hz for the final 10 reversals. FLFTs were calculated by averaging the tone frequency of the final 10 reversals from a single run. Thresholds were estimated twice at each SPL, with conditions presented in a pseudo-random order. The output measure for each individual consisted of two average frequencies; one for the 40 dB SPL condition and one for the 70 dB SPL condition.
Figure 1. Schematic showing the structure of trial presentation and response. Panel A shows the three intervals being visually cued over time. Panel B shows the feedback given for a correct response and a summary of how the sound frequency for the next trial is changed based upon the responses of previous trials.
Analysis
The main analysis was a correlation between FLFTs and thresholds measured using the standard PTA approach. This analysis allows quantification of the extent to which the different FLFT measures agree with the standard PTA. These correlations can be difficult to interpret in isolation, and so the correlation seen between frequencies in the standard range are also presented to provide context. Additional summary statistics presented include the coefficient of variation (CoV) which is the ratio of the standard deviation to the mean and provides a standardised measure of dispersion to assess the variability of the FLFT measure with that of standard audiometry. The lower the CoV, the more precise the estimate of the underlying parameter. The root-mean-squared difference (RMSD) was also be used to quantify the reliability of the FLFT method across the different runs at each intensity.
Results
presents a summary of thresholds for the two approaches at each frequency/intensity tested. The typical time taken to acquire FLFT was ∼2 min per run. The time taken to estimate frequency thresholds at 70 dB was slightly longer than at 40 dB and this was likely due to the starting frequency used. The efficiency of the procedure could be increased by optimising the step size and number of reversals.
Table 1. Average thresholds across the two measurement methods are shown along with standard deviations and the coefficient of variation for each measure.
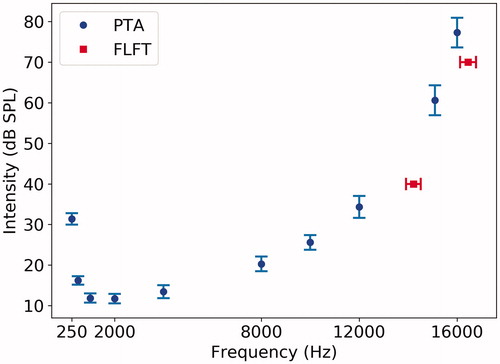
shows the grand average (and 95% confidence intervals) across the full cohort for both the PTA thresholds and the FLFTs.
Figure 2. Average thresholds (shown in dB SPL for ease of comparison) across the full cohort are shown for the 6 frequencies tested in the conventional range and the 4 EHFs using standard PTA methodology (circles). The squares denote the average FLFTs at 40 and 70 dB SPL. Error bars show 95% confidence intervals.
Correlations
Inspection of indicates that there is a strong correlation between the FLFT method of estimating high-frequency hearing and the highest pure tone frequencies assessed (15,000 and 16,000 Hz). For each FLFT level, there is a single summary metric for each listener, which is the highest audible frequency at that sound intensity. The values (in Hz) are averaged across the two runs and these values for each listener are correlated with the PTA thresholds at each discrete frequency. The average FLFT at 40 dB SPL was 14,101 Hz and at 70 dB SPL was 16,349 Hz. These correlations are strong, which suggests the two methods of characterising high-frequency hearing give comparable estimates of how sensitive a listeners hearing is in the EHF range. The correlation between FLFTs at the two levels was 0.66 (p < 0.001). These correlations are potentially difficult to interpret as an absolute value in isolation and so it is informative to consider the strength of correlation between the different pure-tone frequencies used for the standard assay of hearing (PTA). shows the strength of correlation between each of the discrete frequencies used for PTA in both the standard and EHF range. Firstly, even for neighbouring frequencies, the correlations are in general not as strong as those seen for FLFTs and the highest-frequency pure tones used in the PTA assessment (15,000 and 16,000 Hz). Secondly, there are only weak correlations across PTA thresholds for the four EHFs (test frequencies above 8000 Hz), which suggests that the relative fidelity of hearing across the cohort of listeners would look different depending on which PTA frequency was used. It must be noted that the number of participants with PTA thresholds greater than 20 dB HL was, 1, 4, 9 and 15 at 1000 Hz, 12,000 Hz, 15,000 Hz and 16,000 Hz, respectively. Therefore the weak correlations will be in part due to the fact that some participants’ hearing declines as the frequency increases. However, it is also the case that some people with poor thresholds at 12000 Hz then have better hearing thresholds at the higher frequencies.
Table 2. Spearman correlation coefficients between standard PTA thresholds (measured in dB HL) and FLFTs (measured in Hz) at 40 and 70 dB.
Table 3. Spearman correlation coefficients across standard PTA thresholds (dB HL).
Test–retest
The FLFT measure was performed twice at each SPL and it is, therefore, possible to summarise the average difference between the two. For the approach used here, the RMSD between the two replications was 284 Hz at 40 dB SPL and 176 Hz at 70 dB SPL, which represents 2.01% and 1.08% of the mean, respectively.
Co-efficient of variation
The coefficient of variation for the FLFT method was 11% at both presentation levels. The audiometric thresholds were first converted from dB HL to dB SPL in order to be able to compute a coefficient of variation. ISO 389-5 (2006) does not include values at 12,000 or 15,000 Hz, but as the function describing the relation between HL and SPL is predominantly linear between 10,000 and 16,000 Hz, the values required were estimated via interpolation. The coefficient of variation for the PTA approach was, on average, 39% across the full frequency range. The lowest value was 22% for 250 Hz and the average for the standard and EHF ranges were 43% and 32% respectively.
Discussion
The initial FLFT approach outlined by Rieke et al. (Citation2017) was shown to be quick and reliable in comparison with performing standard PTA in the EHF range. The current implementation demonstrated that it is possible to use the FLFT method of hearing evaluation within a standard psychophysics framework and a three-alternative forced-choice paradigm delivered via a PC. The procedure remains as quick and as reliable as the initial implementation described by Rieke et al. (Citation2017). The correlations indicate that the FLFT approach yields a measure of hearing which agrees with that obtained when using the highest frequencies available with which to perform standard PTA. The test-retest descriptive statistics reported in the current study compare favourably with Rieke et al. (Citation2017), who reported a RMSD of ∼400 Hz in the 8,000–16,000 Hz range (using an 80 dB SPL presentation level).
At the beginning of this article, we outlined three potential problems with performing audiometry in the EHF range, the first of which was how the test frequencies in the EHF range are selected. A naive assumption, often implicit in our experiments on normal-hearing listeners, is that someone with good hearing at 1000 Hz will also have better hearing at the other frequencies tested in the conventional range, compared to a listener with poorer hearing at 1000 Hz. Such an assumption is supported to some degree by the correlations seen in for the standard audiometric frequencies (8000 Hz and below). It can also be seen in that the strength of correlation is not as strong in the EHF range; not even for frequencies which are the same number of hertz apart from each other as for some of the standard audiometric frequencies. This does indicate that if a study were to only select a single frequency to test, the choice of frequency would have a deciding impact on the observed values. Though the FLFT approach is still vulnerable to incorrectly characterising EHF hearing due to an elevation at a specific frequency, this can be mitigated by performing an ascending and descending staircase to ensure they converge. It is also quicker given that the FLFT roves across the EHF range. A secondary, but still potentially limiting, issue is the cost involved in purchasing a clinical system with EHF capability or adding an extra module to an existing clinical system to allow EHF thresholds to be measured. In short, it is much more accessible and cost-effective to be able to use a standard PC with an external soundcard and appropriate transducers.
The current study used an opportunity sample which consisted of young people with clinically normal hearing yet still there were 4 missing data points when using PTA in the EHF range. By replacing these values with the maximum system output +5 dB and +10 dB at 15,000 Hz and 16,000 Hz, respectively, which reduces the accuracy of the data. If a study were to test more people, people with a mild hearing loss, or people older than 40 then this incidence of missing data points can only increase.
The specific level chosen at which to perform the FLFT measurement can be informed by the specific population being tested. If a study seeks to test young listeners with normal hearing, then a quieter level would be preferable to loud level to ensure the highest audible frequency is not near the limits of human hearing or the maximum permissible frequency produced by the hardware. Similarly, the level needs to be quiet enough such the highest audible frequency does not simply give equivalent information as standard PTA at 8000 Hz. The measurement will then yield a single number which characterises hearing in the EHF range without the need to combine information across different frequencies into a summary metric.
Summary
FLFTs can be rapidly and reliably obtained using a standard PC-soundcard-headphone setup.
A single number is used to characterise the EHF sensitivity of a listener.
Provided the SPL of the tones is chosen appropriately, there will be no missing data points; each participant will have a measurable response.
EHF thresholds can be obtained in all listeners without needing to drive hardware to its limits and risk electrical noise or transducer artefacts being detected by the listener.
Acknowledgements
This work was supported by the NIHR Manchester Biomedical Research Centre.
Disclosure statement
No potential conflict of interest was reported by the author(s).
References
- Bramhall, N. F., D. Konrad-Martin, G. P. McMillan, and S. E. Griest. 2017. “Auditory Brainstem Response Altered in Humans with Noise Exposure despite Normal Outer Hair Cell Function.” Ear and Hearing 38 (1): e1–e12. doi:10.1097/AUD.0000000000000370.
- British Society of Audiology. 2011. Pure-Tone Air-Conduction and Bone-Conduction Threshold Audiometry with and without Masking. Reading, UK: British Society of Audiology.
- Fausti, S. A., J. A. Henry, W. J. Helt, D. S. Phillips, R. H. Frey, D. Noffsinger, V. D. Larson, and C. G. Fowler. 1999. “An Individualized, Sensitive Frequency Range for Early Detection of Ototoxicity.” Ear and Hearing 20 (6): 497–505.
- Grose, J. H., E. Buss, and J. W. Hall, 3rd. 2017. “Loud Music Exposure and Cochlear Synaptopathy in Young Adults: Isolated Auditory Brainstem Response Effects but No Perceptual Consequences.” Trends in Hearing 21: 1–18. doi:10.1177/2331216517737417.
- Guest, H., K. J. Munro, G. Prendergast, S. Howe, and C. J. Plack. 2017. “Tinnitus with a Normal Audiogram: Relation to Noise Exposure but No Evidence for Cochlear Synaptopathy.” Hearing Research 344: 265–274. doi:10.1016/j.heares.2016.12.002.
- Hunter, L. L., B. B. Monson, D. R. Moore, S. Dhar, B. A. Wright, K. J. Munro, L. M. Zadeh, C. M. Blankenship, S. M. Stiepan, and J. H. Siegel. 2020. “Extended High Frequency Hearing and Speech Perception Implications in Adults and Children.” Hearing Research 10:7922.doi:10.1016/j.heares.2020.107922.
- Kennedy, I. C., B. M. Fitzharris, B. M. Colls, and C. H. Atkinson. 1990. “Carboplatin is Ototoxic.” Cancer Chemotherapy and Pharmacology 26 (3): 232–234. doi:10.1007/BF02897206.
- Liberman, M. C., M. J. Epstein, S. S. Cleveland, H. Wang, and S. F. Maison. 2016. “Toward a Differential Diagnosis of Hidden Hearing Loss in Humans.” PLoS One 11 (9): e0162726. doi:10.1371/journal.pone.0162726.
- Matz, G. J. 1993. “Aminoglycoside Cochlear Ototoxicity.” Otolaryngologic Clinics of North America 26: 705–712.
- Monson, B. B., J. Rock, A. Schulz, E. Hoffman, and E. Buss. 2019. “Ecological Cocktail party listening reveals the utility of extended high-frequency hearing.” Hearing Research 381: 107773. doi:10.1016/j.heares.2019.107773.
- Motlagh Zadeh, L., N. H. Silbert, K. Sternasty, D. W. Swanepoel, L. L. Hunter, and D. R. Moore. 2019. “Extended High-Frequency Hearing Enhances Speech Perception in Noise.” Proceedings of the National Academy of Sciences 116 (47): 23753–23759. doi:10.1073/pnas.1903315116.
- Prendergast, G., H. Guest, K. J. Munro, K. Kluk, A. Léger, D. A. Hall, M. G. Heinz, and C. J. Plack. 2017. “Effects of Noise Exposure on Young Adults with Normal Audiograms I: Electrophysiology.” Hearing Research 344: 68–81. doi:10.1016/j.heares.2016.10.028.
- Prendergast, G., R. E. Millman, H. Guest, K. J. Munro, K. Kluk, R. S. Dewey, D. A. Hall, M. G. Heinz, and C. J. Plack. 2017. “Effects of Noise Exposure on Young Adults with Normal Audiograms II: Behavioral Measures.” Hearing Research 356: 74–86. doi:10.1016/j.heares.2017.10.007.
- Rieke, C. C., O. H. Clavier, L. V. Allen, A. P. Anderson, C. A. Brooks, A. M. Fellows, D. S. Brungart, and J. C. Buckey. 2017. “Fixed-Level Frequency Threshold Testing for Ototoxicity Monitoring.” Ear and Hearing 38 (6): e369–e375. doi:10.1097/AUD.0000000000000433.
- Schweitzer, V. G. 1993. “Ototoxicity of Chemotherapeutic Agents.” Otolaryngologic Clinics of North America 26: 759–789.